Lake Bosworth, WA Map & Demographics
Lake Bosworth Map
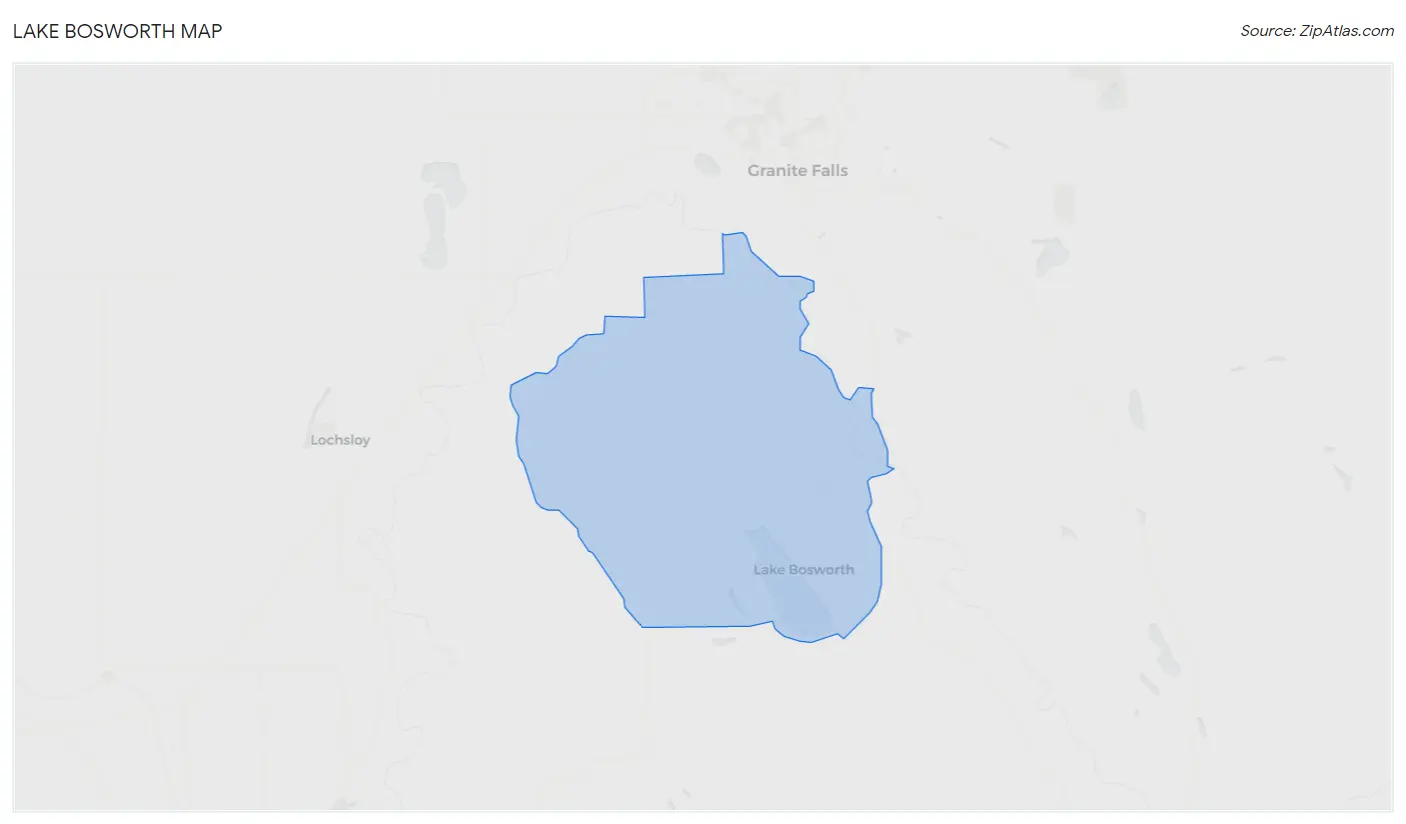
Lake Bosworth Overview
$48,374
PER CAPITA INCOME
$137,750
AVG FAMILY INCOME
$122,917
AVG HOUSEHOLD INCOME
0.34
INEQUALITY / GINI INDEX
1,059
TOTAL POPULATION
554
MALE POPULATION
505
FEMALE POPULATION
109.70
MALES / 100 FEMALES
91.16
FEMALES / 100 MALES
49.0
MEDIAN AGE
2.8
AVG FAMILY SIZE
2.8
AVG HOUSEHOLD SIZE
584
LABOR FORCE [ PEOPLE ]
63.8%
PERCENT IN LABOR FORCE
5.5%
UNEMPLOYMENT RATE
Income in Lake Bosworth
Income Overview in Lake Bosworth
Per Capita Income in Lake Bosworth is $48,374, while median incomes of families and households are $137,750 and $122,917 respectively.
| Characteristic | Number | Measure |
| Per Capita Income | 1,059 | $48,374 |
| Median Family Income | 313 | $137,750 |
| Mean Family Income | 313 | $148,065 |
| Median Household Income | 383 | $122,917 |
| Mean Household Income | 383 | $133,113 |
| Income Deficit | 313 | $0 |
| Wage / Income Gap (%) | 1,059 | 0.00% |
| Wage / Income Gap ($) | 1,059 | 100.00¢ per $1 |
| Gini / Inequality Index | 1,059 | 0.34 |
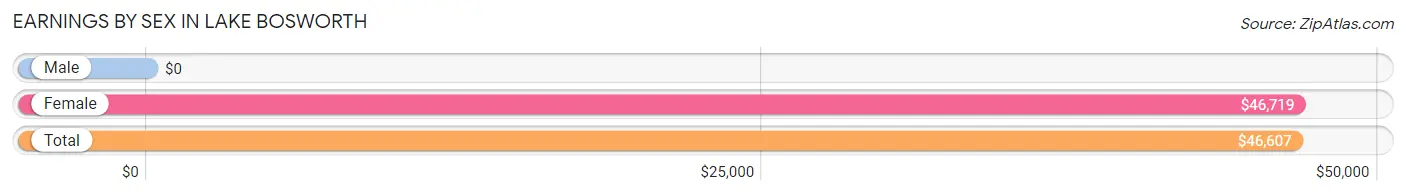
Earnings by Sex in Lake Bosworth
| Sex | Number | Average Earnings |
| Male | 347 (57.3%) | $0 |
| Female | 259 (42.7%) | $46,719 |
| Total | 606 (100.0%) | $46,607 |
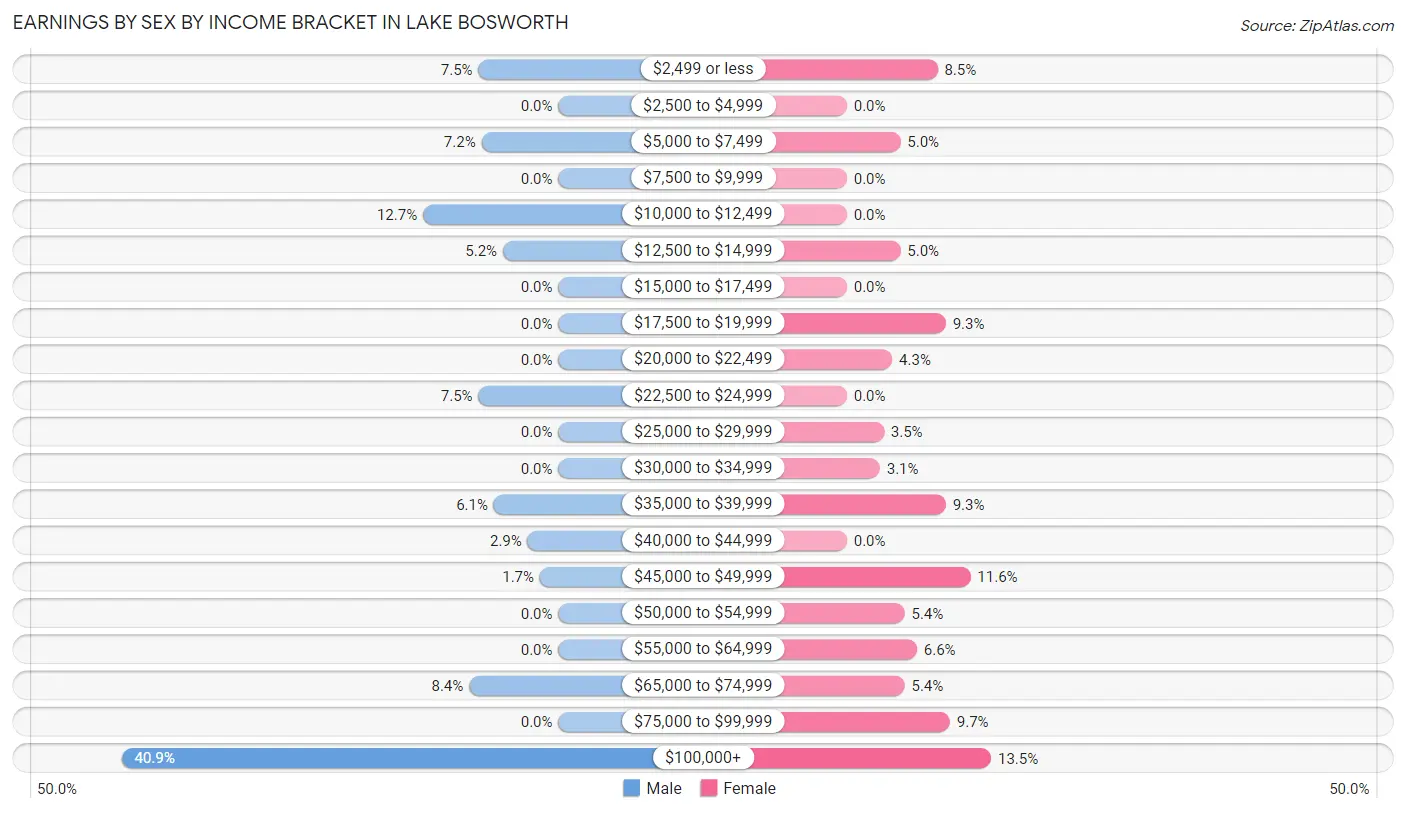
Earnings by Sex by Income Bracket in Lake Bosworth
The most common earnings brackets in Lake Bosworth are $100,000+ for men (142 | 40.9%) and $100,000+ for women (35 | 13.5%).
| Income | Male | Female |
| $2,499 or less | 26 (7.5%) | 22 (8.5%) |
| $2,500 to $4,999 | 0 (0.0%) | 0 (0.0%) |
| $5,000 to $7,499 | 25 (7.2%) | 13 (5.0%) |
| $7,500 to $9,999 | 0 (0.0%) | 0 (0.0%) |
| $10,000 to $12,499 | 44 (12.7%) | 0 (0.0%) |
| $12,500 to $14,999 | 18 (5.2%) | 13 (5.0%) |
| $15,000 to $17,499 | 0 (0.0%) | 0 (0.0%) |
| $17,500 to $19,999 | 0 (0.0%) | 24 (9.3%) |
| $20,000 to $22,499 | 0 (0.0%) | 11 (4.3%) |
| $22,500 to $24,999 | 26 (7.5%) | 0 (0.0%) |
| $25,000 to $29,999 | 0 (0.0%) | 9 (3.5%) |
| $30,000 to $34,999 | 0 (0.0%) | 8 (3.1%) |
| $35,000 to $39,999 | 21 (6.0%) | 24 (9.3%) |
| $40,000 to $44,999 | 10 (2.9%) | 0 (0.0%) |
| $45,000 to $49,999 | 6 (1.7%) | 30 (11.6%) |
| $50,000 to $54,999 | 0 (0.0%) | 14 (5.4%) |
| $55,000 to $64,999 | 0 (0.0%) | 17 (6.6%) |
| $65,000 to $74,999 | 29 (8.4%) | 14 (5.4%) |
| $75,000 to $99,999 | 0 (0.0%) | 25 (9.7%) |
| $100,000+ | 142 (40.9%) | 35 (13.5%) |
| Total | 347 (100.0%) | 259 (100.0%) |
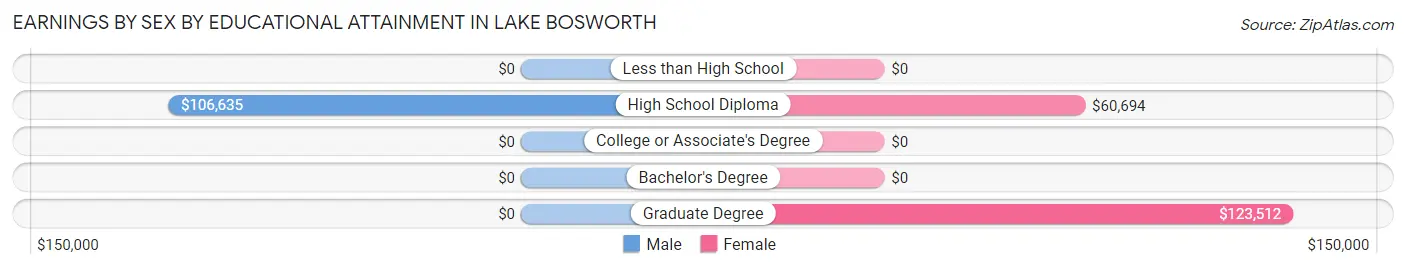
Earnings by Sex by Educational Attainment in Lake Bosworth
Average earnings in Lake Bosworth are $72,321 for men and $49,318 for women, a difference of 31.8%. Men with an educational attainment of high school diploma enjoy the highest average annual earnings of $106,635, while those with high school diploma education earn the least with $106,635. Women with an educational attainment of graduate degree earn the most with the average annual earnings of $123,512, while those with high school diploma education have the smallest earnings of $60,694.
| Educational Attainment | Male Income | Female Income |
| Less than High School | - | - |
| High School Diploma | $106,635 | $60,694 |
| College or Associate's Degree | - | - |
| Bachelor's Degree | - | - |
| Graduate Degree | - | - |
| Total | $72,321 | $49,318 |
Family Income in Lake Bosworth
Family Income Brackets in Lake Bosworth
According to the Lake Bosworth family income data, there are 104 families falling into the $150,000 to $199,999 income range, which is the most common income bracket and makes up 33.2% of all families.
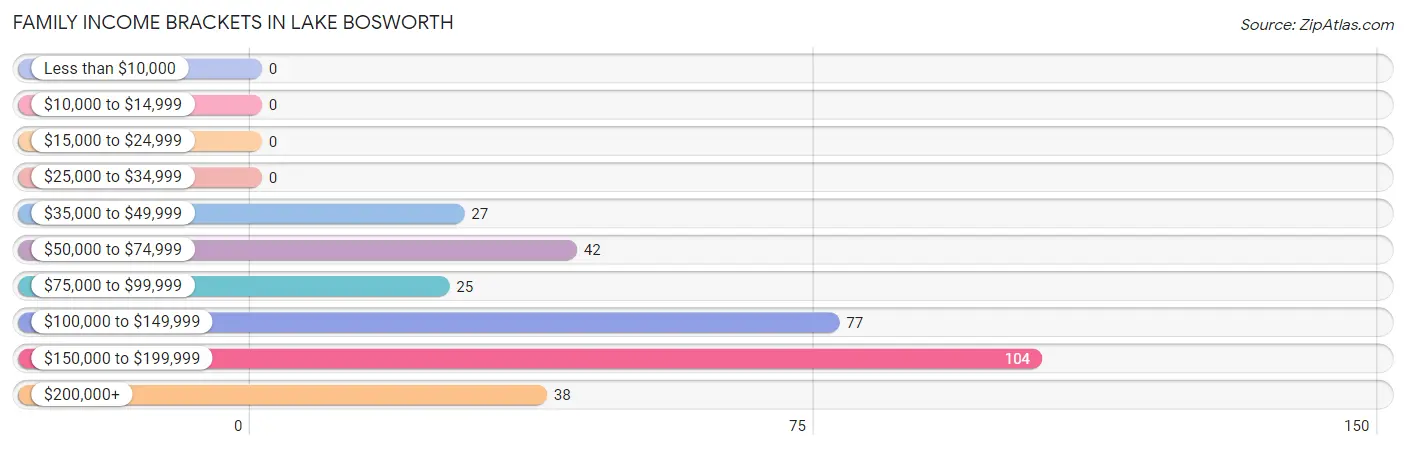
| Income Bracket | # Families | % Families |
| Less than $10,000 | 0 | 0.0% |
| $10,000 to $14,999 | 0 | 0.0% |
| $15,000 to $24,999 | 0 | 0.0% |
| $25,000 to $34,999 | 0 | 0.0% |
| $35,000 to $49,999 | 27 | 8.6% |
| $50,000 to $74,999 | 42 | 13.4% |
| $75,000 to $99,999 | 25 | 8.0% |
| $100,000 to $149,999 | 77 | 24.6% |
| $150,000 to $199,999 | 104 | 33.2% |
| $200,000+ | 38 | 12.1% |
Family Income by Famaliy Size in Lake Bosworth
3-person families (39 | 12.5%) account for the highest median family income in Lake Bosworth with $185,446 per family, while 3-person families (39 | 12.5%) have the highest median income of $61,815 per family member.
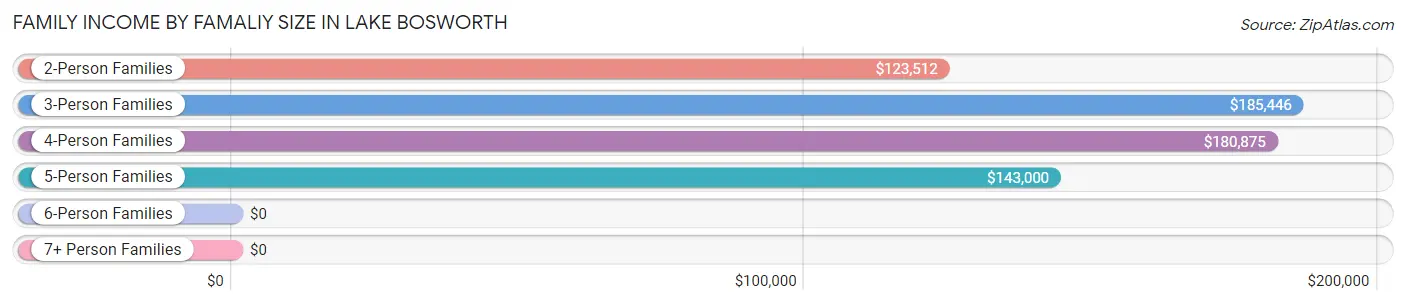
| Income Bracket | # Families | Median Income |
| 2-Person Families | 201 (64.2%) | $123,512 |
| 3-Person Families | 39 (12.5%) | $185,446 |
| 4-Person Families | 25 (8.0%) | $180,875 |
| 5-Person Families | 48 (15.3%) | $143,000 |
| 6-Person Families | 0 (0.0%) | $0 |
| 7+ Person Families | 0 (0.0%) | $0 |
| Total | 313 (100.0%) | $137,750 |
Family Income by Number of Earners in Lake Bosworth
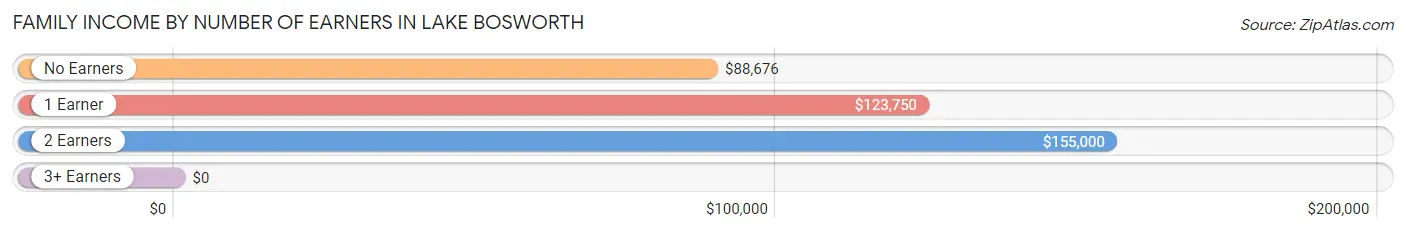
| Number of Earners | # Families | Median Income |
| No Earners | 54 (17.2%) | $88,676 |
| 1 Earner | 59 (18.9%) | $123,750 |
| 2 Earners | 162 (51.8%) | $155,000 |
| 3+ Earners | 38 (12.1%) | $0 |
| Total | 313 (100.0%) | $137,750 |
Household Income in Lake Bosworth
Household Income Brackets in Lake Bosworth
With 112 households falling in the category, the $150,000 to $199,999 income range is the most frequent in Lake Bosworth, accounting for 29.2% of all households.
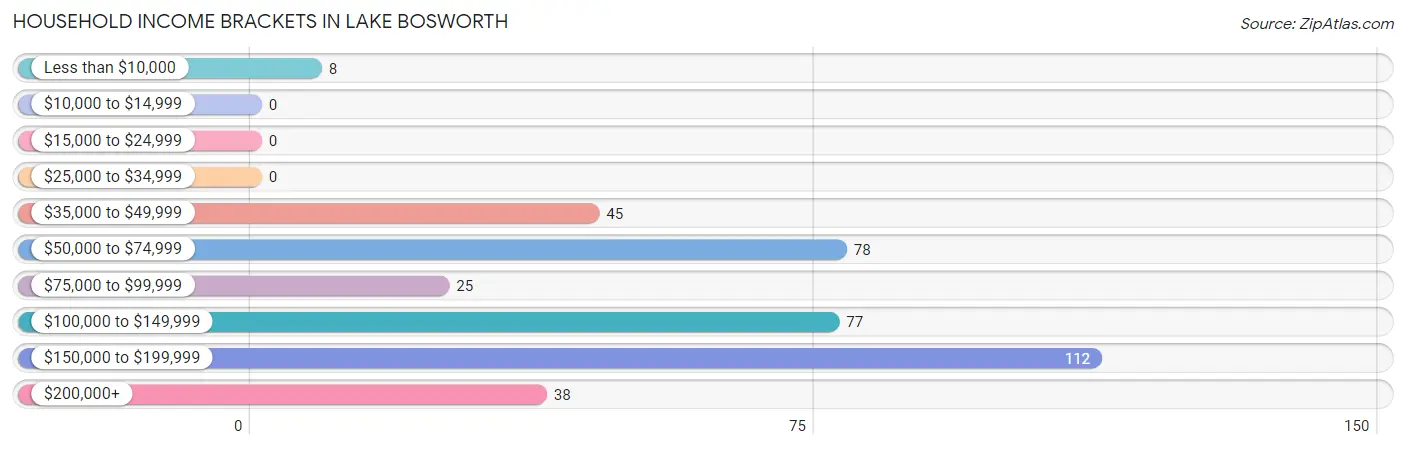
| Income Bracket | # Households | % Households |
| Less than $10,000 | 8 | 2.1% |
| $10,000 to $14,999 | 0 | 0.0% |
| $15,000 to $24,999 | 0 | 0.0% |
| $25,000 to $34,999 | 0 | 0.0% |
| $35,000 to $49,999 | 45 | 11.7% |
| $50,000 to $74,999 | 78 | 20.4% |
| $75,000 to $99,999 | 25 | 6.5% |
| $100,000 to $149,999 | 77 | 20.1% |
| $150,000 to $199,999 | 112 | 29.2% |
| $200,000+ | 38 | 9.9% |
Household Income by Householder Age in Lake Bosworth
The median household income in Lake Bosworth is $122,917, with the highest median household income of $159,861 found in the 45 to 64 years age bracket for the primary householder. A total of 193 households (50.4%) fall into this category.
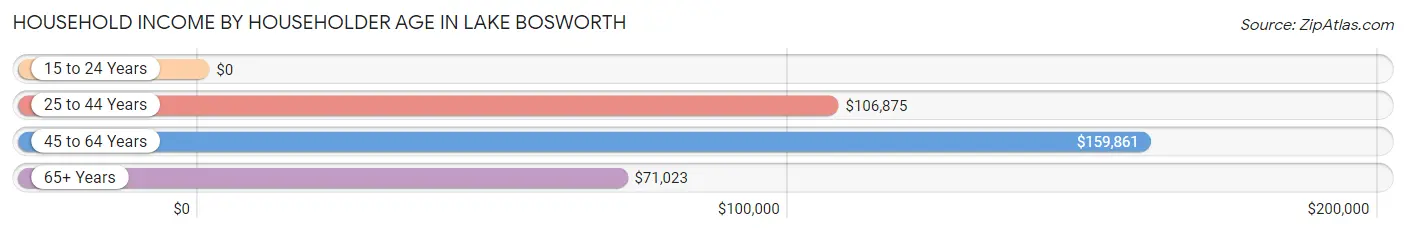
| Income Bracket | # Households | Median Income |
| 15 to 24 Years | 0 (0.0%) | $0 |
| 25 to 44 Years | 61 (15.9%) | $106,875 |
| 45 to 64 Years | 193 (50.4%) | $159,861 |
| 65+ Years | 129 (33.7%) | $71,023 |
| Total | 383 (100.0%) | $122,917 |
Poverty in Lake Bosworth
Income Below Poverty by Sex and Age in Lake Bosworth
With 5.8% poverty level for males and 9.4% for females among the residents of Lake Bosworth, 55 to 64 year old males and 45 to 54 year old females are the most vulnerable to poverty, with 32 males (21.3%) and 30 females (28.8%) in their respective age groups living below the poverty level.
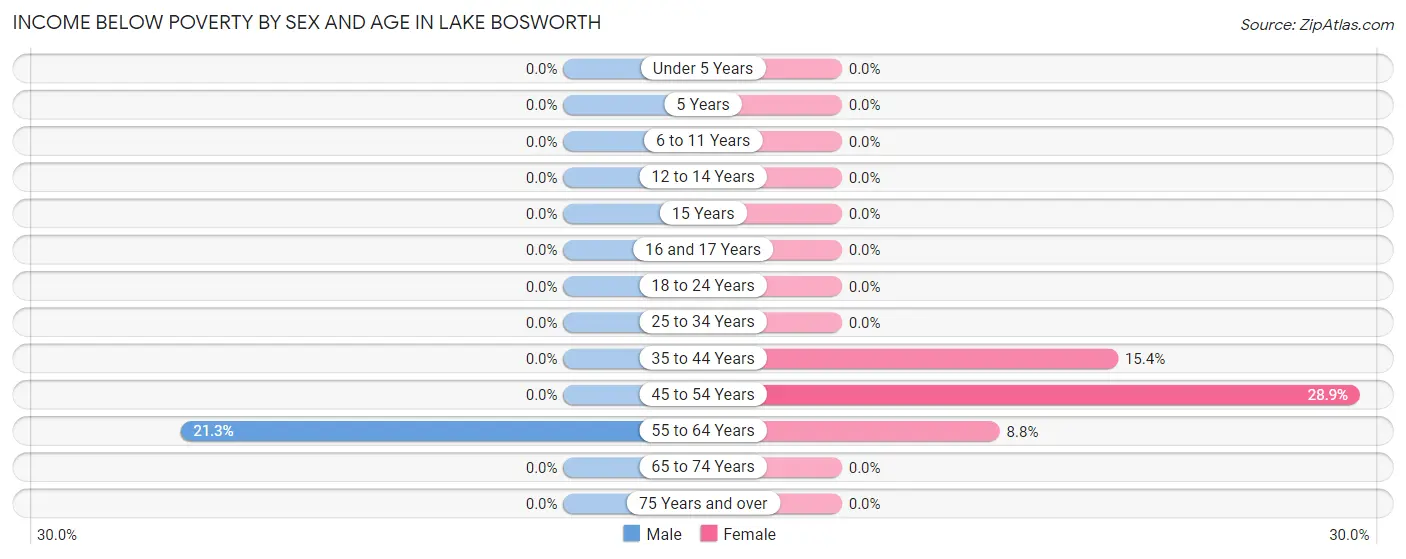
| Age Bracket | Male | Female |
| Under 5 Years | 0 (0.0%) | 0 (0.0%) |
| 5 Years | 0 (0.0%) | 0 (0.0%) |
| 6 to 11 Years | 0 (0.0%) | 0 (0.0%) |
| 12 to 14 Years | 0 (0.0%) | 0 (0.0%) |
| 15 Years | 0 (0.0%) | 0 (0.0%) |
| 16 and 17 Years | 0 (0.0%) | 0 (0.0%) |
| 18 to 24 Years | 0 (0.0%) | 0 (0.0%) |
| 25 to 34 Years | 0 (0.0%) | 0 (0.0%) |
| 35 to 44 Years | 0 (0.0%) | 8 (15.4%) |
| 45 to 54 Years | 0 (0.0%) | 30 (28.8%) |
| 55 to 64 Years | 32 (21.3%) | 8 (8.8%) |
| 65 to 74 Years | 0 (0.0%) | 0 (0.0%) |
| 75 Years and over | 0 (0.0%) | 0 (0.0%) |
| Total | 32 (5.8%) | 46 (9.4%) |
Income Above Poverty by Sex and Age in Lake Bosworth
According to the poverty statistics in Lake Bosworth, males aged under 5 years and females aged under 5 years are the age groups that are most secure financially, with 100.0% of males and 100.0% of females in these age groups living above the poverty line.
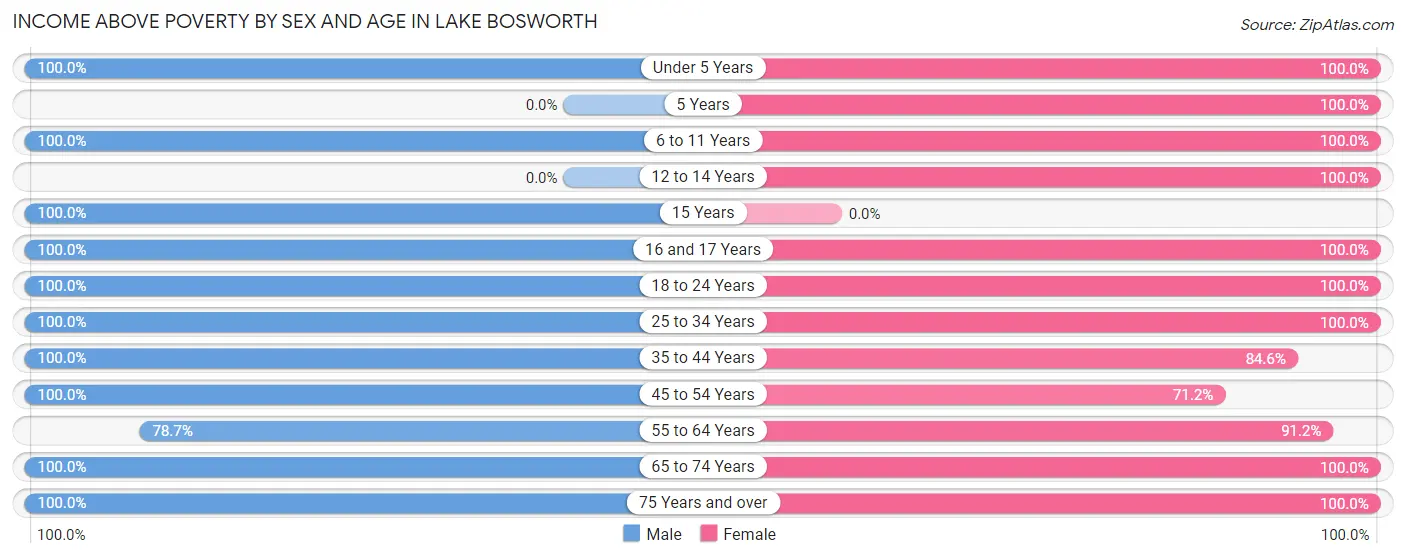
| Age Bracket | Male | Female |
| Under 5 Years | 13 (100.0%) | 21 (100.0%) |
| 5 Years | 0 (0.0%) | 9 (100.0%) |
| 6 to 11 Years | 32 (100.0%) | 23 (100.0%) |
| 12 to 14 Years | 0 (0.0%) | 16 (100.0%) |
| 15 Years | 16 (100.0%) | 0 (0.0%) |
| 16 and 17 Years | 17 (100.0%) | 9 (100.0%) |
| 18 to 24 Years | 50 (100.0%) | 37 (100.0%) |
| 25 to 34 Years | 44 (100.0%) | 14 (100.0%) |
| 35 to 44 Years | 58 (100.0%) | 44 (84.6%) |
| 45 to 54 Years | 83 (100.0%) | 74 (71.2%) |
| 55 to 64 Years | 118 (78.7%) | 83 (91.2%) |
| 65 to 74 Years | 84 (100.0%) | 36 (100.0%) |
| 75 Years and over | 7 (100.0%) | 79 (100.0%) |
| Total | 522 (94.2%) | 445 (90.6%) |
Income Below Poverty Among Married-Couple Families in Lake Bosworth
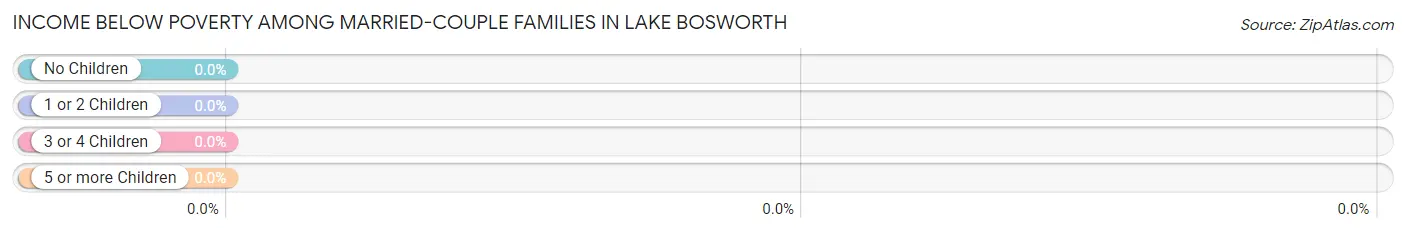
| Children | Above Poverty | Below Poverty |
| No Children | 208 (100.0%) | 0 (0.0%) |
| 1 or 2 Children | 29 (100.0%) | 0 (0.0%) |
| 3 or 4 Children | 30 (100.0%) | 0 (0.0%) |
| 5 or more Children | 0 (0.0%) | 0 (0.0%) |
| Total | 267 (100.0%) | 0 (0.0%) |
Income Below Poverty Among Single-Parent Households in Lake Bosworth
| Children | Single Father | Single Mother |
| No Children | 0 (0.0%) | 0 (0.0%) |
| 1 or 2 Children | 0 (0.0%) | 0 (0.0%) |
| 3 or 4 Children | 0 (0.0%) | 0 (0.0%) |
| 5 or more Children | 0 (0.0%) | 0 (0.0%) |
| Total | 0 (0.0%) | 0 (0.0%) |
Income Below Poverty Among Married-Couple vs Single-Parent Households in Lake Bosworth
| Children | Married-Couple Families | Single-Parent Households |
| No Children | 0 (0.0%) | 0 (0.0%) |
| 1 or 2 Children | 0 (0.0%) | 0 (0.0%) |
| 3 or 4 Children | 0 (0.0%) | 0 (0.0%) |
| 5 or more Children | 0 (0.0%) | 0 (0.0%) |
| Total | 0 (0.0%) | 0 (0.0%) |
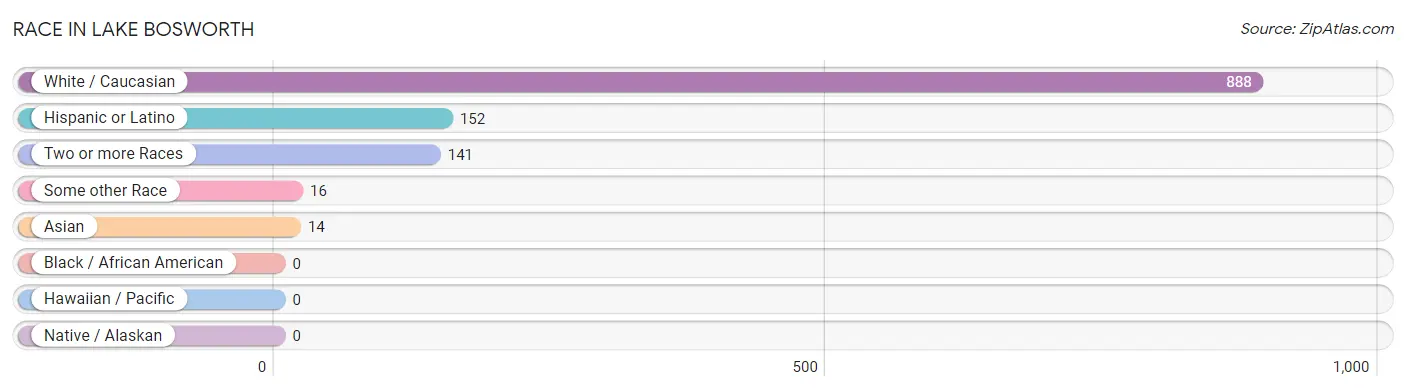
Race in Lake Bosworth
The most populous races in Lake Bosworth are White / Caucasian (888 | 83.9%), Hispanic or Latino (152 | 14.3%), and Two or more Races (141 | 13.3%).
| Race | # Population | % Population |
| Asian | 14 | 1.3% |
| Black / African American | 0 | 0.0% |
| Hawaiian / Pacific | 0 | 0.0% |
| Hispanic or Latino | 152 | 14.3% |
| Native / Alaskan | 0 | 0.0% |
| White / Caucasian | 888 | 83.9% |
| Two or more Races | 141 | 13.3% |
| Some other Race | 16 | 1.5% |
| Total | 1,059 | 100.0% |
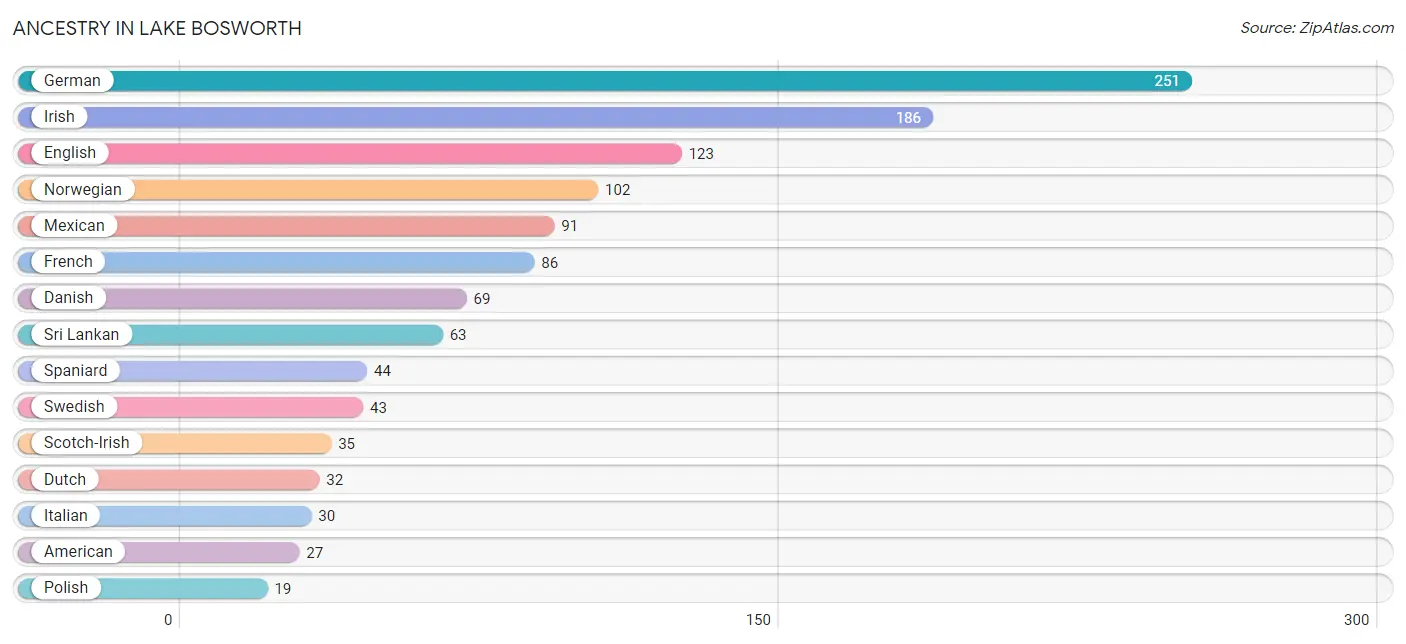
Ancestry in Lake Bosworth
The most populous ancestries reported in Lake Bosworth are German (251 | 23.7%), Irish (186 | 17.6%), English (123 | 11.6%), Norwegian (102 | 9.6%), and Mexican (91 | 8.6%), together accounting for 71.1% of all Lake Bosworth residents.
| Ancestry | # Population | % Population |
| American | 27 | 2.5% |
| Czechoslovakian | 11 | 1.0% |
| Danish | 69 | 6.5% |
| Dutch | 32 | 3.0% |
| English | 123 | 11.6% |
| European | 18 | 1.7% |
| French | 86 | 8.1% |
| German | 251 | 23.7% |
| Indian (Asian) | 1 | 0.1% |
| Irish | 186 | 17.6% |
| Italian | 30 | 2.8% |
| Mexican | 91 | 8.6% |
| Norwegian | 102 | 9.6% |
| Polish | 19 | 1.8% |
| Scandinavian | 7 | 0.7% |
| Scotch-Irish | 35 | 3.3% |
| Scottish | 17 | 1.6% |
| Spaniard | 44 | 4.2% |
| Spanish | 17 | 1.6% |
| Sri Lankan | 63 | 5.9% |
| Swedish | 43 | 4.1% |
| Welsh | 6 | 0.6% | View All 22 Rows |
Immigrants in Lake Bosworth
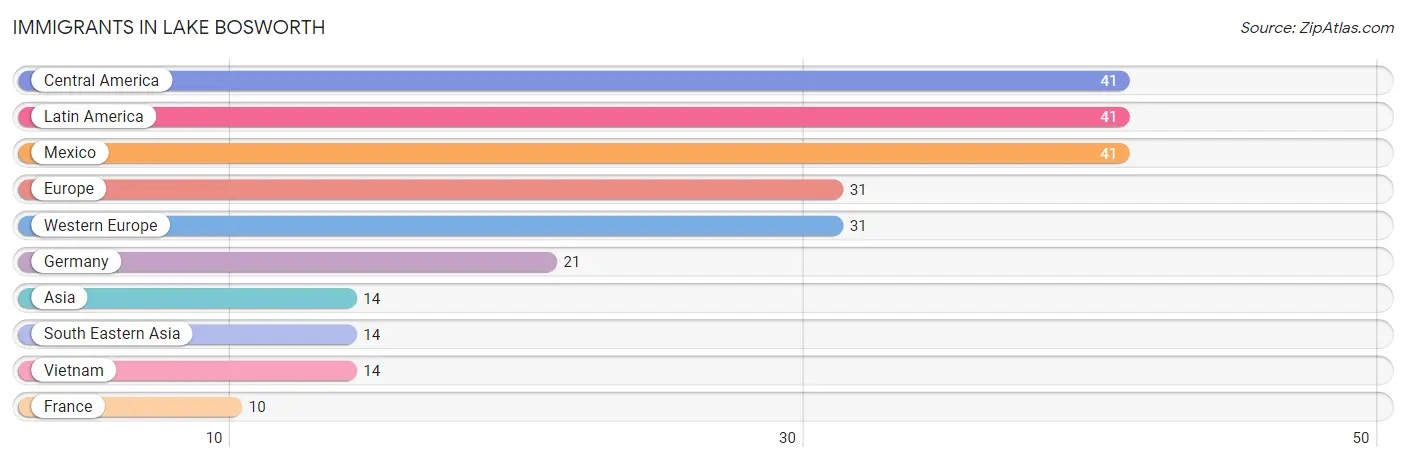
The most numerous immigrant groups reported in Lake Bosworth came from Central America (41 | 3.9%), Latin America (41 | 3.9%), Mexico (41 | 3.9%), Europe (31 | 2.9%), and Western Europe (31 | 2.9%), together accounting for 17.5% of all Lake Bosworth residents.
| Immigration Origin | # Population | % Population |
| Asia | 14 | 1.3% |
| Central America | 41 | 3.9% |
| Europe | 31 | 2.9% |
| France | 10 | 0.9% |
| Germany | 21 | 2.0% |
| Latin America | 41 | 3.9% |
| Mexico | 41 | 3.9% |
| South Eastern Asia | 14 | 1.3% |
| Vietnam | 14 | 1.3% |
| Western Europe | 31 | 2.9% | View All 10 Rows |
Sex and Age in Lake Bosworth
Sex and Age in Lake Bosworth
The most populous age groups in Lake Bosworth are 55 to 59 Years (89 | 16.1%) for men and 55 to 59 Years (78 | 15.4%) for women.
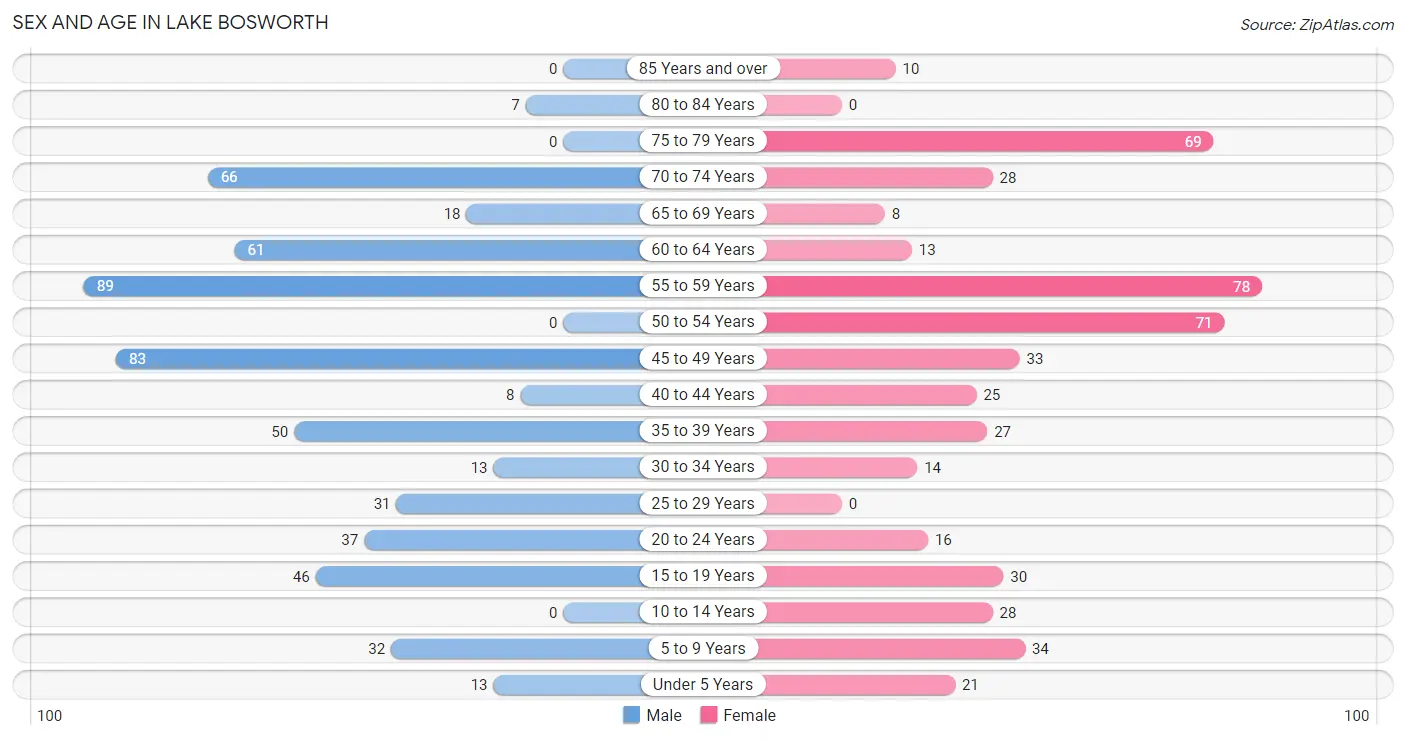
| Age Bracket | Male | Female |
| Under 5 Years | 13 (2.4%) | 21 (4.2%) |
| 5 to 9 Years | 32 (5.8%) | 34 (6.7%) |
| 10 to 14 Years | 0 (0.0%) | 28 (5.5%) |
| 15 to 19 Years | 46 (8.3%) | 30 (5.9%) |
| 20 to 24 Years | 37 (6.7%) | 16 (3.2%) |
| 25 to 29 Years | 31 (5.6%) | 0 (0.0%) |
| 30 to 34 Years | 13 (2.4%) | 14 (2.8%) |
| 35 to 39 Years | 50 (9.0%) | 27 (5.3%) |
| 40 to 44 Years | 8 (1.4%) | 25 (5.0%) |
| 45 to 49 Years | 83 (15.0%) | 33 (6.5%) |
| 50 to 54 Years | 0 (0.0%) | 71 (14.1%) |
| 55 to 59 Years | 89 (16.1%) | 78 (15.4%) |
| 60 to 64 Years | 61 (11.0%) | 13 (2.6%) |
| 65 to 69 Years | 18 (3.3%) | 8 (1.6%) |
| 70 to 74 Years | 66 (11.9%) | 28 (5.5%) |
| 75 to 79 Years | 0 (0.0%) | 69 (13.7%) |
| 80 to 84 Years | 7 (1.3%) | 0 (0.0%) |
| 85 Years and over | 0 (0.0%) | 10 (2.0%) |
| Total | 554 (100.0%) | 505 (100.0%) |
Families and Households in Lake Bosworth
Median Family Size in Lake Bosworth
The median family size in Lake Bosworth is 2.83 persons per family, with single female/mother families (8 | 2.6%) accounting for the largest median family size of 6.88 persons per family. On the other hand, single male/father families (38 | 12.1%) represent the smallest median family size with 2.11 persons per family.
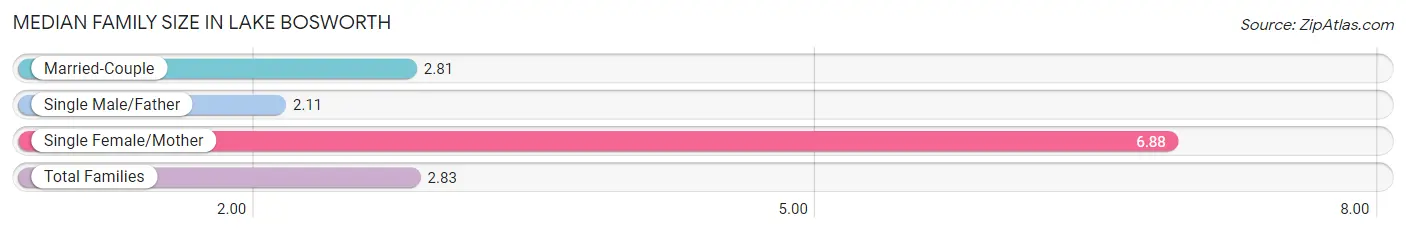
| Family Type | # Families | Family Size |
| Married-Couple | 267 (85.3%) | 2.81 |
| Single Male/Father | 38 (12.1%) | 2.11 |
| Single Female/Mother | 8 (2.6%) | 6.88 |
| Total Families | 313 (100.0%) | 2.83 |
Median Household Size in Lake Bosworth
The median household size in Lake Bosworth is 2.77 persons per household, with single female/mother households (8 | 2.1%) accounting for the largest median household size of 8.63 persons per household. non-family households (70 | 18.3%) represent the smallest median household size with 1.89 persons per household.
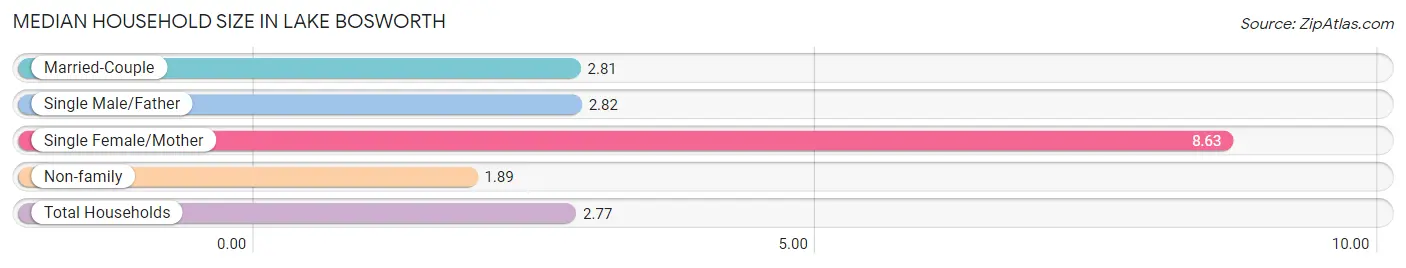
| Household Type | # Households | Household Size |
| Married-Couple | 267 (69.7%) | 2.81 |
| Single Male/Father | 38 (9.9%) | 2.82 |
| Single Female/Mother | 8 (2.1%) | 8.63 |
| Non-family | 70 (18.3%) | 1.89 |
| Total Households | 383 (100.0%) | 2.77 |
Household Size by Marriage Status in Lake Bosworth
Out of a total of 383 households in Lake Bosworth, 313 (81.7%) are family households, while 70 (18.3%) are nonfamily households. The most numerous type of family households are 2-person households, comprising 184, and the most common type of nonfamily households are 1-person households, comprising 45.
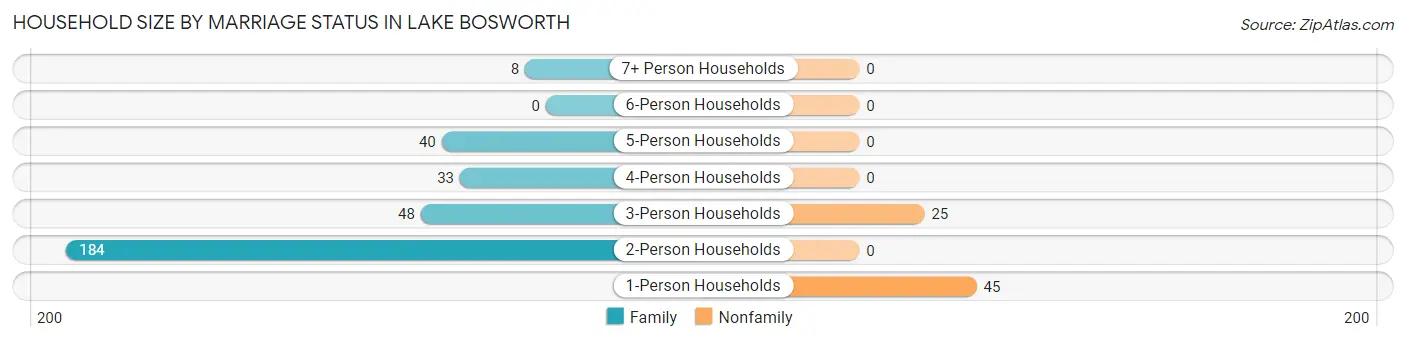
| Household Size | Family Households | Nonfamily Households |
| 1-Person Households | - | 45 (11.7%) |
| 2-Person Households | 184 (48.0%) | 0 (0.0%) |
| 3-Person Households | 48 (12.5%) | 25 (6.5%) |
| 4-Person Households | 33 (8.6%) | 0 (0.0%) |
| 5-Person Households | 40 (10.4%) | 0 (0.0%) |
| 6-Person Households | 0 (0.0%) | 0 (0.0%) |
| 7+ Person Households | 8 (2.1%) | 0 (0.0%) |
| Total | 313 (81.7%) | 70 (18.3%) |
Female Fertility in Lake Bosworth
Fertility by Age in Lake Bosworth
| Age Bracket | Women with Births | Births / 1,000 Women |
| 15 to 19 years | 0 (0.0%) | 0.0 |
| 20 to 34 years | 0 (0.0%) | 0.0 |
| 35 to 50 years | 0 (0.0%) | 0.0 |
| Total | 0 (0.0%) | 0.0 |
Fertility by Age by Marriage Status in Lake Bosworth
| Age Bracket | Married | Unmarried |
| 15 to 19 years | 0 (0.0%) | 0 (0.0%) |
| 20 to 34 years | 0 (0.0%) | 0 (0.0%) |
| 35 to 50 years | 0 (0.0%) | 0 (0.0%) |
| Total | 0 (0.0%) | 0 (0.0%) |
Fertility by Education in Lake Bosworth
| Educational Attainment | Women with Births | Births / 1,000 Women |
| Less than High School | 0 (0.0%) | 0.0 |
| High School Diploma | 0 (0.0%) | 0.0 |
| College or Associate's Degree | 0 (0.0%) | 0.0 |
| Bachelor's Degree | 0 (0.0%) | 0.0 |
| Graduate Degree | 0 (0.0%) | 0.0 |
| Total | 0 (0.0%) | 0.0 |
Fertility by Education by Marriage Status in Lake Bosworth
| Educational Attainment | Married | Unmarried |
| Less than High School | 0 (0.0%) | 0 (0.0%) |
| High School Diploma | 0 (0.0%) | 0 (0.0%) |
| College or Associate's Degree | 0 (0.0%) | 0 (0.0%) |
| Bachelor's Degree | 0 (0.0%) | 0 (0.0%) |
| Graduate Degree | 0 (0.0%) | 0 (0.0%) |
| Total | 0 (0.0%) | 0 (0.0%) |
Employment Characteristics in Lake Bosworth
Employment by Class of Employer in Lake Bosworth
Among the 533 employed individuals in Lake Bosworth, private company employees (302 | 56.7%), self-employed (incorporated) (65 | 12.2%), and self-employed (not incorporated) (63 | 11.8%) make up the most common classes of employment.
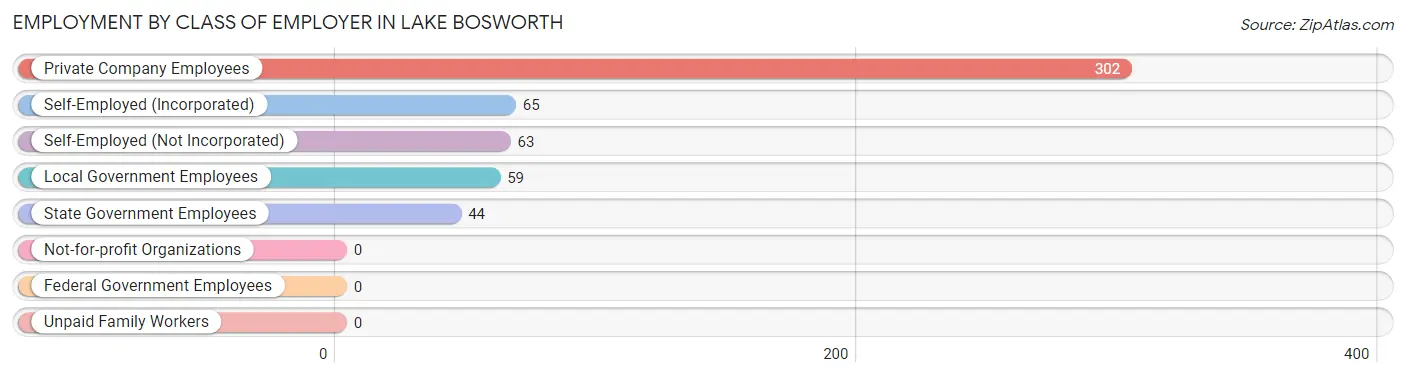
| Employer Class | # Employees | % Employees |
| Private Company Employees | 302 | 56.7% |
| Self-Employed (Incorporated) | 65 | 12.2% |
| Self-Employed (Not Incorporated) | 63 | 11.8% |
| Not-for-profit Organizations | 0 | 0.0% |
| Local Government Employees | 59 | 11.1% |
| State Government Employees | 44 | 8.3% |
| Federal Government Employees | 0 | 0.0% |
| Unpaid Family Workers | 0 | 0.0% |
| Total | 533 | 100.0% |
Employment Status by Age in Lake Bosworth
According to the labor force statistics for Lake Bosworth, out of the total population over 16 years of age (915), 63.8% or 584 individuals are in the labor force, with 5.5% or 32 of them unemployed. The age group with the highest labor force participation rate is 35 to 44 years, with 90.9% or 100 individuals in the labor force. Within the labor force, the 65 to 74 years age range has the highest percentage of unemployed individuals, with 71.4% or 15 of them being unemployed.
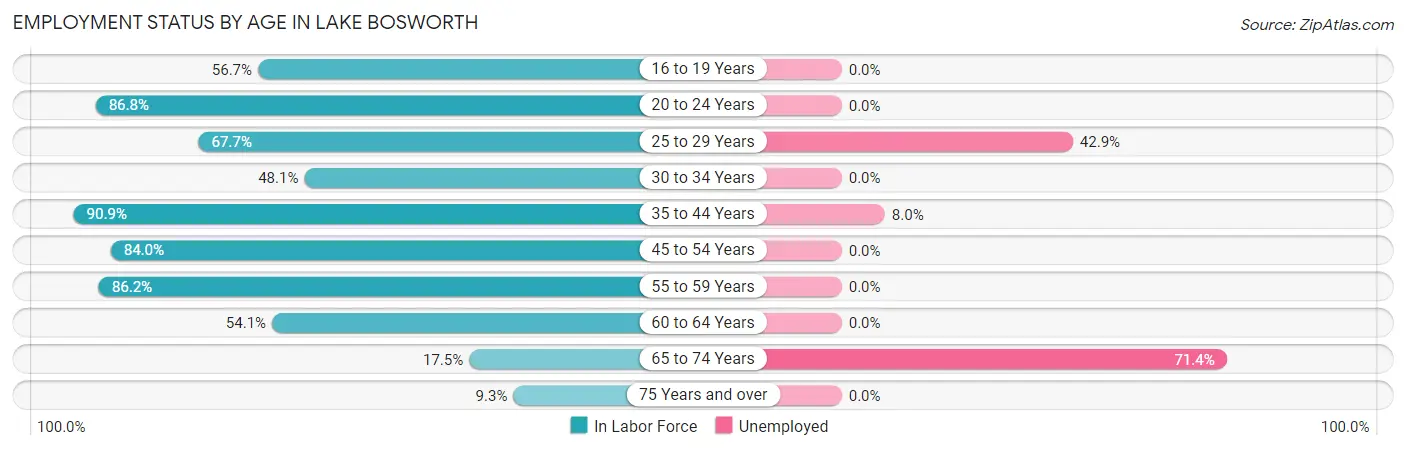
| Age Bracket | In Labor Force | Unemployed |
| 16 to 19 Years | 34 (56.7%) | 0 (0.0%) |
| 20 to 24 Years | 46 (86.8%) | 0 (0.0%) |
| 25 to 29 Years | 21 (67.7%) | 9 (42.9%) |
| 30 to 34 Years | 13 (48.1%) | 0 (0.0%) |
| 35 to 44 Years | 100 (90.9%) | 8 (8.0%) |
| 45 to 54 Years | 157 (84.0%) | 0 (0.0%) |
| 55 to 59 Years | 144 (86.2%) | 0 (0.0%) |
| 60 to 64 Years | 40 (54.1%) | 0 (0.0%) |
| 65 to 74 Years | 21 (17.5%) | 15 (71.4%) |
| 75 Years and over | 8 (9.3%) | 0 (0.0%) |
| Total | 584 (63.8%) | 32 (5.5%) |
Employment Status by Educational Attainment in Lake Bosworth
According to labor force statistics for Lake Bosworth, 79.7% of individuals (475) out of the total population between 25 and 64 years of age (596) are in the labor force, with 3.6% or 17 of them being unemployed. The group with the highest labor force participation rate are those with the educational attainment of less than high school, with 100.0% or 28 individuals in the labor force. Within the labor force, individuals with less than high school education have the highest percentage of unemployment, with 28.6% or 8 of them being unemployed.
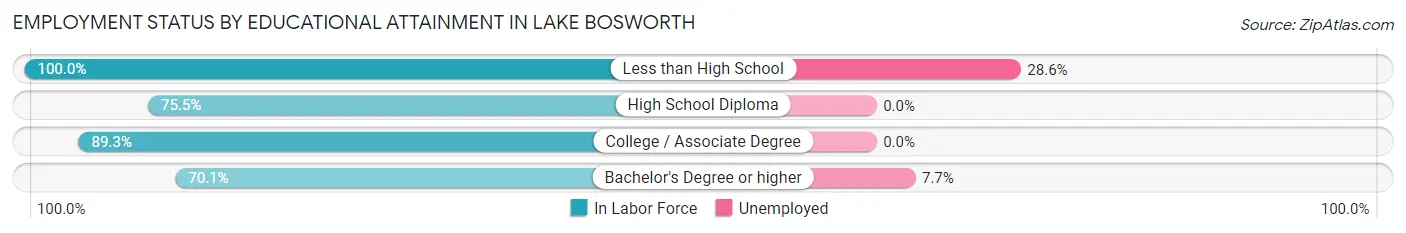
| Educational Attainment | In Labor Force | Unemployed |
| Less than High School | 28 (100.0%) | 8 (28.6%) |
| High School Diploma | 154 (75.5%) | 0 (0.0%) |
| College / Associate Degree | 176 (89.3%) | 0 (0.0%) |
| Bachelor's Degree or higher | 117 (70.1%) | 13 (7.7%) |
| Total | 475 (79.7%) | 21 (3.6%) |
Employment Occupations by Sex in Lake Bosworth
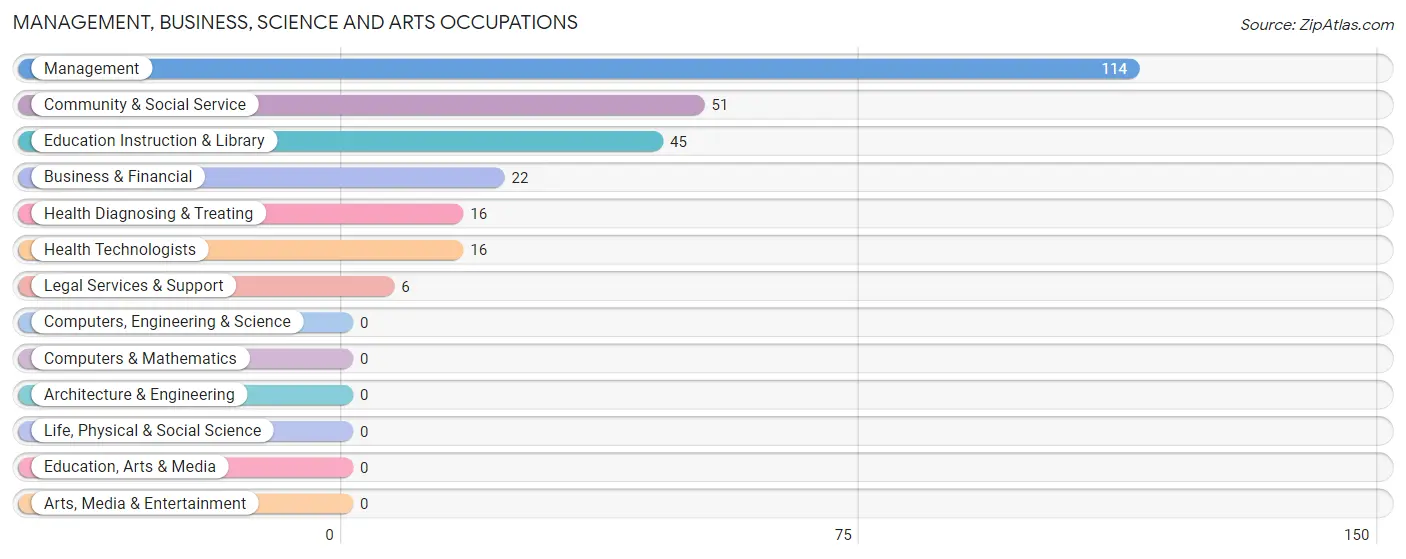
Management, Business, Science and Arts Occupations
The most common Management, Business, Science and Arts occupations in Lake Bosworth are Management (114 | 20.6%), Community & Social Service (51 | 9.2%), Education Instruction & Library (45 | 8.2%), Business & Financial (22 | 4.0%), and Health Diagnosing & Treating (16 | 2.9%).
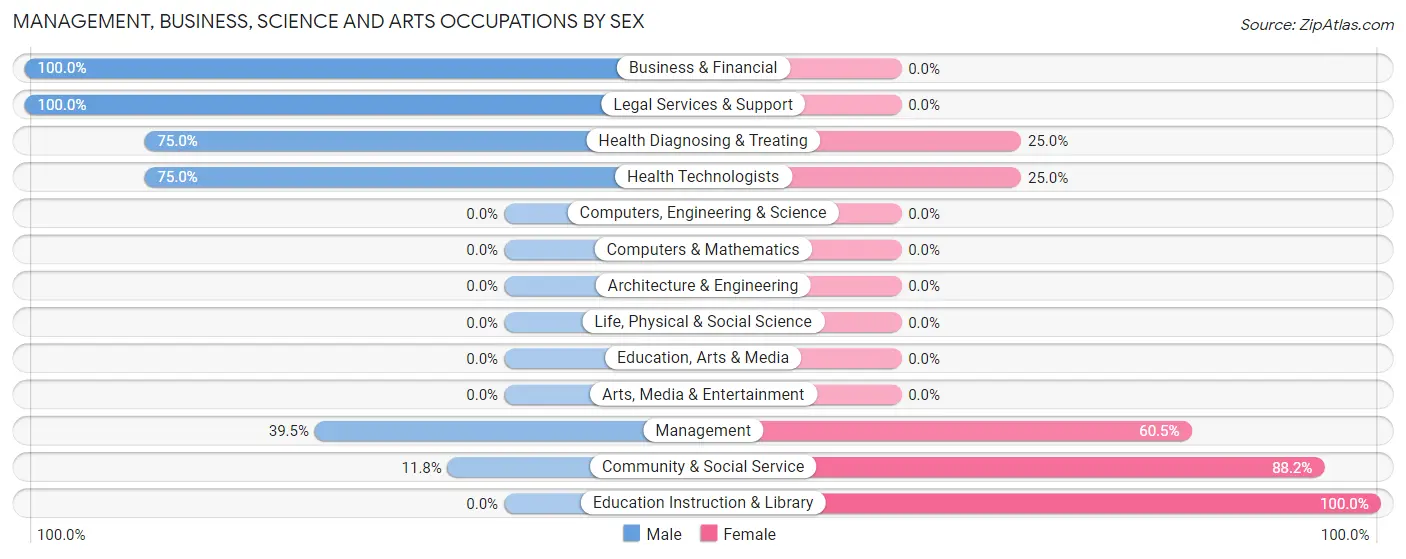
Management, Business, Science and Arts Occupations by Sex
Within the Management, Business, Science and Arts occupations in Lake Bosworth, the most male-oriented occupations are Business & Financial (100.0%), Legal Services & Support (100.0%), and Health Diagnosing & Treating (75.0%), while the most female-oriented occupations are Education Instruction & Library (100.0%), Community & Social Service (88.2%), and Management (60.5%).
| Occupation | Male | Female |
| Management | 45 (39.5%) | 69 (60.5%) |
| Business & Financial | 22 (100.0%) | 0 (0.0%) |
| Computers, Engineering & Science | 0 (0.0%) | 0 (0.0%) |
| Computers & Mathematics | 0 (0.0%) | 0 (0.0%) |
| Architecture & Engineering | 0 (0.0%) | 0 (0.0%) |
| Life, Physical & Social Science | 0 (0.0%) | 0 (0.0%) |
| Community & Social Service | 6 (11.8%) | 45 (88.2%) |
| Education, Arts & Media | 0 (0.0%) | 0 (0.0%) |
| Legal Services & Support | 6 (100.0%) | 0 (0.0%) |
| Education Instruction & Library | 0 (0.0%) | 45 (100.0%) |
| Arts, Media & Entertainment | 0 (0.0%) | 0 (0.0%) |
| Health Diagnosing & Treating | 12 (75.0%) | 4 (25.0%) |
| Health Technologists | 12 (75.0%) | 4 (25.0%) |
| Total (Category) | 85 (41.9%) | 118 (58.1%) |
| Total (Overall) | 323 (58.5%) | 229 (41.5%) |
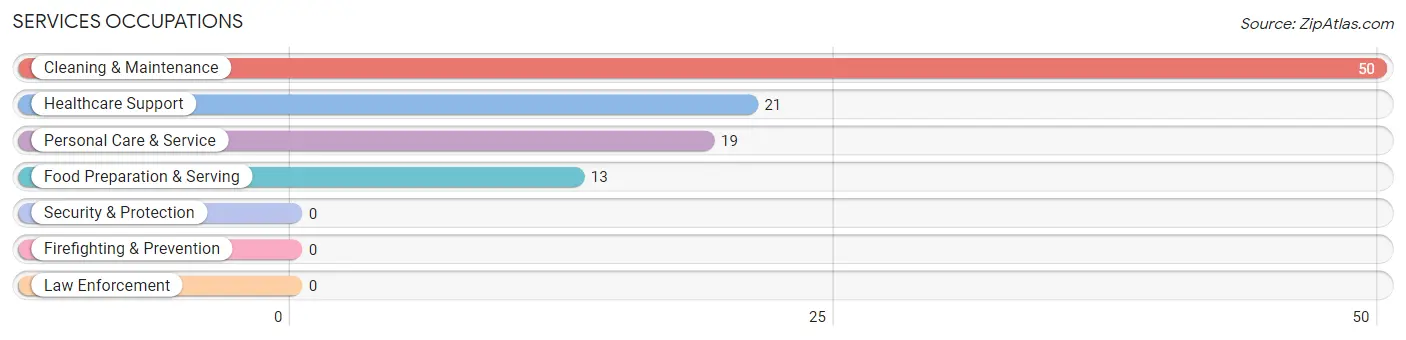
Services Occupations
The most common Services occupations in Lake Bosworth are Cleaning & Maintenance (50 | 9.1%), Healthcare Support (21 | 3.8%), Personal Care & Service (19 | 3.4%), and Food Preparation & Serving (13 | 2.4%).
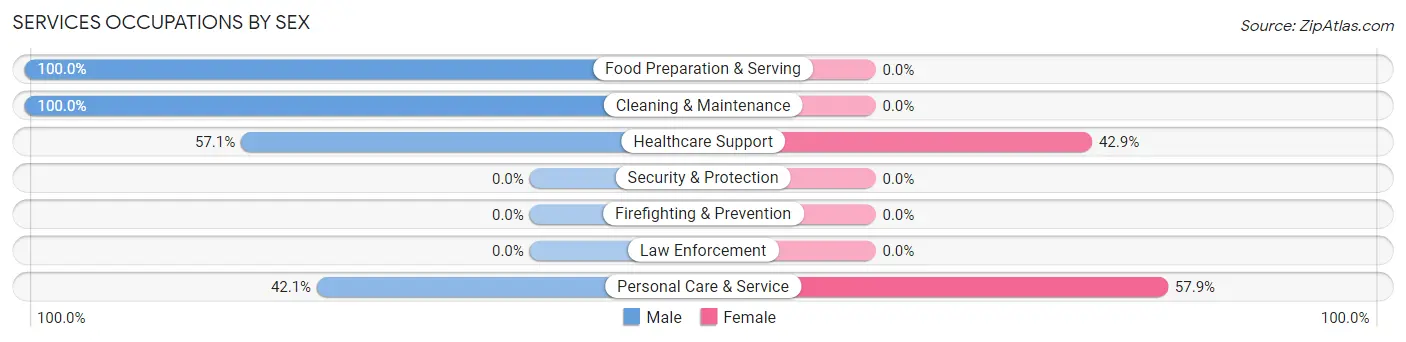
Services Occupations by Sex
Within the Services occupations in Lake Bosworth, the most male-oriented occupations are Food Preparation & Serving (100.0%), Cleaning & Maintenance (100.0%), and Healthcare Support (57.1%), while the most female-oriented occupations are Personal Care & Service (57.9%), and Healthcare Support (42.9%).
| Occupation | Male | Female |
| Healthcare Support | 12 (57.1%) | 9 (42.9%) |
| Security & Protection | 0 (0.0%) | 0 (0.0%) |
| Firefighting & Prevention | 0 (0.0%) | 0 (0.0%) |
| Law Enforcement | 0 (0.0%) | 0 (0.0%) |
| Food Preparation & Serving | 13 (100.0%) | 0 (0.0%) |
| Cleaning & Maintenance | 50 (100.0%) | 0 (0.0%) |
| Personal Care & Service | 8 (42.1%) | 11 (57.9%) |
| Total (Category) | 83 (80.6%) | 20 (19.4%) |
| Total (Overall) | 323 (58.5%) | 229 (41.5%) |
Sales and Office Occupations
The most common Sales and Office occupations in Lake Bosworth are Sales & Related (63 | 11.4%), and Office & Administration (54 | 9.8%).
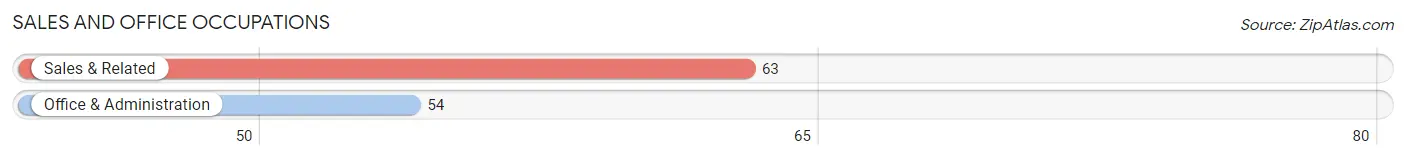
Sales and Office Occupations by Sex
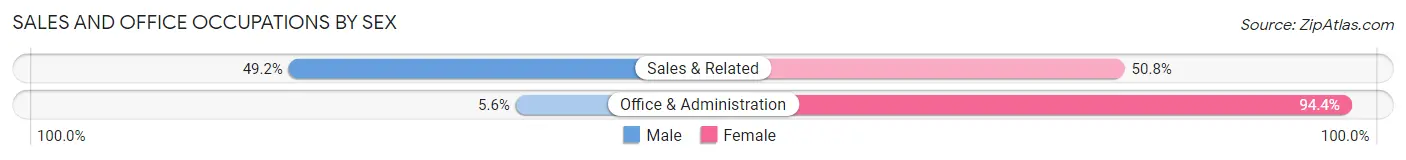
| Occupation | Male | Female |
| Sales & Related | 31 (49.2%) | 32 (50.8%) |
| Office & Administration | 3 (5.6%) | 51 (94.4%) |
| Total (Category) | 34 (29.1%) | 83 (70.9%) |
| Total (Overall) | 323 (58.5%) | 229 (41.5%) |
Natural Resources, Construction and Maintenance Occupations
The most common Natural Resources, Construction and Maintenance occupations in Lake Bosworth are Construction & Extraction (49 | 8.9%), Installation, Maintenance & Repair (32 | 5.8%), and Farming, Fishing & Forestry (9 | 1.6%).
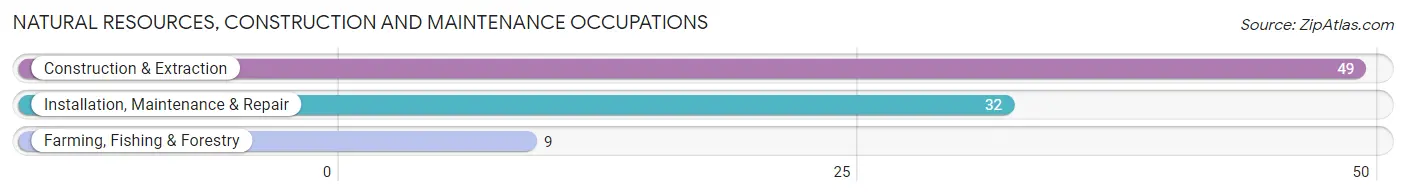
Natural Resources, Construction and Maintenance Occupations by Sex
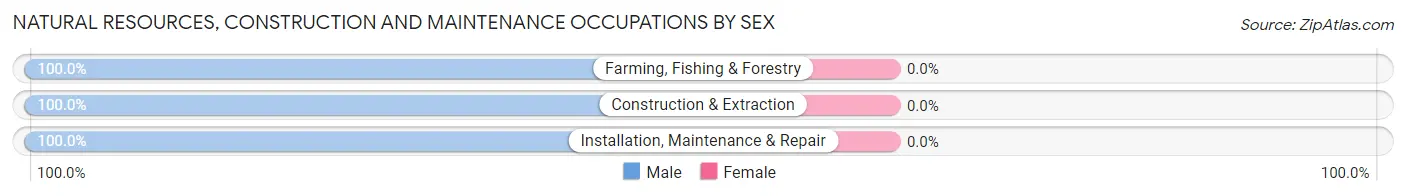
| Occupation | Male | Female |
| Farming, Fishing & Forestry | 9 (100.0%) | 0 (0.0%) |
| Construction & Extraction | 49 (100.0%) | 0 (0.0%) |
| Installation, Maintenance & Repair | 32 (100.0%) | 0 (0.0%) |
| Total (Category) | 90 (100.0%) | 0 (0.0%) |
| Total (Overall) | 323 (58.5%) | 229 (41.5%) |
Production, Transportation and Moving Occupations
The most common Production, Transportation and Moving occupations in Lake Bosworth are Production (21 | 3.8%), Material Moving (10 | 1.8%), and Transportation (8 | 1.5%).
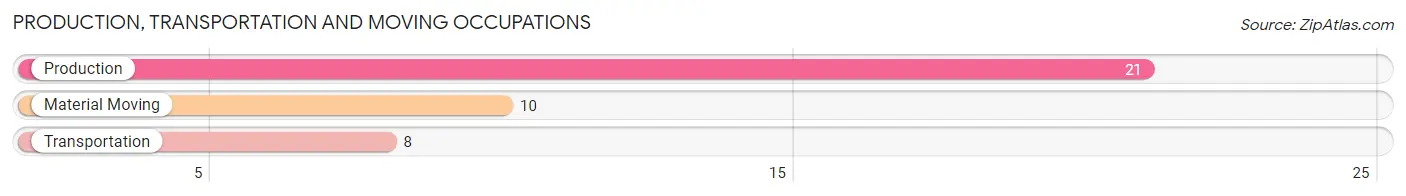
Production, Transportation and Moving Occupations by Sex
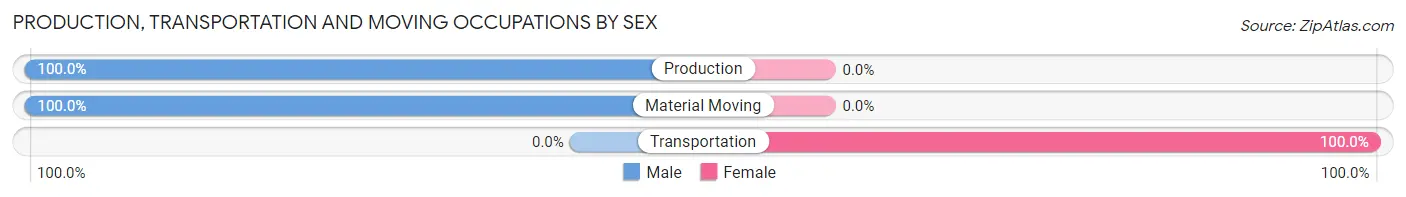
| Occupation | Male | Female |
| Production | 21 (100.0%) | 0 (0.0%) |
| Transportation | 0 (0.0%) | 8 (100.0%) |
| Material Moving | 10 (100.0%) | 0 (0.0%) |
| Total (Category) | 31 (79.5%) | 8 (20.5%) |
| Total (Overall) | 323 (58.5%) | 229 (41.5%) |
Employment Industries by Sex in Lake Bosworth
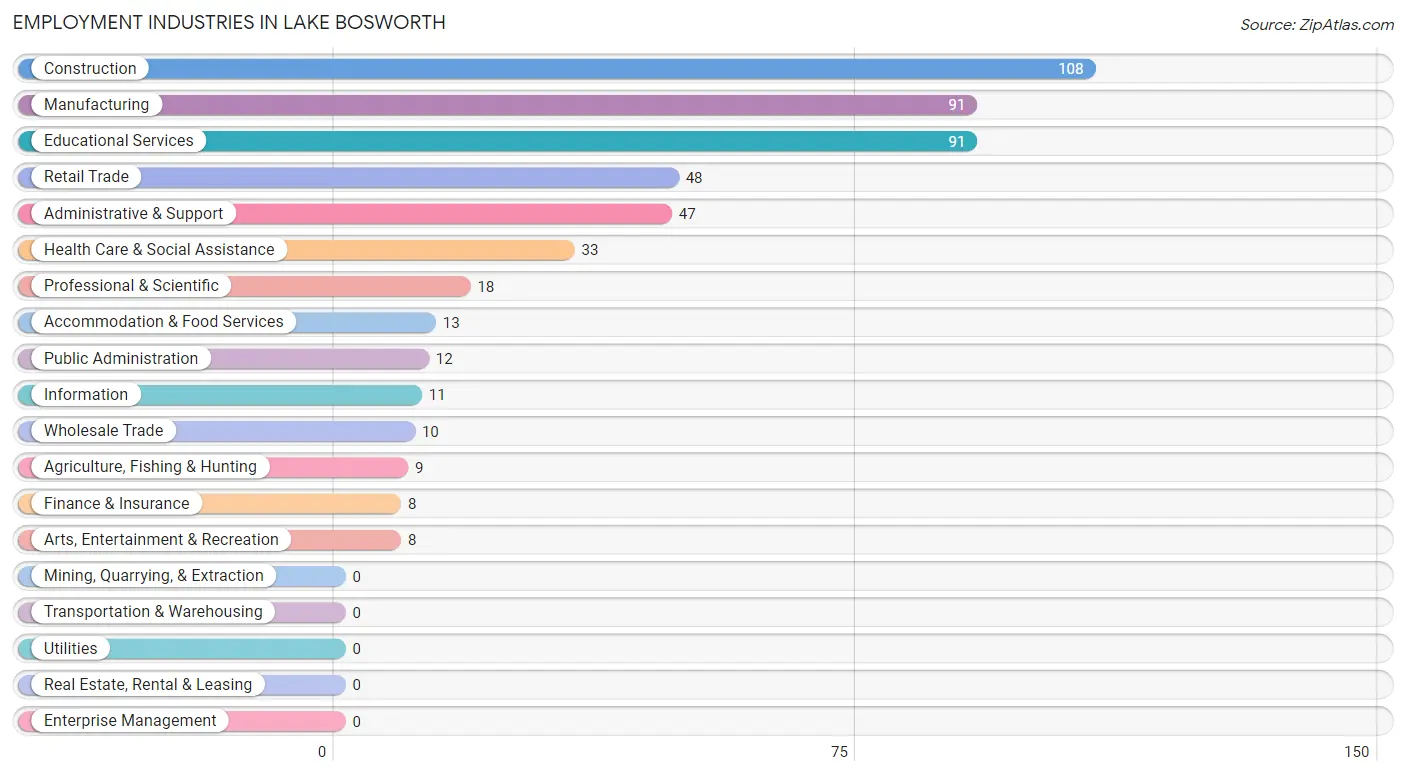
Employment Industries in Lake Bosworth
The major employment industries in Lake Bosworth include Construction (108 | 19.6%), Manufacturing (91 | 16.5%), Educational Services (91 | 16.5%), Retail Trade (48 | 8.7%), and Administrative & Support (47 | 8.5%).
Employment Industries by Sex in Lake Bosworth
The Lake Bosworth industries that see more men than women are Agriculture, Fishing & Hunting (100.0%), Information (100.0%), and Professional & Scientific (100.0%), whereas the industries that tend to have a higher number of women are Wholesale Trade (100.0%), Retail Trade (66.7%), and Educational Services (64.8%).
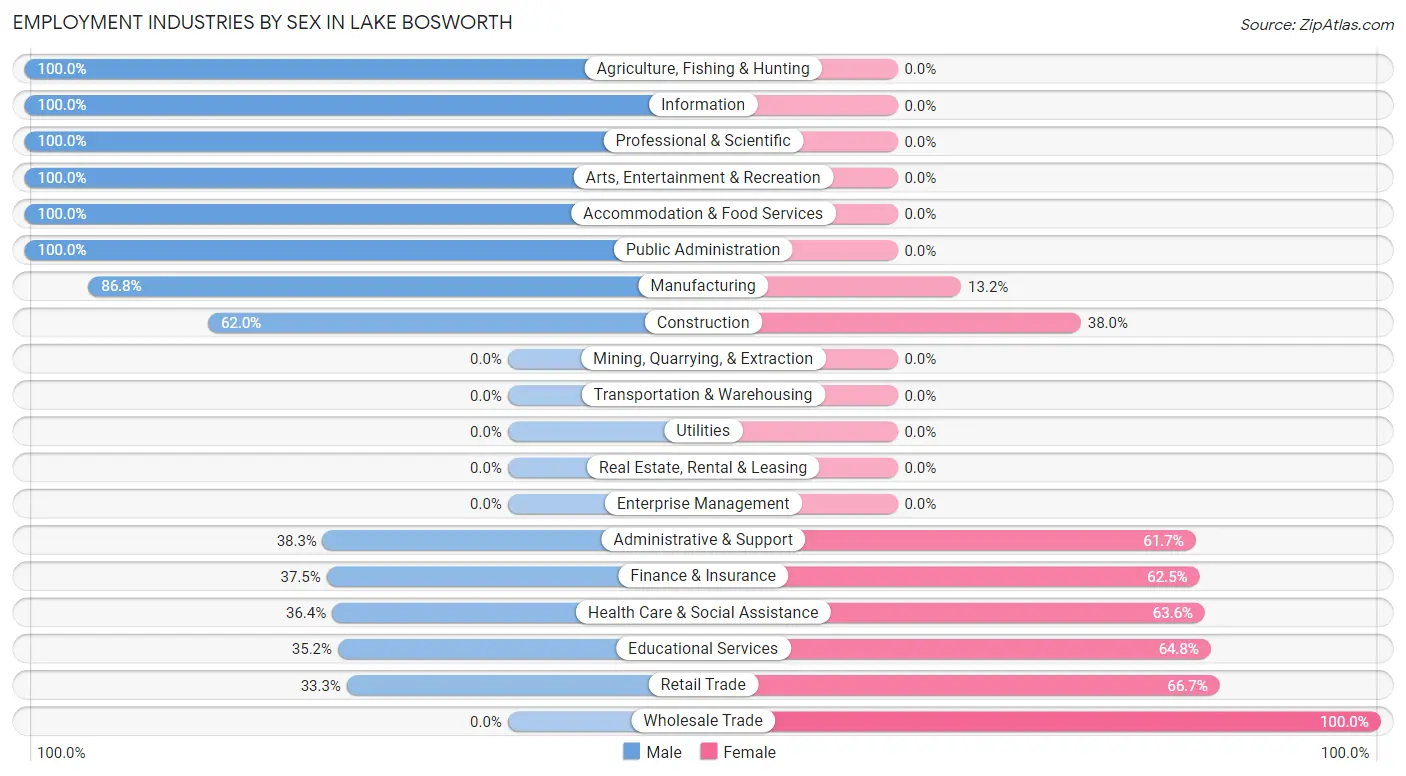
| Industry | Male | Female |
| Agriculture, Fishing & Hunting | 9 (100.0%) | 0 (0.0%) |
| Mining, Quarrying, & Extraction | 0 (0.0%) | 0 (0.0%) |
| Construction | 67 (62.0%) | 41 (38.0%) |
| Manufacturing | 79 (86.8%) | 12 (13.2%) |
| Wholesale Trade | 0 (0.0%) | 10 (100.0%) |
| Retail Trade | 16 (33.3%) | 32 (66.7%) |
| Transportation & Warehousing | 0 (0.0%) | 0 (0.0%) |
| Utilities | 0 (0.0%) | 0 (0.0%) |
| Information | 11 (100.0%) | 0 (0.0%) |
| Finance & Insurance | 3 (37.5%) | 5 (62.5%) |
| Real Estate, Rental & Leasing | 0 (0.0%) | 0 (0.0%) |
| Professional & Scientific | 18 (100.0%) | 0 (0.0%) |
| Enterprise Management | 0 (0.0%) | 0 (0.0%) |
| Administrative & Support | 18 (38.3%) | 29 (61.7%) |
| Educational Services | 32 (35.2%) | 59 (64.8%) |
| Health Care & Social Assistance | 12 (36.4%) | 21 (63.6%) |
| Arts, Entertainment & Recreation | 8 (100.0%) | 0 (0.0%) |
| Accommodation & Food Services | 13 (100.0%) | 0 (0.0%) |
| Public Administration | 12 (100.0%) | 0 (0.0%) |
| Total | 323 (58.5%) | 229 (41.5%) |
Education in Lake Bosworth
School Enrollment in Lake Bosworth
The most common levels of schooling among the 163 students in Lake Bosworth are high school (50 | 30.7%), elementary school (39 | 23.9%), and middle school (28 | 17.2%).
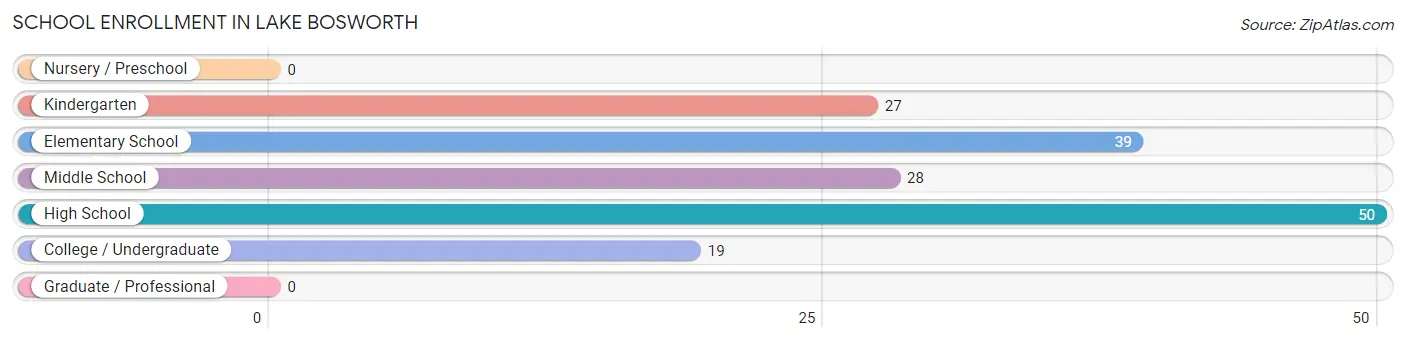
| School Level | # Students | % Students |
| Nursery / Preschool | 0 | 0.0% |
| Kindergarten | 27 | 16.6% |
| Elementary School | 39 | 23.9% |
| Middle School | 28 | 17.2% |
| High School | 50 | 30.7% |
| College / Undergraduate | 19 | 11.7% |
| Graduate / Professional | 0 | 0.0% |
| Total | 163 | 100.0% |
School Enrollment by Age by Funding Source in Lake Bosworth
Out of a total of 163 students who are enrolled in schools in Lake Bosworth, 21 (12.9%) attend a private institution, while the remaining 142 (87.1%) are enrolled in public schools. The age group of 10 to 14 year olds has the highest likelihood of being enrolled in private schools, with 12 (42.9% in the age bracket) enrolled. Conversely, the age group of 5 to 9 year old has the lowest likelihood of being enrolled in a private school, with 66 (100.0% in the age bracket) attending a public institution.
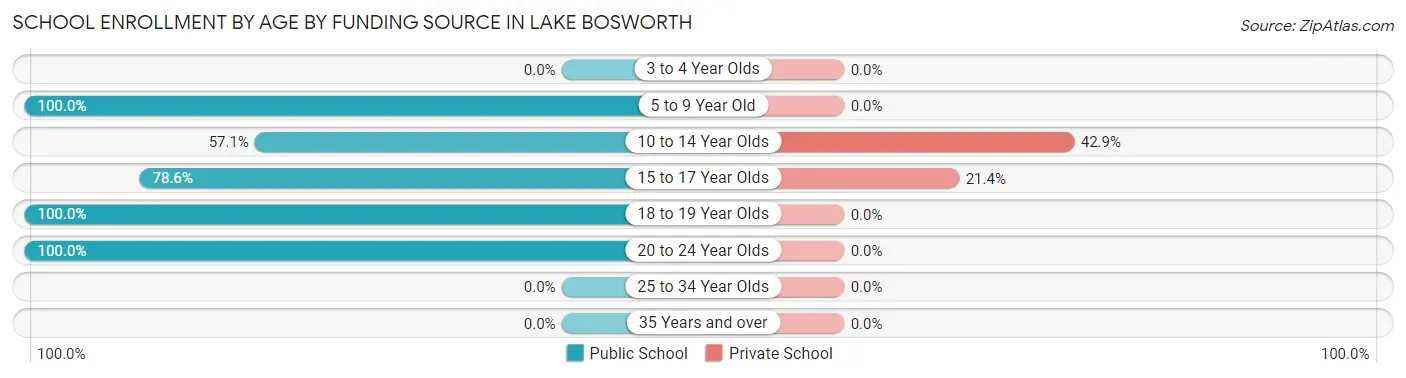
| Age Bracket | Public School | Private School |
| 3 to 4 Year Olds | 0 (0.0%) | 0 (0.0%) |
| 5 to 9 Year Old | 66 (100.0%) | 0 (0.0%) |
| 10 to 14 Year Olds | 16 (57.1%) | 12 (42.9%) |
| 15 to 17 Year Olds | 33 (78.6%) | 9 (21.4%) |
| 18 to 19 Year Olds | 21 (100.0%) | 0 (0.0%) |
| 20 to 24 Year Olds | 6 (100.0%) | 0 (0.0%) |
| 25 to 34 Year Olds | 0 (0.0%) | 0 (0.0%) |
| 35 Years and over | 0 (0.0%) | 0 (0.0%) |
| Total | 142 (87.1%) | 21 (12.9%) |
Educational Attainment by Field of Study in Lake Bosworth
Education (56 | 20.1%), bio, nature & agricultural (43 | 15.5%), communications (37 | 13.3%), business (32 | 11.5%), and literature & languages (29 | 10.4%) are the most common fields of study among 278 individuals in Lake Bosworth who have obtained a bachelor's degree or higher.
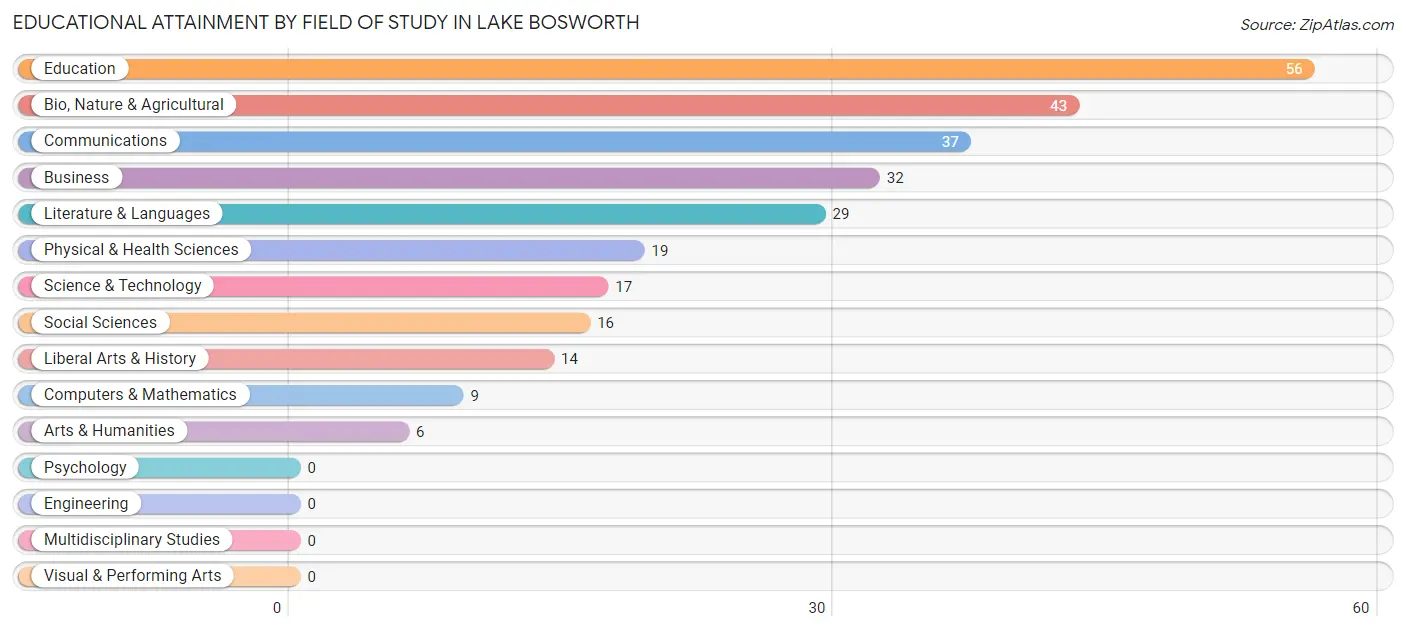
| Field of Study | # Graduates | % Graduates |
| Computers & Mathematics | 9 | 3.2% |
| Bio, Nature & Agricultural | 43 | 15.5% |
| Physical & Health Sciences | 19 | 6.8% |
| Psychology | 0 | 0.0% |
| Social Sciences | 16 | 5.8% |
| Engineering | 0 | 0.0% |
| Multidisciplinary Studies | 0 | 0.0% |
| Science & Technology | 17 | 6.1% |
| Business | 32 | 11.5% |
| Education | 56 | 20.1% |
| Literature & Languages | 29 | 10.4% |
| Liberal Arts & History | 14 | 5.0% |
| Visual & Performing Arts | 0 | 0.0% |
| Communications | 37 | 13.3% |
| Arts & Humanities | 6 | 2.2% |
| Total | 278 | 100.0% |
Transportation & Commute in Lake Bosworth
Vehicle Availability by Sex in Lake Bosworth
The most prevalent vehicle ownership categories in Lake Bosworth are males with 2 vehicles (117, accounting for 37.5%) and females with 2 vehicles (52, making up 52.9%).
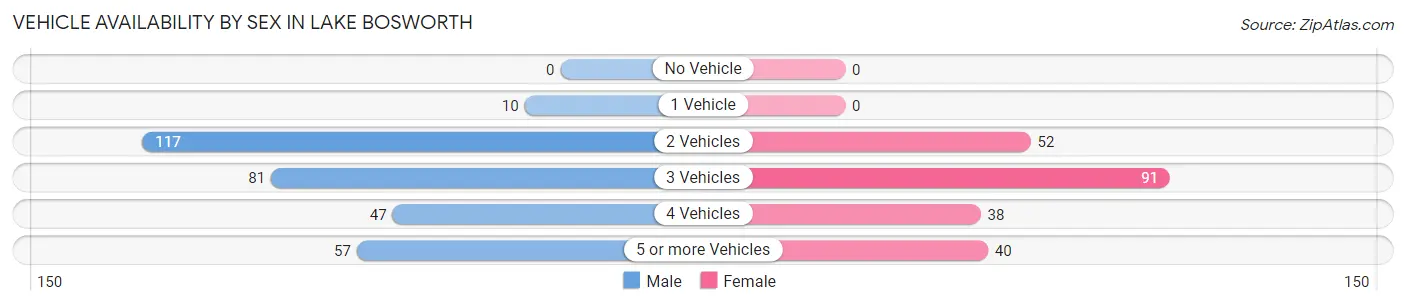
| Vehicles Available | Male | Female |
| No Vehicle | 0 (0.0%) | 0 (0.0%) |
| 1 Vehicle | 10 (3.2%) | 0 (0.0%) |
| 2 Vehicles | 117 (37.5%) | 52 (23.5%) |
| 3 Vehicles | 81 (26.0%) | 91 (41.2%) |
| 4 Vehicles | 47 (15.1%) | 38 (17.2%) |
| 5 or more Vehicles | 57 (18.3%) | 40 (18.1%) |
| Total | 312 (100.0%) | 221 (100.0%) |
Commute Time in Lake Bosworth
The most frequently occuring commute durations in Lake Bosworth are 45 to 59 minutes (130 commuters, 26.2%), 60 to 89 minutes (72 commuters, 14.5%), and 5 to 9 minutes (67 commuters, 13.5%).
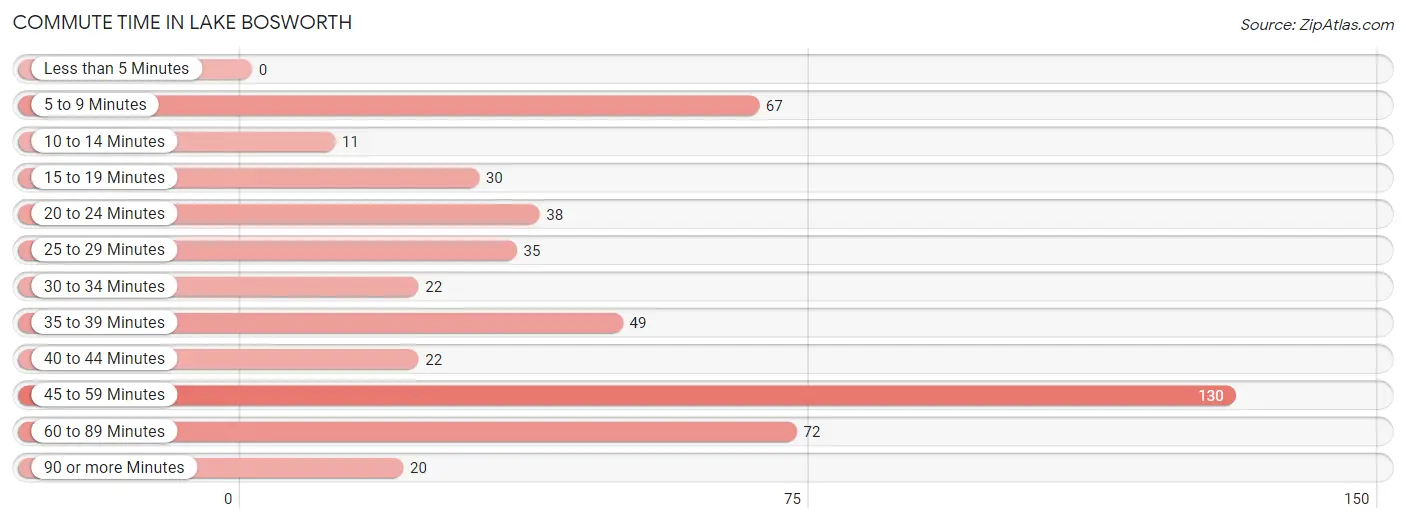
| Commute Time | # Commuters | % Commuters |
| Less than 5 Minutes | 0 | 0.0% |
| 5 to 9 Minutes | 67 | 13.5% |
| 10 to 14 Minutes | 11 | 2.2% |
| 15 to 19 Minutes | 30 | 6.0% |
| 20 to 24 Minutes | 38 | 7.7% |
| 25 to 29 Minutes | 35 | 7.1% |
| 30 to 34 Minutes | 22 | 4.4% |
| 35 to 39 Minutes | 49 | 9.9% |
| 40 to 44 Minutes | 22 | 4.4% |
| 45 to 59 Minutes | 130 | 26.2% |
| 60 to 89 Minutes | 72 | 14.5% |
| 90 or more Minutes | 20 | 4.0% |
Commute Time by Sex in Lake Bosworth
The most common commute times in Lake Bosworth are 45 to 59 minutes (101 commuters, 33.3%) for males and 5 to 9 minutes (67 commuters, 34.7%) for females.
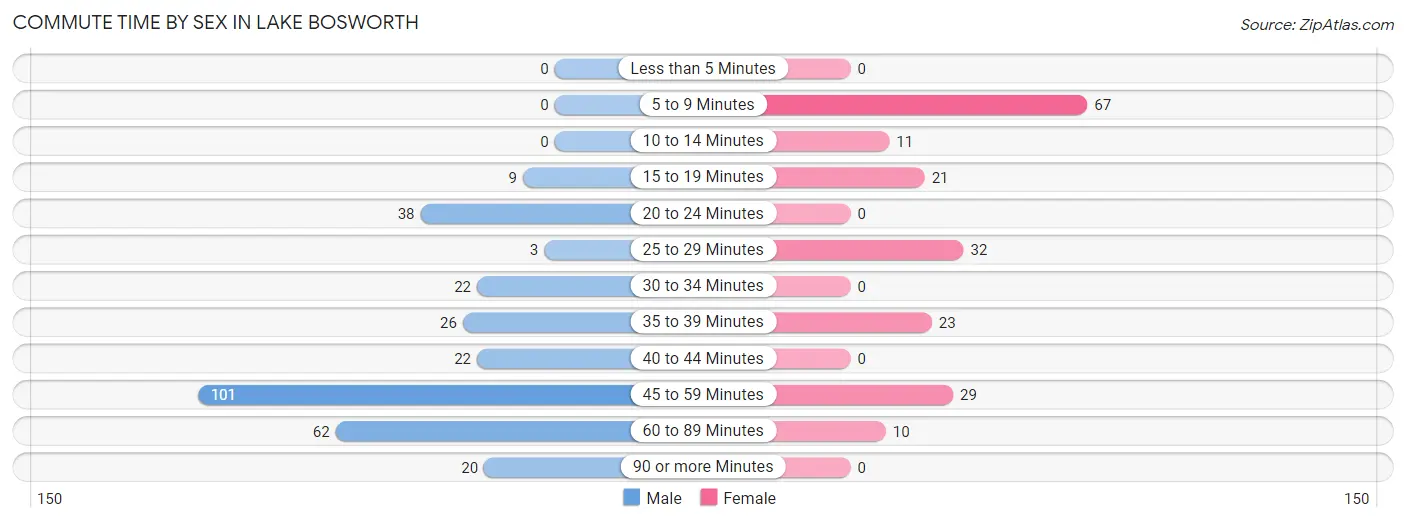
| Commute Time | Male | Female |
| Less than 5 Minutes | 0 (0.0%) | 0 (0.0%) |
| 5 to 9 Minutes | 0 (0.0%) | 67 (34.7%) |
| 10 to 14 Minutes | 0 (0.0%) | 11 (5.7%) |
| 15 to 19 Minutes | 9 (3.0%) | 21 (10.9%) |
| 20 to 24 Minutes | 38 (12.5%) | 0 (0.0%) |
| 25 to 29 Minutes | 3 (1.0%) | 32 (16.6%) |
| 30 to 34 Minutes | 22 (7.3%) | 0 (0.0%) |
| 35 to 39 Minutes | 26 (8.6%) | 23 (11.9%) |
| 40 to 44 Minutes | 22 (7.3%) | 0 (0.0%) |
| 45 to 59 Minutes | 101 (33.3%) | 29 (15.0%) |
| 60 to 89 Minutes | 62 (20.5%) | 10 (5.2%) |
| 90 or more Minutes | 20 (6.6%) | 0 (0.0%) |
Time of Departure to Work by Sex in Lake Bosworth
The most frequent times of departure to work in Lake Bosworth are 6:30 AM to 6:59 AM (59, 19.5%) for males and 7:00 AM to 7:29 AM (55, 28.5%) for females.
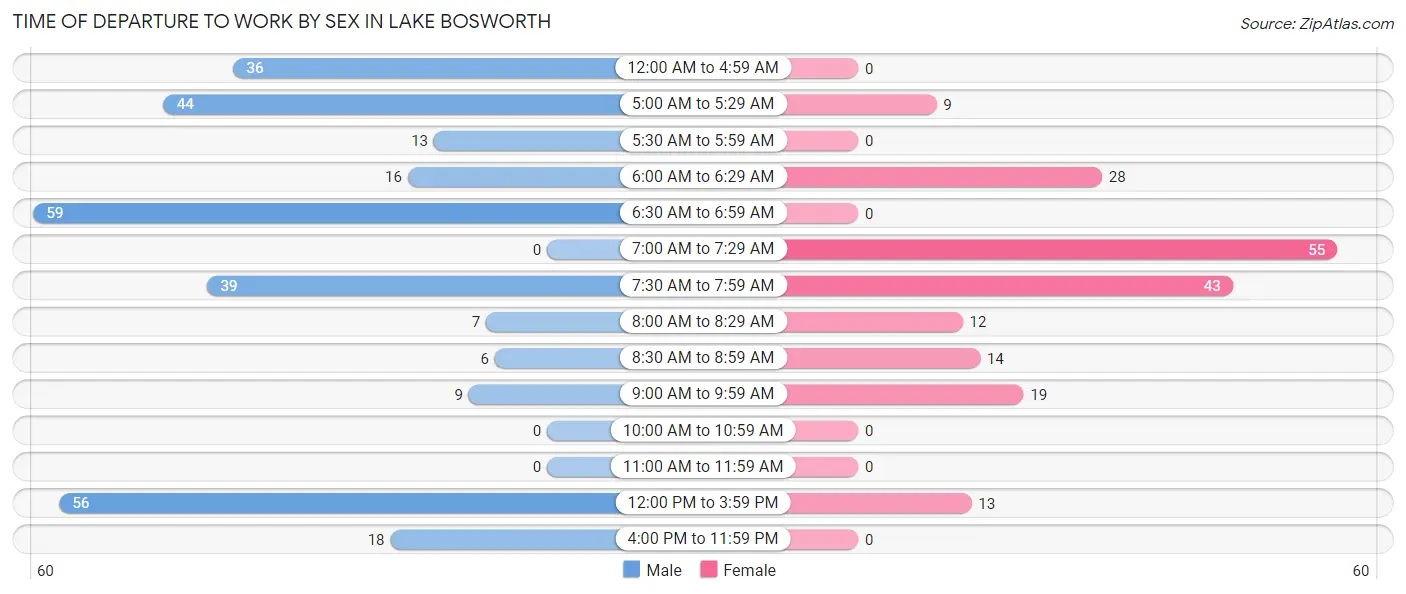
| Time of Departure | Male | Female |
| 12:00 AM to 4:59 AM | 36 (11.9%) | 0 (0.0%) |
| 5:00 AM to 5:29 AM | 44 (14.5%) | 9 (4.7%) |
| 5:30 AM to 5:59 AM | 13 (4.3%) | 0 (0.0%) |
| 6:00 AM to 6:29 AM | 16 (5.3%) | 28 (14.5%) |
| 6:30 AM to 6:59 AM | 59 (19.5%) | 0 (0.0%) |
| 7:00 AM to 7:29 AM | 0 (0.0%) | 55 (28.5%) |
| 7:30 AM to 7:59 AM | 39 (12.9%) | 43 (22.3%) |
| 8:00 AM to 8:29 AM | 7 (2.3%) | 12 (6.2%) |
| 8:30 AM to 8:59 AM | 6 (2.0%) | 14 (7.2%) |
| 9:00 AM to 9:59 AM | 9 (3.0%) | 19 (9.8%) |
| 10:00 AM to 10:59 AM | 0 (0.0%) | 0 (0.0%) |
| 11:00 AM to 11:59 AM | 0 (0.0%) | 0 (0.0%) |
| 12:00 PM to 3:59 PM | 56 (18.5%) | 13 (6.7%) |
| 4:00 PM to 11:59 PM | 18 (5.9%) | 0 (0.0%) |
| Total | 303 (100.0%) | 193 (100.0%) |
Housing Occupancy in Lake Bosworth
Occupancy by Ownership in Lake Bosworth
Of the total 383 dwellings in Lake Bosworth, owner-occupied units account for 354 (92.4%), while renter-occupied units make up 29 (7.6%).
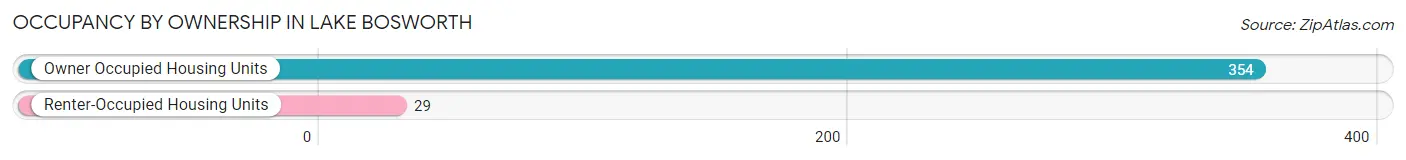
| Occupancy | # Housing Units | % Housing Units |
| Owner Occupied Housing Units | 354 | 92.4% |
| Renter-Occupied Housing Units | 29 | 7.6% |
| Total Occupied Housing Units | 383 | 100.0% |
Occupancy by Household Size in Lake Bosworth
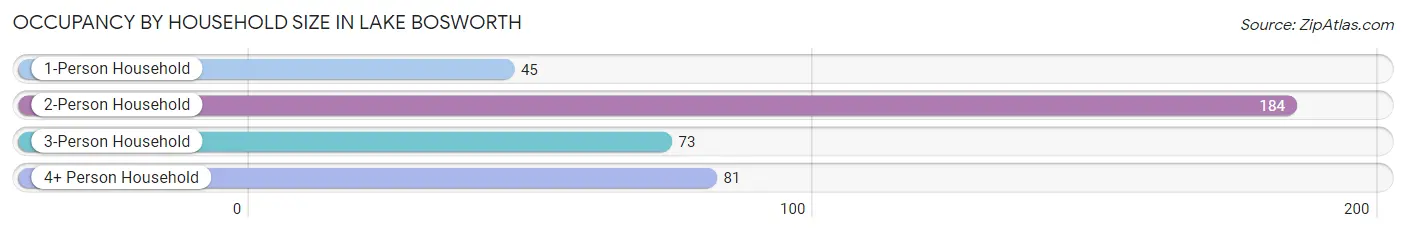
| Household Size | # Housing Units | % Housing Units |
| 1-Person Household | 45 | 11.7% |
| 2-Person Household | 184 | 48.0% |
| 3-Person Household | 73 | 19.1% |
| 4+ Person Household | 81 | 21.1% |
| Total Housing Units | 383 | 100.0% |
Occupancy by Ownership by Household Size in Lake Bosworth
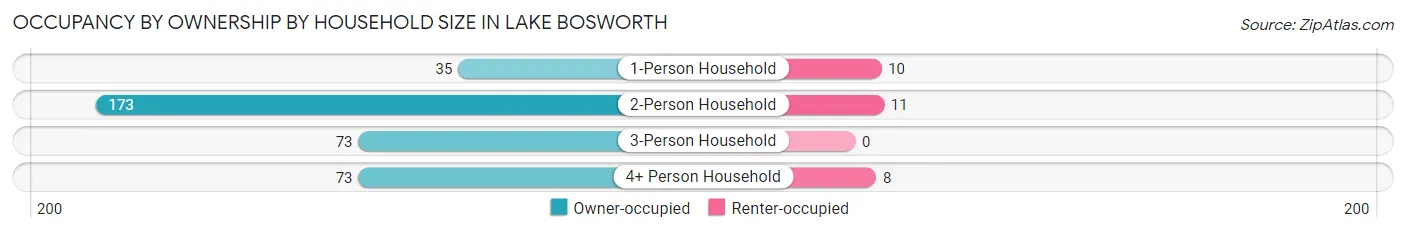
| Household Size | Owner-occupied | Renter-occupied |
| 1-Person Household | 35 (77.8%) | 10 (22.2%) |
| 2-Person Household | 173 (94.0%) | 11 (6.0%) |
| 3-Person Household | 73 (100.0%) | 0 (0.0%) |
| 4+ Person Household | 73 (90.1%) | 8 (9.9%) |
| Total Housing Units | 354 (92.4%) | 29 (7.6%) |
Occupancy by Educational Attainment in Lake Bosworth

| Household Size | Owner-occupied | Renter-occupied |
| Less than High School | 33 (100.0%) | 0 (0.0%) |
| High School Diploma | 66 (100.0%) | 0 (0.0%) |
| College/Associate Degree | 136 (93.1%) | 10 (6.9%) |
| Bachelor's Degree or higher | 119 (86.2%) | 19 (13.8%) |
Occupancy by Age of Householder in Lake Bosworth
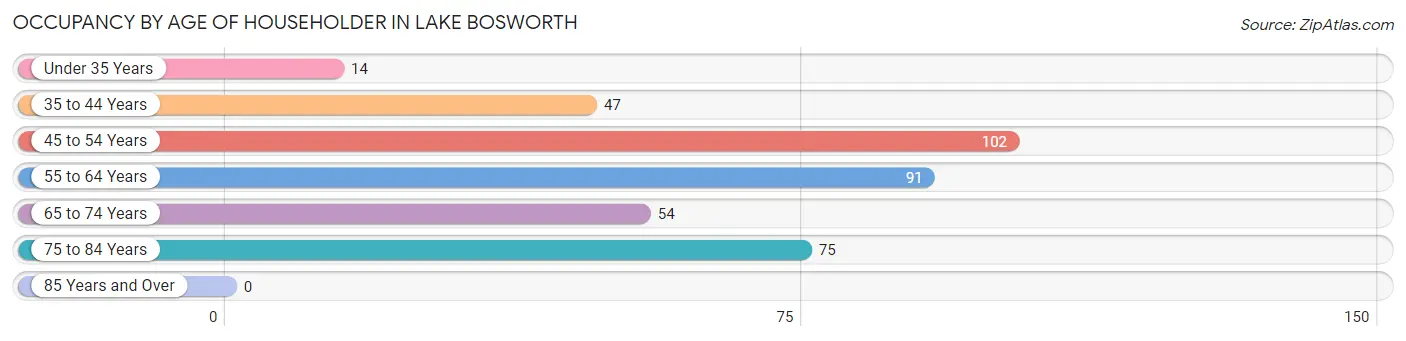
| Age Bracket | # Households | % Households |
| Under 35 Years | 14 | 3.7% |
| 35 to 44 Years | 47 | 12.3% |
| 45 to 54 Years | 102 | 26.6% |
| 55 to 64 Years | 91 | 23.8% |
| 65 to 74 Years | 54 | 14.1% |
| 75 to 84 Years | 75 | 19.6% |
| 85 Years and Over | 0 | 0.0% |
| Total | 383 | 100.0% |
Housing Finances in Lake Bosworth
Median Income by Occupancy in Lake Bosworth
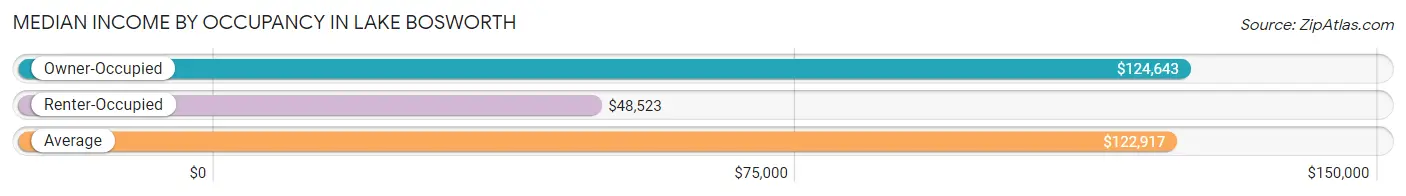
| Occupancy Type | # Households | Median Income |
| Owner-Occupied | 354 (92.4%) | $124,643 |
| Renter-Occupied | 29 (7.6%) | $48,523 |
| Average | 383 (100.0%) | $122,917 |
Occupancy by Householder Income Bracket in Lake Bosworth
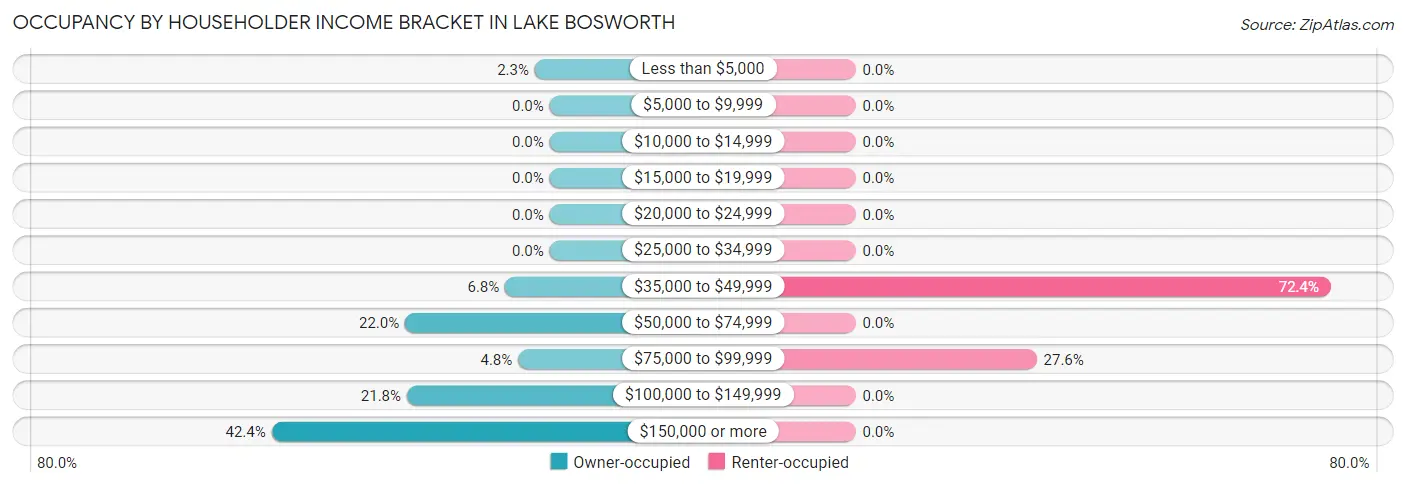
| Income Bracket | Owner-occupied | Renter-occupied |
| Less than $5,000 | 8 (2.3%) | 0 (0.0%) |
| $5,000 to $9,999 | 0 (0.0%) | 0 (0.0%) |
| $10,000 to $14,999 | 0 (0.0%) | 0 (0.0%) |
| $15,000 to $19,999 | 0 (0.0%) | 0 (0.0%) |
| $20,000 to $24,999 | 0 (0.0%) | 0 (0.0%) |
| $25,000 to $34,999 | 0 (0.0%) | 0 (0.0%) |
| $35,000 to $49,999 | 24 (6.8%) | 21 (72.4%) |
| $50,000 to $74,999 | 78 (22.0%) | 0 (0.0%) |
| $75,000 to $99,999 | 17 (4.8%) | 8 (27.6%) |
| $100,000 to $149,999 | 77 (21.7%) | 0 (0.0%) |
| $150,000 or more | 150 (42.4%) | 0 (0.0%) |
| Total | 354 (100.0%) | 29 (100.0%) |
Monthly Housing Cost Tiers in Lake Bosworth
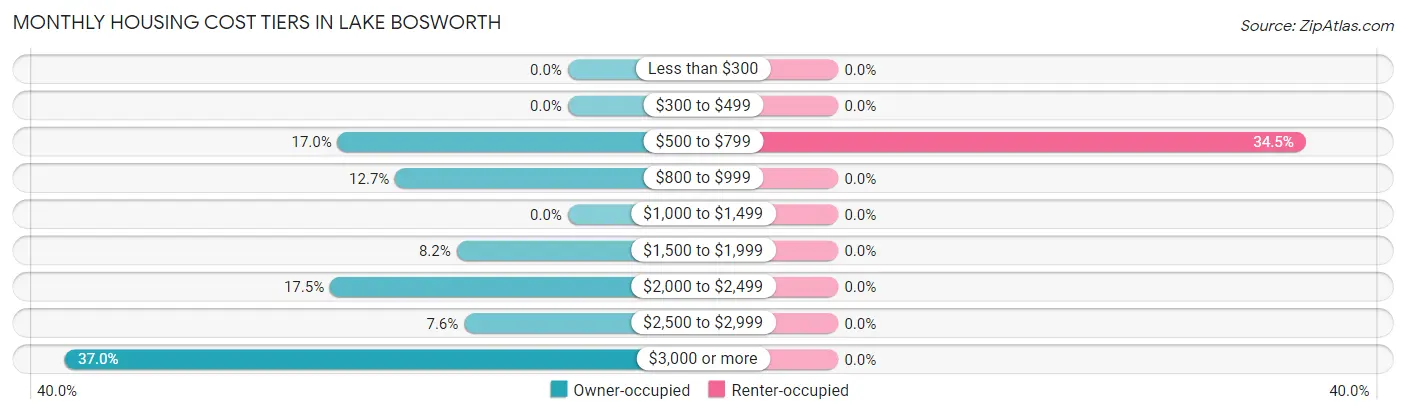
| Monthly Cost | Owner-occupied | Renter-occupied |
| Less than $300 | 0 (0.0%) | 0 (0.0%) |
| $300 to $499 | 0 (0.0%) | 0 (0.0%) |
| $500 to $799 | 60 (17.0%) | 10 (34.5%) |
| $800 to $999 | 45 (12.7%) | 0 (0.0%) |
| $1,000 to $1,499 | 0 (0.0%) | 0 (0.0%) |
| $1,500 to $1,999 | 29 (8.2%) | 0 (0.0%) |
| $2,000 to $2,499 | 62 (17.5%) | 0 (0.0%) |
| $2,500 to $2,999 | 27 (7.6%) | 0 (0.0%) |
| $3,000 or more | 131 (37.0%) | 0 (0.0%) |
| Total | 354 (100.0%) | 29 (100.0%) |
Physical Housing Characteristics in Lake Bosworth
Housing Structures in Lake Bosworth
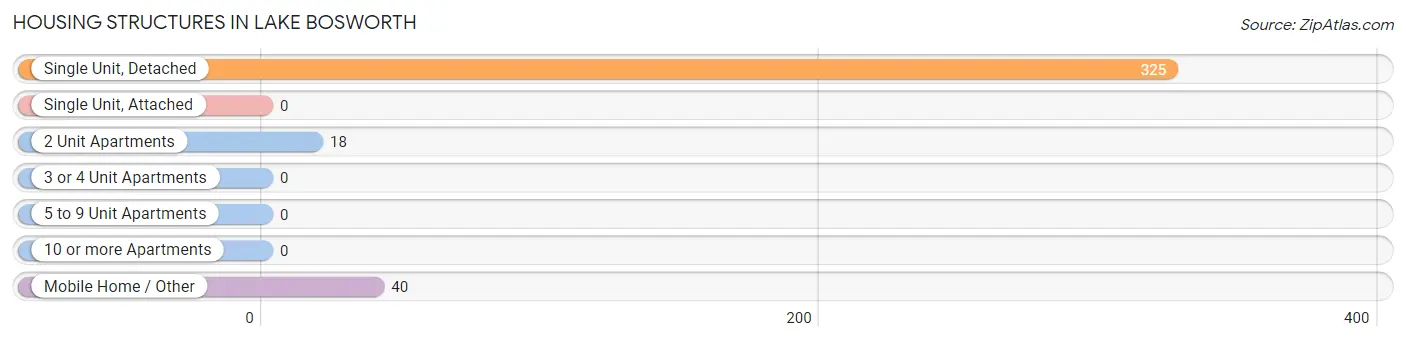
| Structure Type | # Housing Units | % Housing Units |
| Single Unit, Detached | 325 | 84.9% |
| Single Unit, Attached | 0 | 0.0% |
| 2 Unit Apartments | 18 | 4.7% |
| 3 or 4 Unit Apartments | 0 | 0.0% |
| 5 to 9 Unit Apartments | 0 | 0.0% |
| 10 or more Apartments | 0 | 0.0% |
| Mobile Home / Other | 40 | 10.4% |
| Total | 383 | 100.0% |
Housing Structures by Occupancy in Lake Bosworth
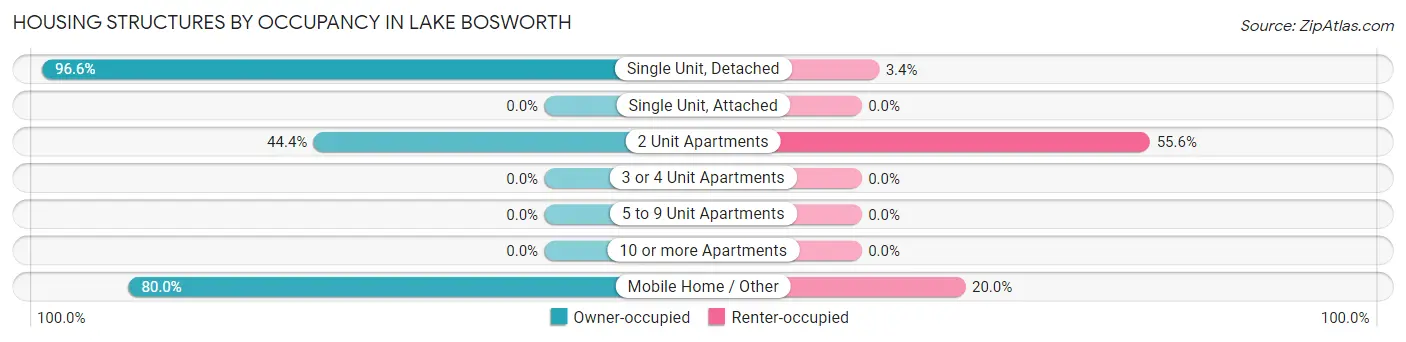
| Structure Type | Owner-occupied | Renter-occupied |
| Single Unit, Detached | 314 (96.6%) | 11 (3.4%) |
| Single Unit, Attached | 0 (0.0%) | 0 (0.0%) |
| 2 Unit Apartments | 8 (44.4%) | 10 (55.6%) |
| 3 or 4 Unit Apartments | 0 (0.0%) | 0 (0.0%) |
| 5 to 9 Unit Apartments | 0 (0.0%) | 0 (0.0%) |
| 10 or more Apartments | 0 (0.0%) | 0 (0.0%) |
| Mobile Home / Other | 32 (80.0%) | 8 (20.0%) |
| Total | 354 (92.4%) | 29 (7.6%) |
Housing Structures by Number of Rooms in Lake Bosworth
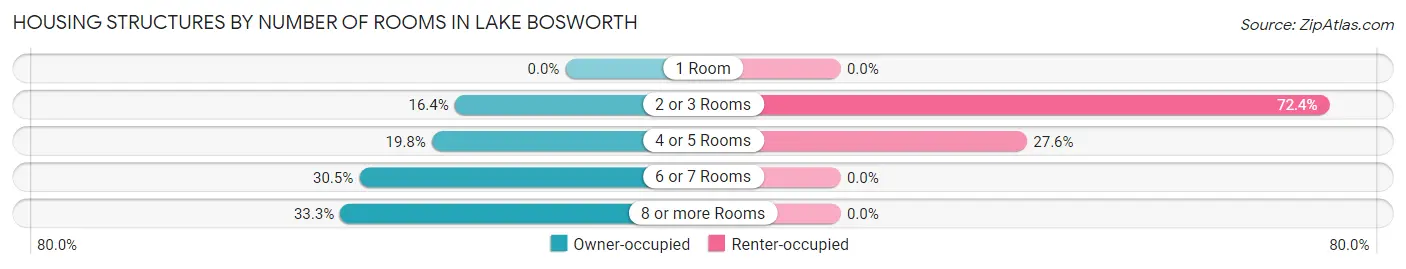
| Number of Rooms | Owner-occupied | Renter-occupied |
| 1 Room | 0 (0.0%) | 0 (0.0%) |
| 2 or 3 Rooms | 58 (16.4%) | 21 (72.4%) |
| 4 or 5 Rooms | 70 (19.8%) | 8 (27.6%) |
| 6 or 7 Rooms | 108 (30.5%) | 0 (0.0%) |
| 8 or more Rooms | 118 (33.3%) | 0 (0.0%) |
| Total | 354 (100.0%) | 29 (100.0%) |
Housing Structure by Heating Type in Lake Bosworth
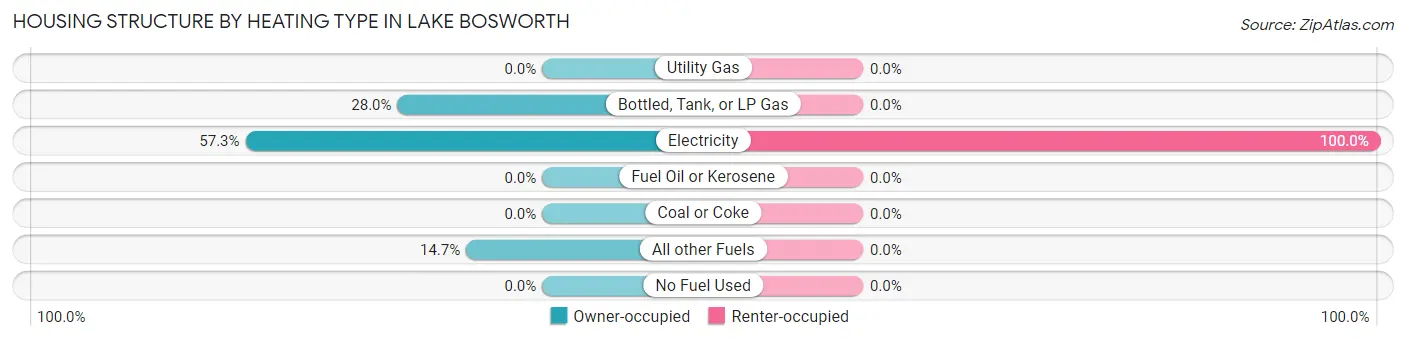
| Heating Type | Owner-occupied | Renter-occupied |
| Utility Gas | 0 (0.0%) | 0 (0.0%) |
| Bottled, Tank, or LP Gas | 99 (28.0%) | 0 (0.0%) |
| Electricity | 203 (57.3%) | 29 (100.0%) |
| Fuel Oil or Kerosene | 0 (0.0%) | 0 (0.0%) |
| Coal or Coke | 0 (0.0%) | 0 (0.0%) |
| All other Fuels | 52 (14.7%) | 0 (0.0%) |
| No Fuel Used | 0 (0.0%) | 0 (0.0%) |
| Total | 354 (100.0%) | 29 (100.0%) |
Household Vehicle Usage in Lake Bosworth
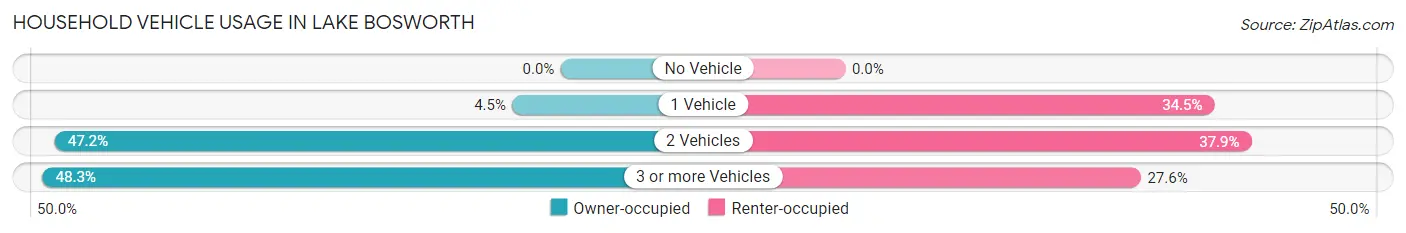
| Vehicles per Household | Owner-occupied | Renter-occupied |
| No Vehicle | 0 (0.0%) | 0 (0.0%) |
| 1 Vehicle | 16 (4.5%) | 10 (34.5%) |
| 2 Vehicles | 167 (47.2%) | 11 (37.9%) |
| 3 or more Vehicles | 171 (48.3%) | 8 (27.6%) |
| Total | 354 (100.0%) | 29 (100.0%) |
Real Estate & Mortgages in Lake Bosworth
Real Estate and Mortgage Overview in Lake Bosworth
| Characteristic | Without Mortgage | With Mortgage |
| Housing Units | 119 | 235 |
| Median Property Value | $494,000 | $733,200 |
| Median Household Income | $66,042 | $126 |
| Monthly Housing Costs | $798 | $131 |
| Real Estate Taxes | $5,225 | $0 |
Property Value by Mortgage Status in Lake Bosworth
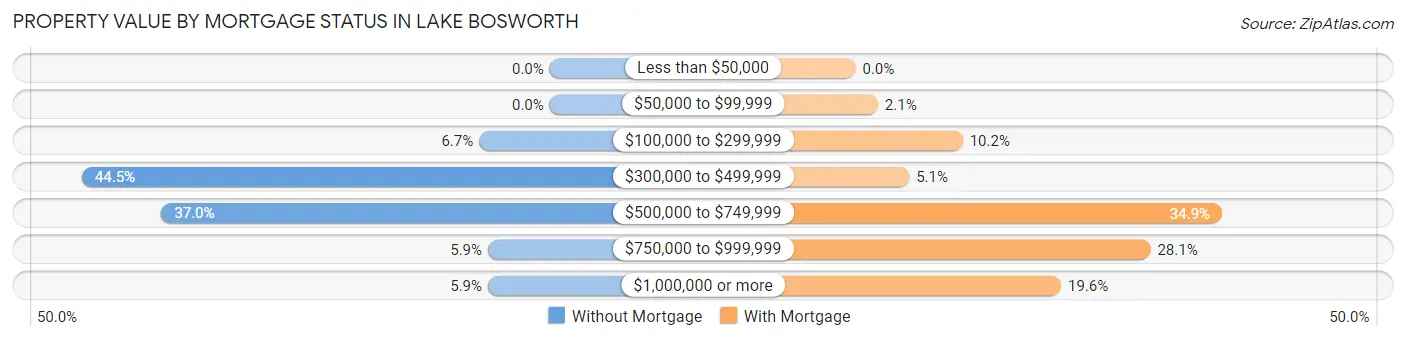
| Property Value | Without Mortgage | With Mortgage |
| Less than $50,000 | 0 (0.0%) | 0 (0.0%) |
| $50,000 to $99,999 | 0 (0.0%) | 5 (2.1%) |
| $100,000 to $299,999 | 8 (6.7%) | 24 (10.2%) |
| $300,000 to $499,999 | 53 (44.5%) | 12 (5.1%) |
| $500,000 to $749,999 | 44 (37.0%) | 82 (34.9%) |
| $750,000 to $999,999 | 7 (5.9%) | 66 (28.1%) |
| $1,000,000 or more | 7 (5.9%) | 46 (19.6%) |
| Total | 119 (100.0%) | 235 (100.0%) |
Household Income by Mortgage Status in Lake Bosworth
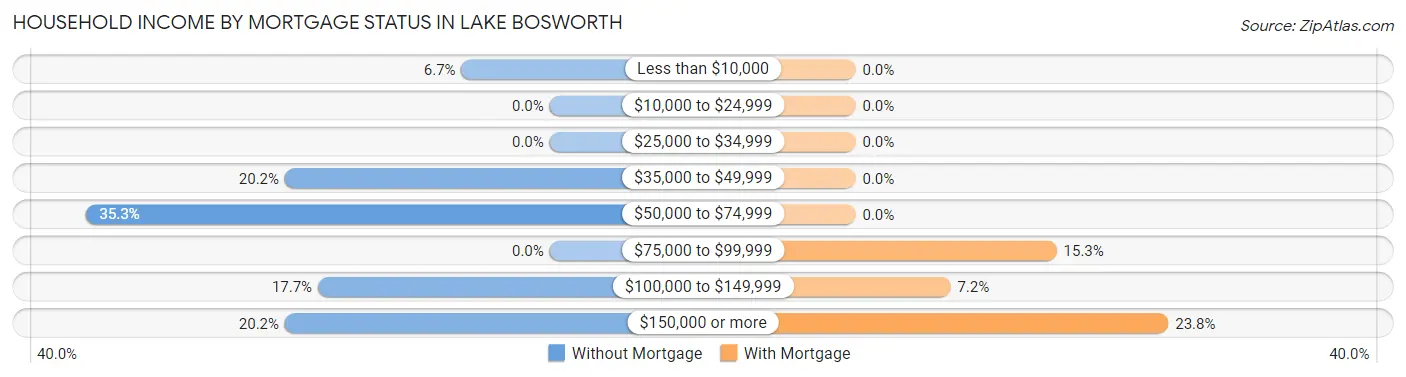
| Household Income | Without Mortgage | With Mortgage |
| Less than $10,000 | 8 (6.7%) | 0 (0.0%) |
| $10,000 to $24,999 | 0 (0.0%) | 0 (0.0%) |
| $25,000 to $34,999 | 0 (0.0%) | 0 (0.0%) |
| $35,000 to $49,999 | 24 (20.2%) | 0 (0.0%) |
| $50,000 to $74,999 | 42 (35.3%) | 0 (0.0%) |
| $75,000 to $99,999 | 0 (0.0%) | 36 (15.3%) |
| $100,000 to $149,999 | 21 (17.6%) | 17 (7.2%) |
| $150,000 or more | 24 (20.2%) | 56 (23.8%) |
| Total | 119 (100.0%) | 235 (100.0%) |
Property Value to Household Income Ratio in Lake Bosworth
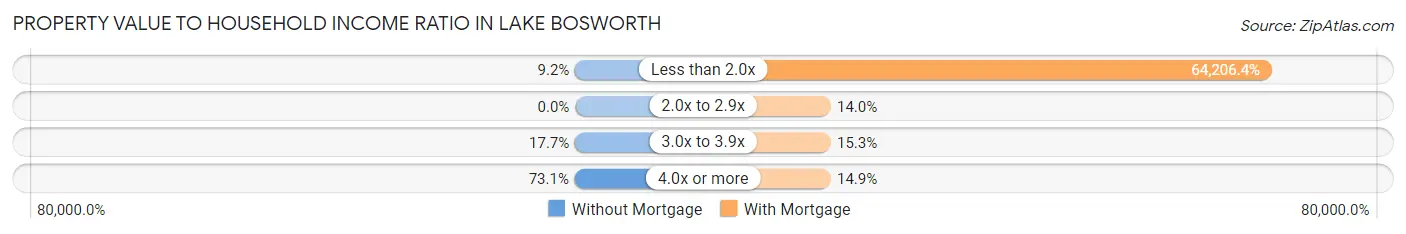
| Value-to-Income Ratio | Without Mortgage | With Mortgage |
| Less than 2.0x | 11 (9.2%) | 150,885 (64,206.4%) |
| 2.0x to 2.9x | 0 (0.0%) | 33 (14.0%) |
| 3.0x to 3.9x | 21 (17.6%) | 36 (15.3%) |
| 4.0x or more | 87 (73.1%) | 35 (14.9%) |
| Total | 119 (100.0%) | 235 (100.0%) |
Real Estate Taxes by Mortgage Status in Lake Bosworth
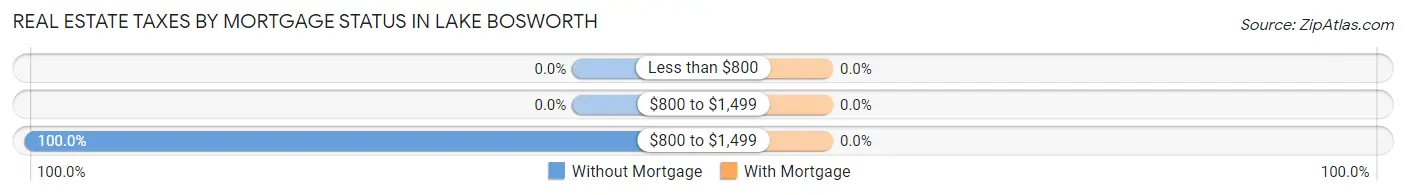
| Property Taxes | Without Mortgage | With Mortgage |
| Less than $800 | 0 (0.0%) | 0 (0.0%) |
| $800 to $1,499 | 0 (0.0%) | 0 (0.0%) |
| $800 to $1,499 | 119 (100.0%) | 0 (0.0%) |
| Total | 119 (100.0%) | 235 (100.0%) |
Health & Disability in Lake Bosworth
Health Insurance Coverage by Age in Lake Bosworth
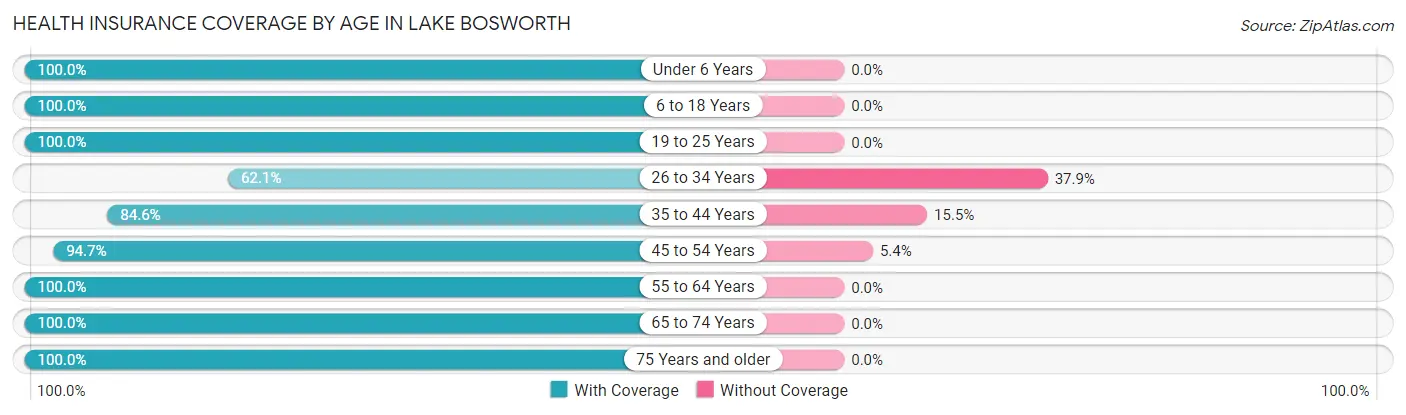
| Age Bracket | With Coverage | Without Coverage |
| Under 6 Years | 43 (100.0%) | 0 (0.0%) |
| 6 to 18 Years | 148 (100.0%) | 0 (0.0%) |
| 19 to 25 Years | 66 (100.0%) | 0 (0.0%) |
| 26 to 34 Years | 36 (62.1%) | 22 (37.9%) |
| 35 to 44 Years | 93 (84.6%) | 17 (15.4%) |
| 45 to 54 Years | 177 (94.7%) | 10 (5.3%) |
| 55 to 64 Years | 241 (100.0%) | 0 (0.0%) |
| 65 to 74 Years | 120 (100.0%) | 0 (0.0%) |
| 75 Years and older | 86 (100.0%) | 0 (0.0%) |
| Total | 1,010 (95.4%) | 49 (4.6%) |
Health Insurance Coverage by Citizenship Status in Lake Bosworth
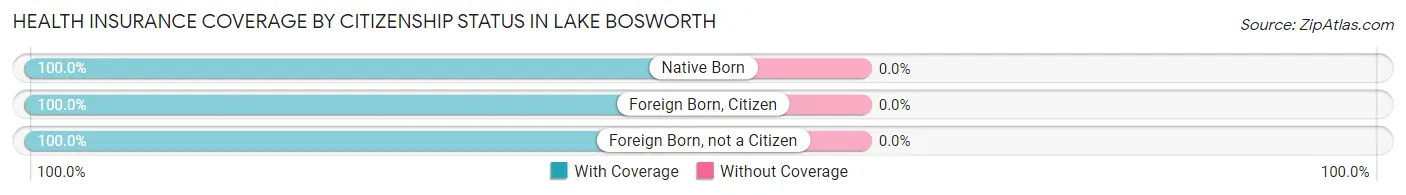
| Citizenship Status | With Coverage | Without Coverage |
| Native Born | 43 (100.0%) | 0 (0.0%) |
| Foreign Born, Citizen | 148 (100.0%) | 0 (0.0%) |
| Foreign Born, not a Citizen | 66 (100.0%) | 0 (0.0%) |
Health Insurance Coverage by Household Income in Lake Bosworth
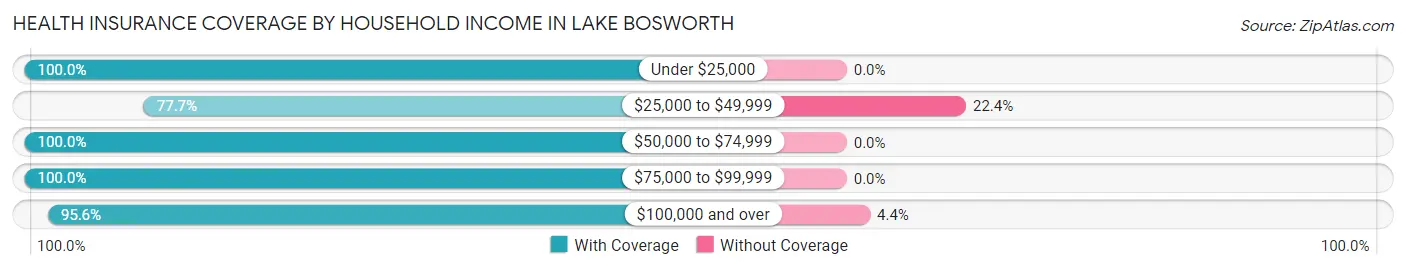
| Household Income | With Coverage | Without Coverage |
| Under $25,000 | 8 (100.0%) | 0 (0.0%) |
| $25,000 to $49,999 | 66 (77.6%) | 19 (22.4%) |
| $50,000 to $74,999 | 191 (100.0%) | 0 (0.0%) |
| $75,000 to $99,999 | 87 (100.0%) | 0 (0.0%) |
| $100,000 and over | 658 (95.6%) | 30 (4.4%) |
Public vs Private Health Insurance Coverage by Age in Lake Bosworth
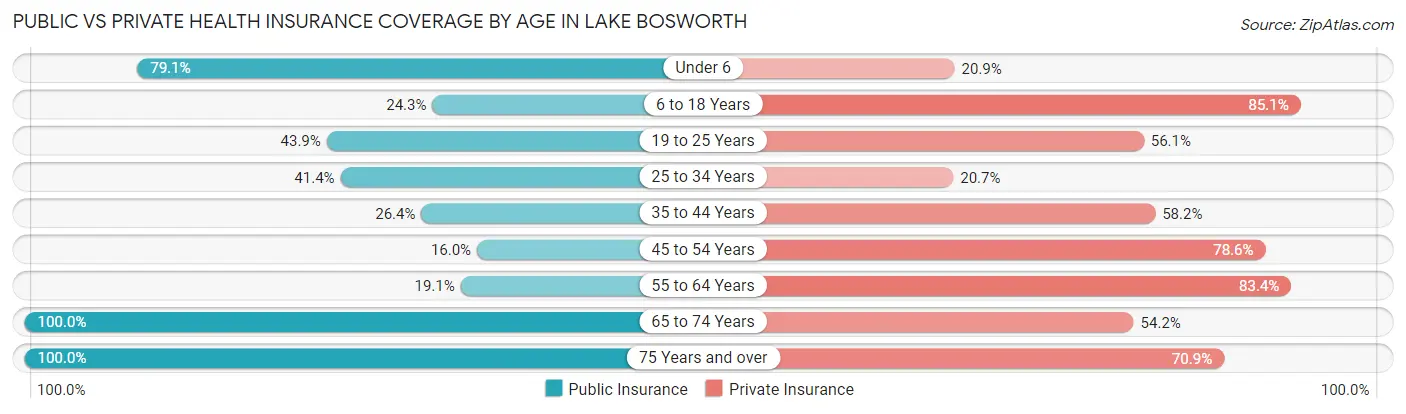
| Age Bracket | Public Insurance | Private Insurance |
| Under 6 | 34 (79.1%) | 9 (20.9%) |
| 6 to 18 Years | 36 (24.3%) | 126 (85.1%) |
| 19 to 25 Years | 29 (43.9%) | 37 (56.1%) |
| 25 to 34 Years | 24 (41.4%) | 12 (20.7%) |
| 35 to 44 Years | 29 (26.4%) | 64 (58.2%) |
| 45 to 54 Years | 30 (16.0%) | 147 (78.6%) |
| 55 to 64 Years | 46 (19.1%) | 201 (83.4%) |
| 65 to 74 Years | 120 (100.0%) | 65 (54.2%) |
| 75 Years and over | 86 (100.0%) | 61 (70.9%) |
| Total | 434 (41.0%) | 722 (68.2%) |
Disability Status by Sex by Age in Lake Bosworth
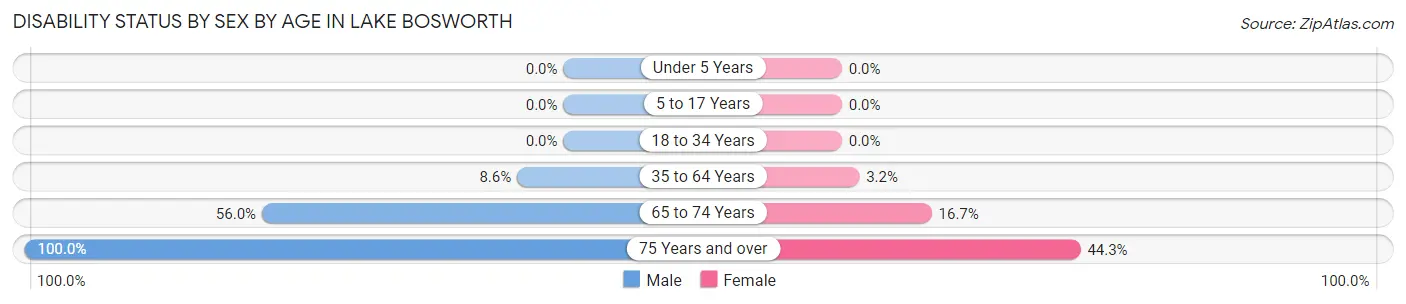
| Age Bracket | Male | Female |
| Under 5 Years | 0 (0.0%) | 0 (0.0%) |
| 5 to 17 Years | 0 (0.0%) | 0 (0.0%) |
| 18 to 34 Years | 0 (0.0%) | 0 (0.0%) |
| 35 to 64 Years | 25 (8.6%) | 8 (3.2%) |
| 65 to 74 Years | 47 (55.9%) | 6 (16.7%) |
| 75 Years and over | 7 (100.0%) | 35 (44.3%) |
Disability Class by Sex by Age in Lake Bosworth
Disability Class: Hearing Difficulty
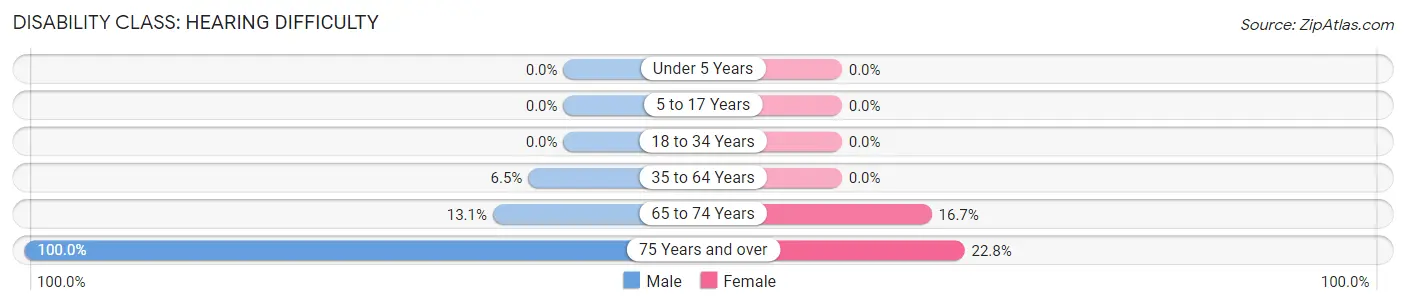
| Age Bracket | Male | Female |
| Under 5 Years | 0 (0.0%) | 0 (0.0%) |
| 5 to 17 Years | 0 (0.0%) | 0 (0.0%) |
| 18 to 34 Years | 0 (0.0%) | 0 (0.0%) |
| 35 to 64 Years | 19 (6.5%) | 0 (0.0%) |
| 65 to 74 Years | 11 (13.1%) | 6 (16.7%) |
| 75 Years and over | 7 (100.0%) | 18 (22.8%) |
Disability Class: Vision Difficulty
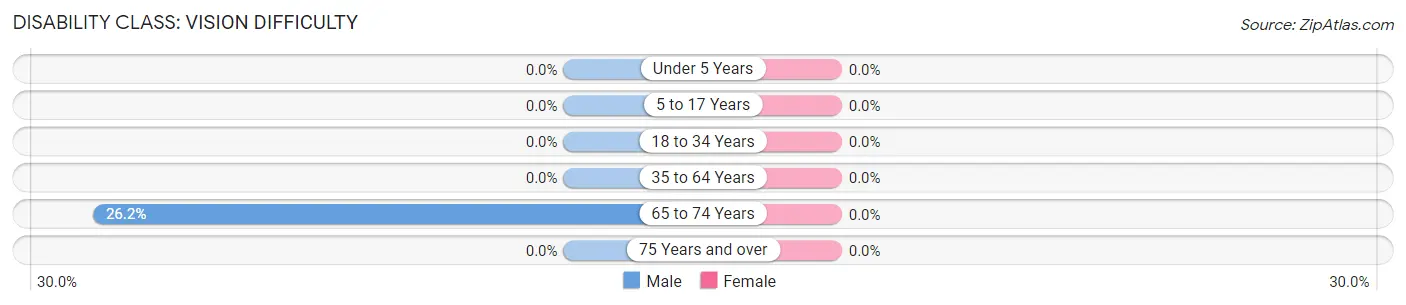
| Age Bracket | Male | Female |
| Under 5 Years | 0 (0.0%) | 0 (0.0%) |
| 5 to 17 Years | 0 (0.0%) | 0 (0.0%) |
| 18 to 34 Years | 0 (0.0%) | 0 (0.0%) |
| 35 to 64 Years | 0 (0.0%) | 0 (0.0%) |
| 65 to 74 Years | 22 (26.2%) | 0 (0.0%) |
| 75 Years and over | 0 (0.0%) | 0 (0.0%) |
Disability Class: Cognitive Difficulty
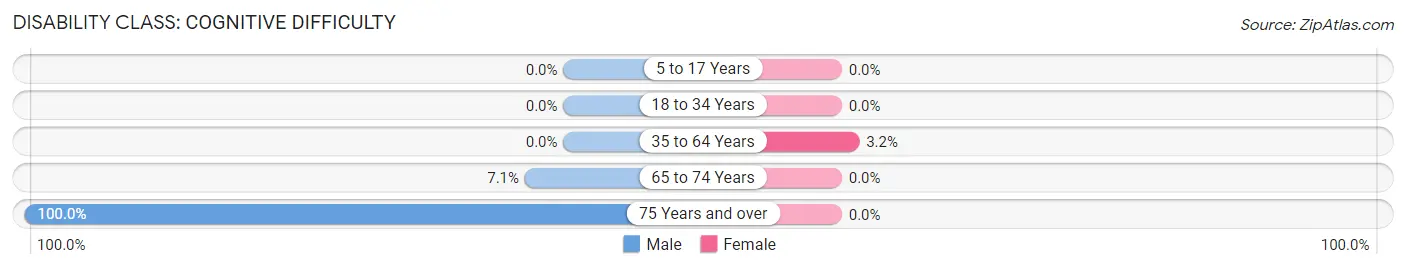
| Age Bracket | Male | Female |
| 5 to 17 Years | 0 (0.0%) | 0 (0.0%) |
| 18 to 34 Years | 0 (0.0%) | 0 (0.0%) |
| 35 to 64 Years | 0 (0.0%) | 8 (3.2%) |
| 65 to 74 Years | 6 (7.1%) | 0 (0.0%) |
| 75 Years and over | 7 (100.0%) | 0 (0.0%) |
Disability Class: Ambulatory Difficulty
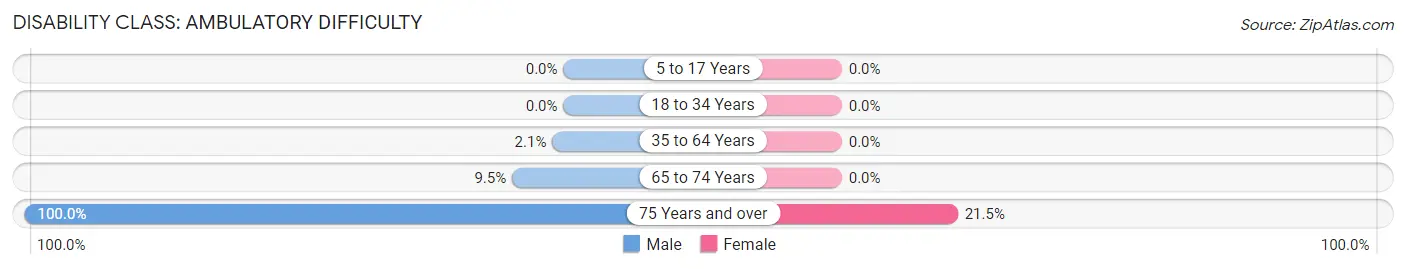
| Age Bracket | Male | Female |
| 5 to 17 Years | 0 (0.0%) | 0 (0.0%) |
| 18 to 34 Years | 0 (0.0%) | 0 (0.0%) |
| 35 to 64 Years | 6 (2.1%) | 0 (0.0%) |
| 65 to 74 Years | 8 (9.5%) | 0 (0.0%) |
| 75 Years and over | 7 (100.0%) | 17 (21.5%) |
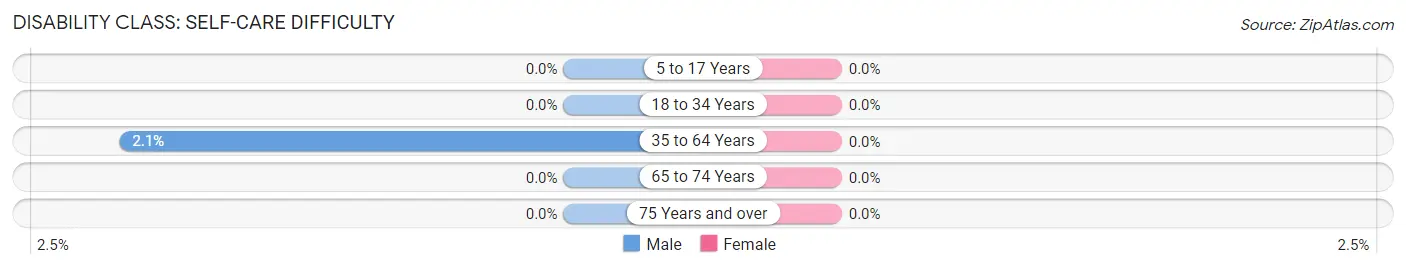
Disability Class: Self-Care Difficulty
| Age Bracket | Male | Female |
| 5 to 17 Years | 0 (0.0%) | 0 (0.0%) |
| 18 to 34 Years | 0 (0.0%) | 0 (0.0%) |
| 35 to 64 Years | 6 (2.1%) | 0 (0.0%) |
| 65 to 74 Years | 0 (0.0%) | 0 (0.0%) |
| 75 Years and over | 0 (0.0%) | 0 (0.0%) |
Technology Access in Lake Bosworth
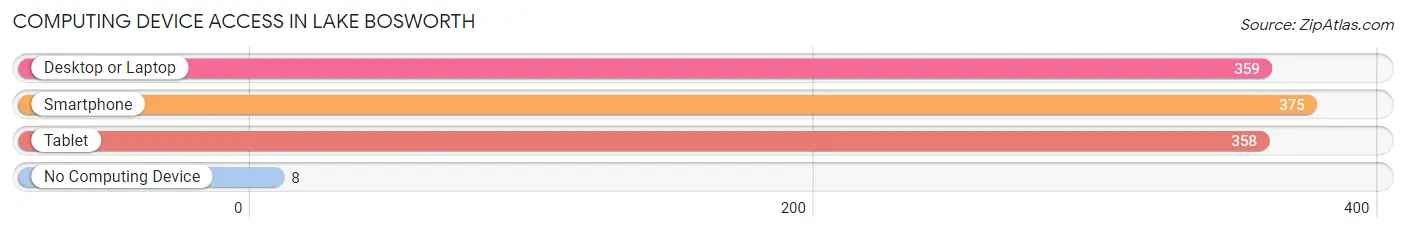
Computing Device Access in Lake Bosworth
| Device Type | # Households | % Households |
| Desktop or Laptop | 359 | 93.7% |
| Smartphone | 375 | 97.9% |
| Tablet | 358 | 93.5% |
| No Computing Device | 8 | 2.1% |
| Total | 383 | 100.0% |
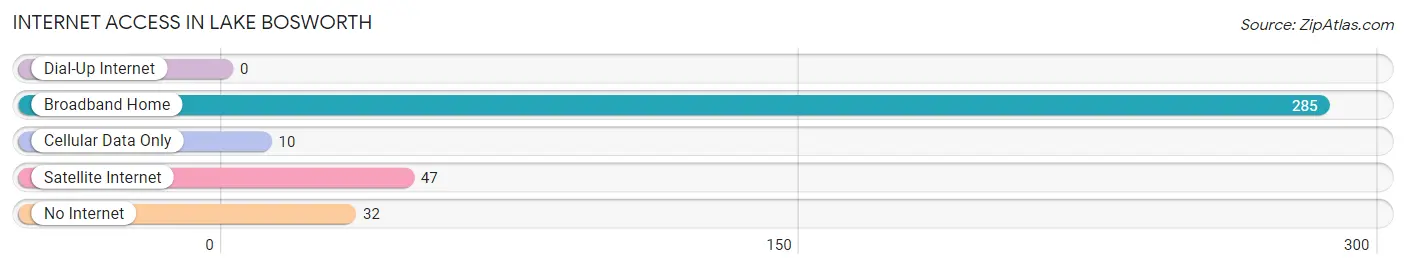
Internet Access in Lake Bosworth
| Internet Type | # Households | % Households |
| Dial-Up Internet | 0 | 0.0% |
| Broadband Home | 285 | 74.4% |
| Cellular Data Only | 10 | 2.6% |
| Satellite Internet | 47 | 12.3% |
| No Internet | 32 | 8.4% |
| Total | 383 | 100.0% |
Lake Bosworth Summary
Lake Bosworth is a small lake located in the Cascade Mountains of Washington State, USA. It is located in Snohomish County, approximately 25 miles northeast of Seattle. The lake is surrounded by the towns of Granite Falls, Lake Stevens, and Arlington. The lake is a popular destination for fishing, swimming, and boating.
Geography
Lake Bosworth is a small lake located in the Cascade Mountains of Washington State, USA. It is located in Snohomish County, approximately 25 miles northeast of Seattle. The lake is surrounded by the towns of Granite Falls, Lake Stevens, and Arlington. The lake is a popular destination for fishing, swimming, and boating. The lake is approximately 1,000 acres in size and has a maximum depth of approximately 40 feet. The lake is fed by several small streams and is drained by the Stillaguamish River. The lake is surrounded by a variety of vegetation, including Douglas fir, western hemlock, western red cedar, and alder.
History
Lake Bosworth was first settled in the late 1800s by homesteaders. The lake was named after the Bosworth family, who were among the first settlers in the area. The lake was used for logging and fishing, and the surrounding area was used for farming. In the early 1900s, the lake was used for recreational activities such as swimming and boating. In the 1950s, the lake was developed for recreational use, and a number of resorts and cabins were built around the lake.
Economy
The economy of Lake Bosworth is largely based on tourism and recreation. The lake is a popular destination for fishing, swimming, and boating. There are several resorts and cabins located around the lake, as well as a number of restaurants and other businesses catering to tourists. The lake is also a popular destination for camping and hiking.
Demographics
The population of Lake Bosworth is approximately 1,000 people. The majority of the population is white (90%), followed by Hispanic (5%), Asian (2%), and African American (1%). The median household income is approximately $50,000, and the median age is 40 years old. The majority of the population is married (60%), and the majority of households are homeowners (80%).
Conclusion
Lake Bosworth is a small lake located in the Cascade Mountains of Washington State, USA. It is a popular destination for fishing, swimming, and boating, and is surrounded by the towns of Granite Falls, Lake Stevens, and Arlington. The economy of Lake Bosworth is largely based on tourism and recreation, and the population is approximately 1,000 people. The majority of the population is white, and the median household income is approximately $50,000.
Common Questions
What is Per Capita Income in Lake Bosworth?
Per Capita income in Lake Bosworth is $48,374.
What is the Median Family Income in Lake Bosworth?
Median Family Income in Lake Bosworth is $137,750.
What is the Median Household income in Lake Bosworth?
Median Household Income in Lake Bosworth is $122,917.
What is Inequality or Gini Index in Lake Bosworth?
Inequality or Gini Index in Lake Bosworth is 0.34.
What is the Total Population of Lake Bosworth?
Total Population of Lake Bosworth is 1,059.
What is the Total Male Population of Lake Bosworth?
Total Male Population of Lake Bosworth is 554.
What is the Total Female Population of Lake Bosworth?
Total Female Population of Lake Bosworth is 505.
What is the Ratio of Males per 100 Females in Lake Bosworth?
There are 109.70 Males per 100 Females in Lake Bosworth.
What is the Ratio of Females per 100 Males in Lake Bosworth?
There are 91.16 Females per 100 Males in Lake Bosworth.
What is the Median Population Age in Lake Bosworth?
Median Population Age in Lake Bosworth is 49.0 Years.
What is the Average Family Size in Lake Bosworth
Average Family Size in Lake Bosworth is 2.8 People.
What is the Average Household Size in Lake Bosworth
Average Household Size in Lake Bosworth is 2.8 People.
How Large is the Labor Force in Lake Bosworth?
There are 584 People in the Labor Forcein in Lake Bosworth.
What is the Percentage of People in the Labor Force in Lake Bosworth?
63.8% of People are in the Labor Force in Lake Bosworth.
What is the Unemployment Rate in Lake Bosworth?
Unemployment Rate in Lake Bosworth is 5.5%.