Lake Cavanaugh, WA Map & Demographics
Lake Cavanaugh Map
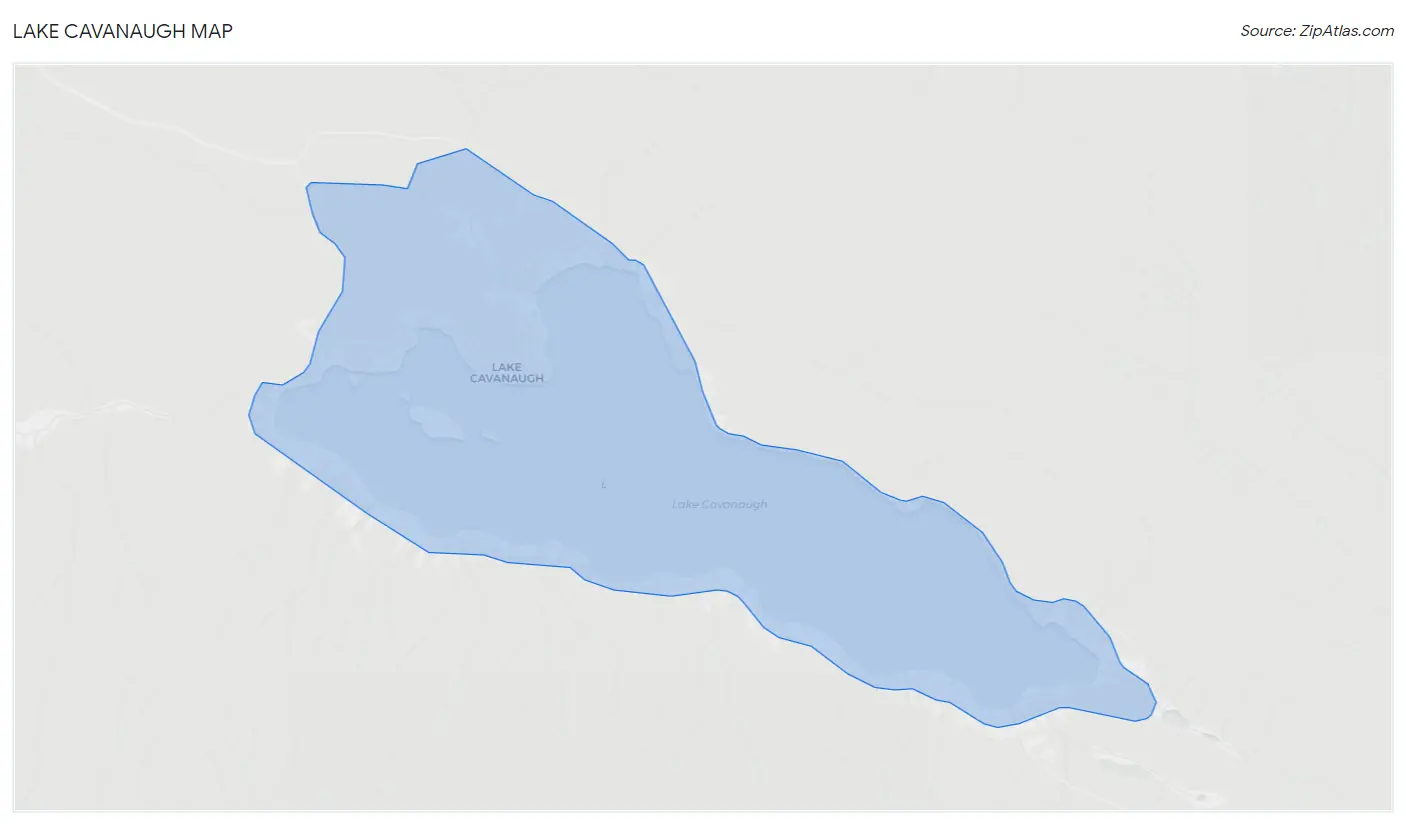
Lake Cavanaugh Overview
$67,632
PER CAPITA INCOME
$149,125
AVG FAMILY INCOME
0.37
INEQUALITY / GINI INDEX
341
TOTAL POPULATION
174
MALE POPULATION
167
FEMALE POPULATION
104.19
MALES / 100 FEMALES
95.98
FEMALES / 100 MALES
74.7
MEDIAN AGE
2.0
AVG FAMILY SIZE
1.6
AVG HOUSEHOLD SIZE
54
LABOR FORCE [ PEOPLE ]
15.8%
PERCENT IN LABOR FORCE
Income in Lake Cavanaugh
Income Overview in Lake Cavanaugh
| Characteristic | Number | Measure |
| Per Capita Income | 341 | $67,632 |
| Median Family Income | 136 | $149,125 |
| Mean Family Income | 136 | $133,626 |
| Median Household Income | 209 | $0 |
| Mean Household Income | 209 | $110,678 |
| Income Deficit | 136 | $0 |
| Wage / Income Gap (%) | 341 | 0.00% |
| Wage / Income Gap ($) | 341 | 100.00¢ per $1 |
| Gini / Inequality Index | 341 | 0.37 |
Earnings by Sex in Lake Cavanaugh
| Sex | Number | Average Earnings |
| Male | 54 (100.0%) | $0 |
| Female | 0 (0.0%) | $0 |
| Total | 54 (100.0%) | $0 |
Earnings by Sex by Income Bracket in Lake Cavanaugh
| Income | Male | Female |
| $2,499 or less | 0 (0.0%) | 0 (0.0%) |
| $2,500 to $4,999 | 0 (0.0%) | 0 (0.0%) |
| $5,000 to $7,499 | 0 (0.0%) | 0 (0.0%) |
| $7,500 to $9,999 | 0 (0.0%) | 0 (0.0%) |
| $10,000 to $12,499 | 0 (0.0%) | 0 (0.0%) |
| $12,500 to $14,999 | 0 (0.0%) | 0 (0.0%) |
| $15,000 to $17,499 | 0 (0.0%) | 0 (0.0%) |
| $17,500 to $19,999 | 0 (0.0%) | 0 (0.0%) |
| $20,000 to $22,499 | 0 (0.0%) | 0 (0.0%) |
| $22,500 to $24,999 | 0 (0.0%) | 0 (0.0%) |
| $25,000 to $29,999 | 0 (0.0%) | 0 (0.0%) |
| $30,000 to $34,999 | 0 (0.0%) | 0 (0.0%) |
| $35,000 to $39,999 | 0 (0.0%) | 0 (0.0%) |
| $40,000 to $44,999 | 0 (0.0%) | 0 (0.0%) |
| $45,000 to $49,999 | 0 (0.0%) | 0 (0.0%) |
| $50,000 to $54,999 | 0 (0.0%) | 0 (0.0%) |
| $55,000 to $64,999 | 0 (0.0%) | 0 (0.0%) |
| $65,000 to $74,999 | 0 (0.0%) | 0 (0.0%) |
| $75,000 to $99,999 | 0 (0.0%) | 0 (0.0%) |
| $100,000+ | 54 (100.0%) | 0 (0.0%) |
| Total | 54 (100.0%) | 0 (0.0%) |
Earnings by Sex by Educational Attainment in Lake Cavanaugh
| Educational Attainment | Male Income | Female Income |
| Less than High School | - | - |
| High School Diploma | - | - |
| College or Associate's Degree | - | - |
| Bachelor's Degree | - | - |
| Graduate Degree | - | - |
| Total | - | - |
Family Income in Lake Cavanaugh
Family Income Brackets in Lake Cavanaugh
According to the Lake Cavanaugh family income data, there are 61 families falling into the $150,000 to $199,999 income range, which is the most common income bracket and makes up 44.9% of all families.
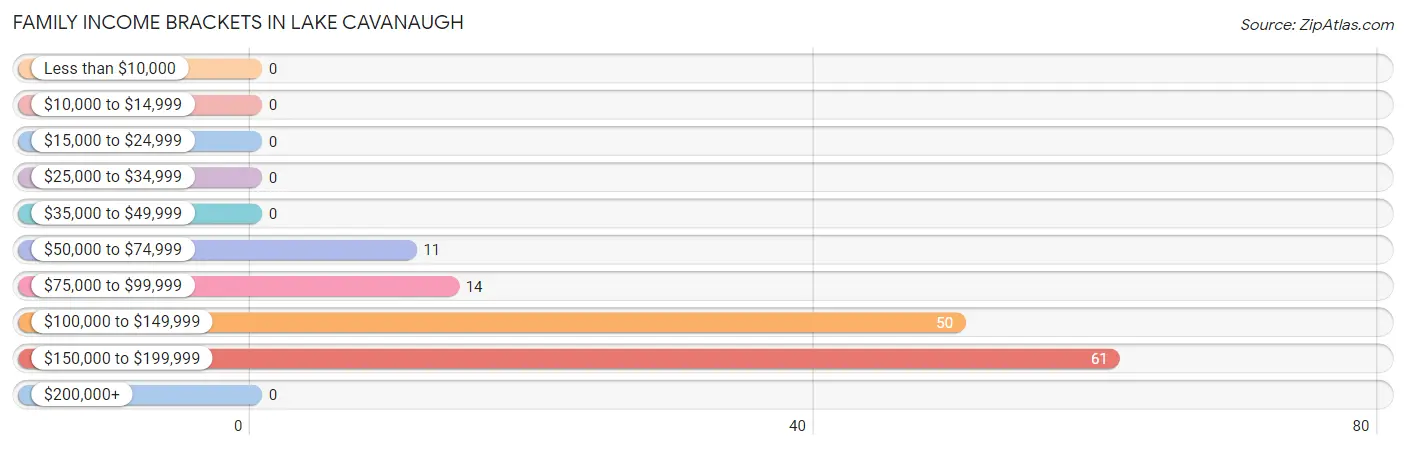
| Income Bracket | # Families | % Families |
| Less than $10,000 | 0 | 0.0% |
| $10,000 to $14,999 | 0 | 0.0% |
| $15,000 to $24,999 | 0 | 0.0% |
| $25,000 to $34,999 | 0 | 0.0% |
| $35,000 to $49,999 | 0 | 0.0% |
| $50,000 to $74,999 | 11 | 8.1% |
| $75,000 to $99,999 | 14 | 10.3% |
| $100,000 to $149,999 | 50 | 36.8% |
| $150,000 to $199,999 | 61 | 44.9% |
| $200,000+ | 0 | 0.0% |
Family Income by Famaliy Size in Lake Cavanaugh
2-person families (136 | 100.0%) account for the highest median family income in Lake Cavanaugh with $149,125 per family, while 2-person families (136 | 100.0%) have the highest median income of $74,562 per family member.
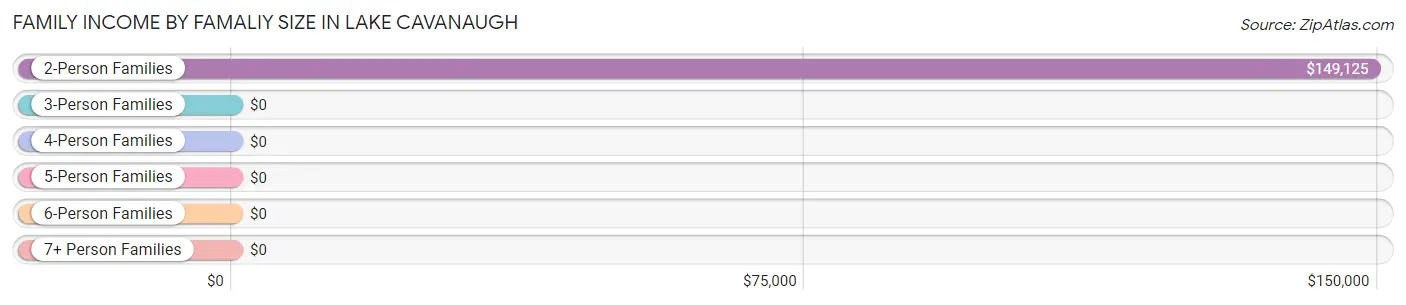
| Income Bracket | # Families | Median Income |
| 2-Person Families | 136 (100.0%) | $149,125 |
| 3-Person Families | 0 (0.0%) | $0 |
| 4-Person Families | 0 (0.0%) | $0 |
| 5-Person Families | 0 (0.0%) | $0 |
| 6-Person Families | 0 (0.0%) | $0 |
| 7+ Person Families | 0 (0.0%) | $0 |
| Total | 136 (100.0%) | $149,125 |
Family Income by Number of Earners in Lake Cavanaugh
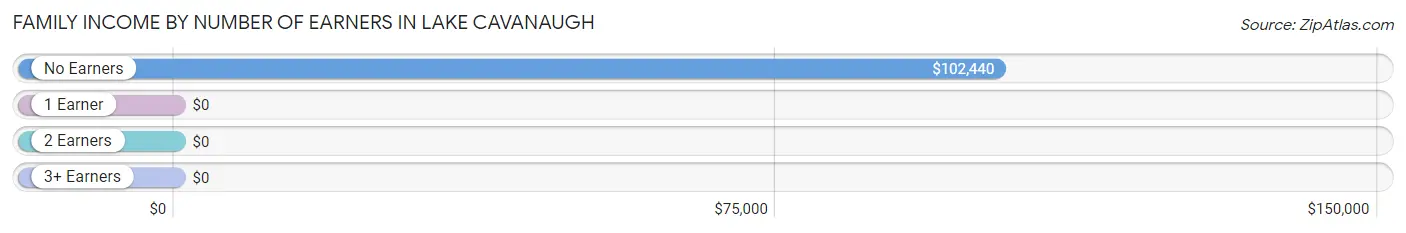
| Number of Earners | # Families | Median Income |
| No Earners | 91 (66.9%) | $102,440 |
| 1 Earner | 45 (33.1%) | $0 |
| 2 Earners | 0 (0.0%) | $0 |
| 3+ Earners | 0 (0.0%) | $0 |
| Total | 136 (100.0%) | $149,125 |
Household Income in Lake Cavanaugh
Household Income Brackets in Lake Cavanaugh
With 61 households falling in the category, the $150,000 to $199,999 income range is the most frequent in Lake Cavanaugh, accounting for 29.2% of all households.
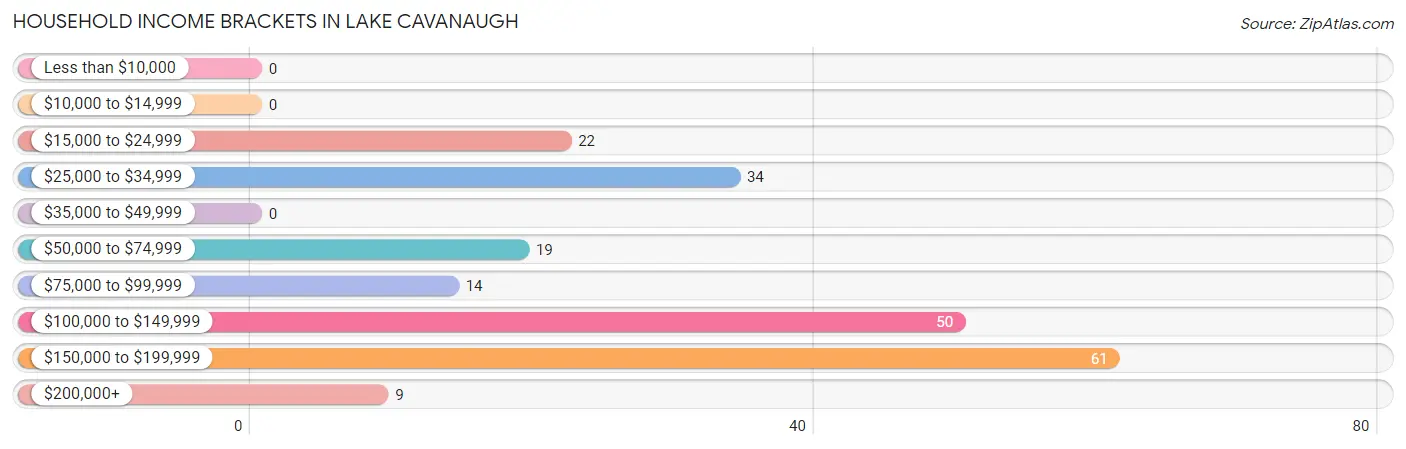
| Income Bracket | # Households | % Households |
| Less than $10,000 | 0 | 0.0% |
| $10,000 to $14,999 | 0 | 0.0% |
| $15,000 to $24,999 | 22 | 10.5% |
| $25,000 to $34,999 | 34 | 16.3% |
| $35,000 to $49,999 | 0 | 0.0% |
| $50,000 to $74,999 | 19 | 9.1% |
| $75,000 to $99,999 | 14 | 6.7% |
| $100,000 to $149,999 | 50 | 23.9% |
| $150,000 to $199,999 | 61 | 29.2% |
| $200,000+ | 9 | 4.3% |
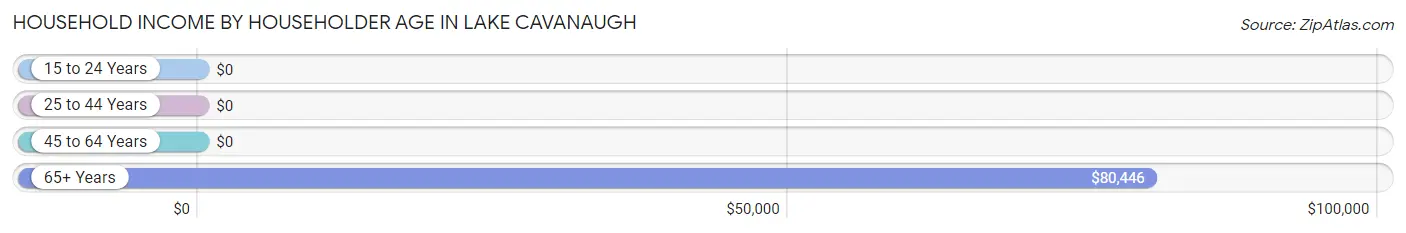
Household Income by Householder Age in Lake Cavanaugh
The median household income in Lake Cavanaugh is $0, with the highest median household income of $80,446 found in the 65+ years age bracket for the primary householder. A total of 155 households (74.2%) fall into this category.
| Income Bracket | # Households | Median Income |
| 15 to 24 Years | 0 (0.0%) | $0 |
| 25 to 44 Years | 0 (0.0%) | $0 |
| 45 to 64 Years | 54 (25.8%) | $0 |
| 65+ Years | 155 (74.2%) | $80,446 |
| Total | 209 (100.0%) | $0 |
Poverty in Lake Cavanaugh
Income Below Poverty by Sex and Age in Lake Cavanaugh
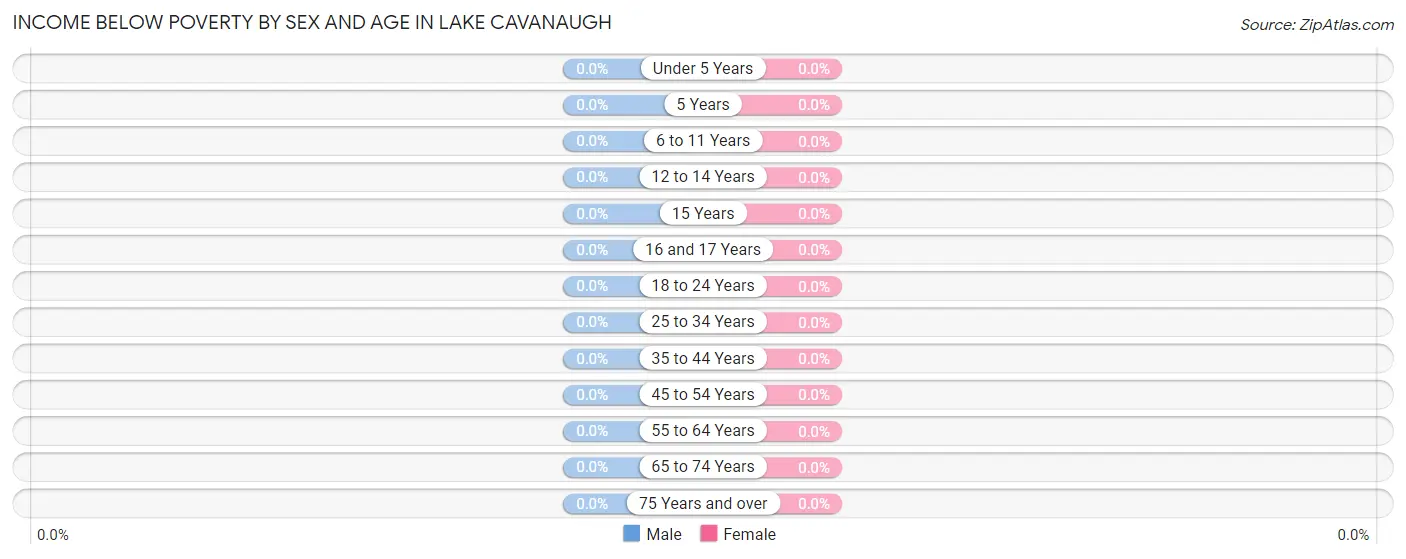
| Age Bracket | Male | Female |
| Under 5 Years | 0 (0.0%) | 0 (0.0%) |
| 5 Years | 0 (0.0%) | 0 (0.0%) |
| 6 to 11 Years | 0 (0.0%) | 0 (0.0%) |
| 12 to 14 Years | 0 (0.0%) | 0 (0.0%) |
| 15 Years | 0 (0.0%) | 0 (0.0%) |
| 16 and 17 Years | 0 (0.0%) | 0 (0.0%) |
| 18 to 24 Years | 0 (0.0%) | 0 (0.0%) |
| 25 to 34 Years | 0 (0.0%) | 0 (0.0%) |
| 35 to 44 Years | 0 (0.0%) | 0 (0.0%) |
| 45 to 54 Years | 0 (0.0%) | 0 (0.0%) |
| 55 to 64 Years | 0 (0.0%) | 0 (0.0%) |
| 65 to 74 Years | 0 (0.0%) | 0 (0.0%) |
| 75 Years and over | 0 (0.0%) | 0 (0.0%) |
| Total | 0 (0.0%) | 0 (0.0%) |
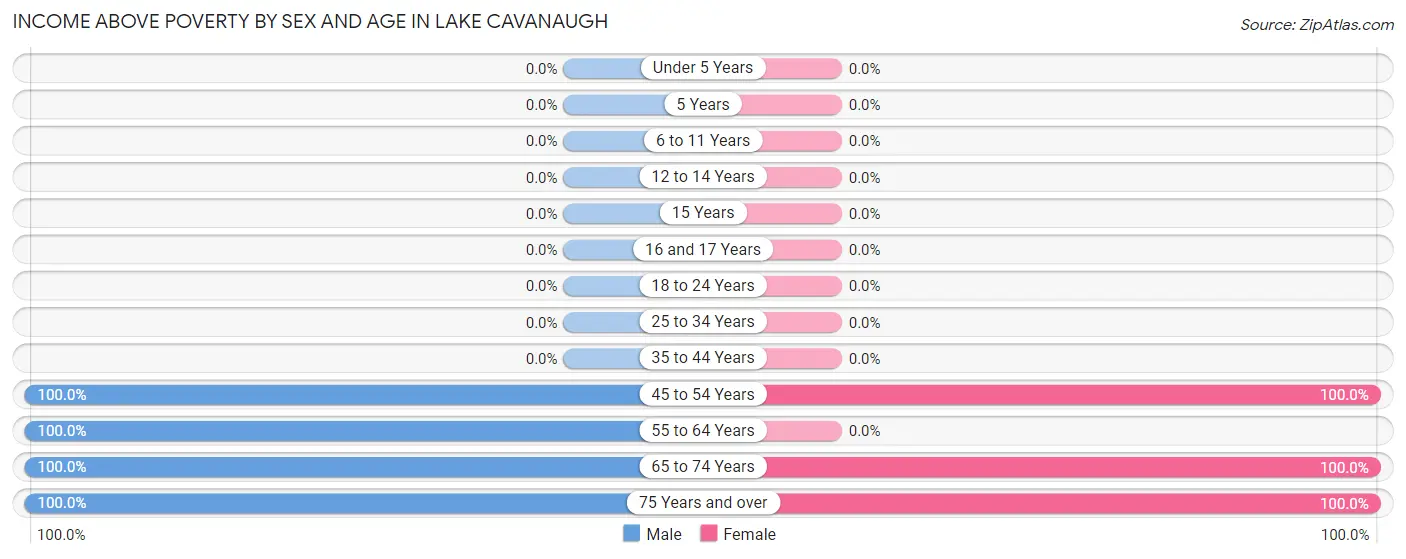
Income Above Poverty by Sex and Age in Lake Cavanaugh
According to the poverty statistics in Lake Cavanaugh, males aged 45 to 54 years and females aged 45 to 54 years are the age groups that are most secure financially, with 100.0% of males and 100.0% of females in these age groups living above the poverty line.
| Age Bracket | Male | Female |
| Under 5 Years | 0 (0.0%) | 0 (0.0%) |
| 5 Years | 0 (0.0%) | 0 (0.0%) |
| 6 to 11 Years | 0 (0.0%) | 0 (0.0%) |
| 12 to 14 Years | 0 (0.0%) | 0 (0.0%) |
| 15 Years | 0 (0.0%) | 0 (0.0%) |
| 16 and 17 Years | 0 (0.0%) | 0 (0.0%) |
| 18 to 24 Years | 0 (0.0%) | 0 (0.0%) |
| 25 to 34 Years | 0 (0.0%) | 0 (0.0%) |
| 35 to 44 Years | 0 (0.0%) | 0 (0.0%) |
| 45 to 54 Years | 45 (100.0%) | 41 (100.0%) |
| 55 to 64 Years | 9 (100.0%) | 0 (0.0%) |
| 65 to 74 Years | 46 (100.0%) | 37 (100.0%) |
| 75 Years and over | 74 (100.0%) | 89 (100.0%) |
| Total | 174 (100.0%) | 167 (100.0%) |
Income Below Poverty Among Married-Couple Families in Lake Cavanaugh
| Children | Above Poverty | Below Poverty |
| No Children | 136 (100.0%) | 0 (0.0%) |
| 1 or 2 Children | 0 (0.0%) | 0 (0.0%) |
| 3 or 4 Children | 0 (0.0%) | 0 (0.0%) |
| 5 or more Children | 0 (0.0%) | 0 (0.0%) |
| Total | 136 (100.0%) | 0 (0.0%) |
Income Below Poverty Among Single-Parent Households in Lake Cavanaugh
| Children | Single Father | Single Mother |
| No Children | 0 (0.0%) | 0 (0.0%) |
| 1 or 2 Children | 0 (0.0%) | 0 (0.0%) |
| 3 or 4 Children | 0 (0.0%) | 0 (0.0%) |
| 5 or more Children | 0 (0.0%) | 0 (0.0%) |
| Total | 0 (0.0%) | 0 (0.0%) |
Income Below Poverty Among Married-Couple vs Single-Parent Households in Lake Cavanaugh
| Children | Married-Couple Families | Single-Parent Households |
| No Children | 0 (0.0%) | 0 (0.0%) |
| 1 or 2 Children | 0 (0.0%) | 0 (0.0%) |
| 3 or 4 Children | 0 (0.0%) | 0 (0.0%) |
| 5 or more Children | 0 (0.0%) | 0 (0.0%) |
| Total | 0 (0.0%) | 0 (0.0%) |
Race in Lake Cavanaugh
The most populous races in Lake Cavanaugh are , and White / Caucasian (341 | 100.0%).
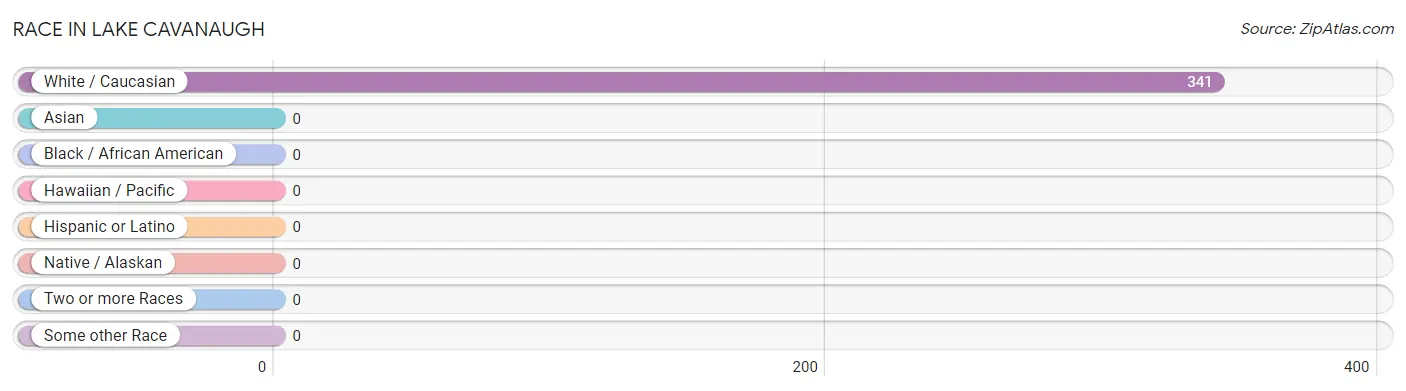
| Race | # Population | % Population |
| Asian | 0 | 0.0% |
| Black / African American | 0 | 0.0% |
| Hawaiian / Pacific | 0 | 0.0% |
| Hispanic or Latino | 0 | 0.0% |
| Native / Alaskan | 0 | 0.0% |
| White / Caucasian | 341 | 100.0% |
| Two or more Races | 0 | 0.0% |
| Some other Race | 0 | 0.0% |
| Total | 341 | 100.0% |
Ancestry in Lake Cavanaugh
The most populous ancestries reported in Lake Cavanaugh are Irish (58 | 17.0%), Swedish (55 | 16.1%), German (54 | 15.8%), Russian (40 | 11.7%), and English (35 | 10.3%), together accounting for 71.0% of all Lake Cavanaugh residents.
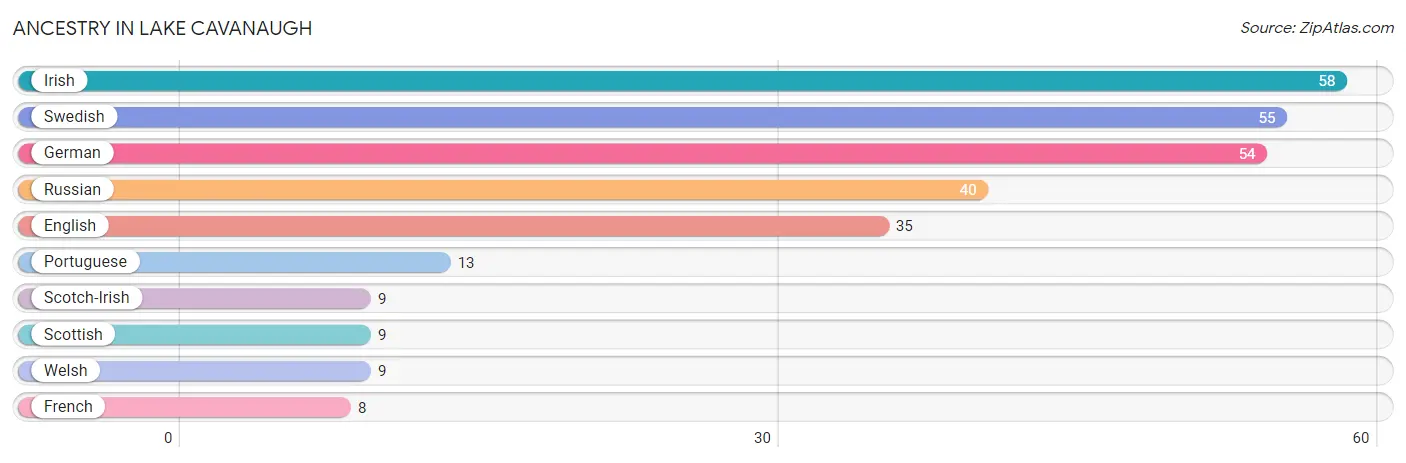
| Ancestry | # Population | % Population |
| English | 35 | 10.3% |
| French | 8 | 2.4% |
| German | 54 | 15.8% |
| Irish | 58 | 17.0% |
| Portuguese | 13 | 3.8% |
| Russian | 40 | 11.7% |
| Scotch-Irish | 9 | 2.6% |
| Scottish | 9 | 2.6% |
| Swedish | 55 | 16.1% |
| Welsh | 9 | 2.6% | View All 10 Rows |
Immigrants in Lake Cavanaugh
The most numerous immigrant groups reported in Lake Cavanaugh came from Eastern Europe (40 | 11.7%), Europe (40 | 11.7%), and Russia (40 | 11.7%), together accounting for 35.2% of all Lake Cavanaugh residents.
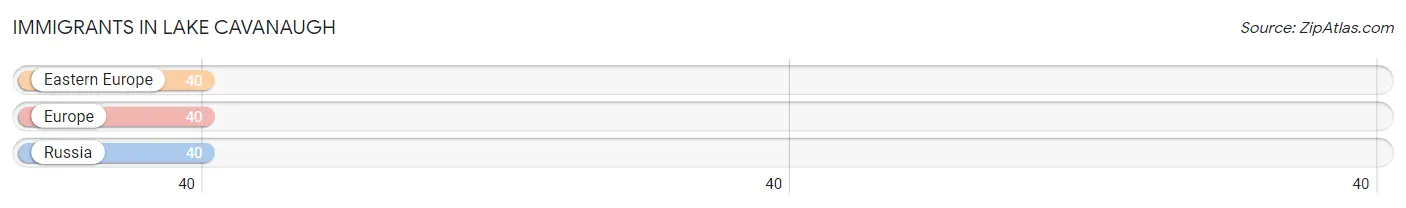
| Immigration Origin | # Population | % Population |
| Eastern Europe | 40 | 11.7% |
| Europe | 40 | 11.7% |
| Russia | 40 | 11.7% | View All 3 Rows |
Sex and Age in Lake Cavanaugh
Sex and Age in Lake Cavanaugh
The most populous age groups in Lake Cavanaugh are 70 to 74 Years (46 | 26.4%) for men and 75 to 79 Years (57 | 34.1%) for women.
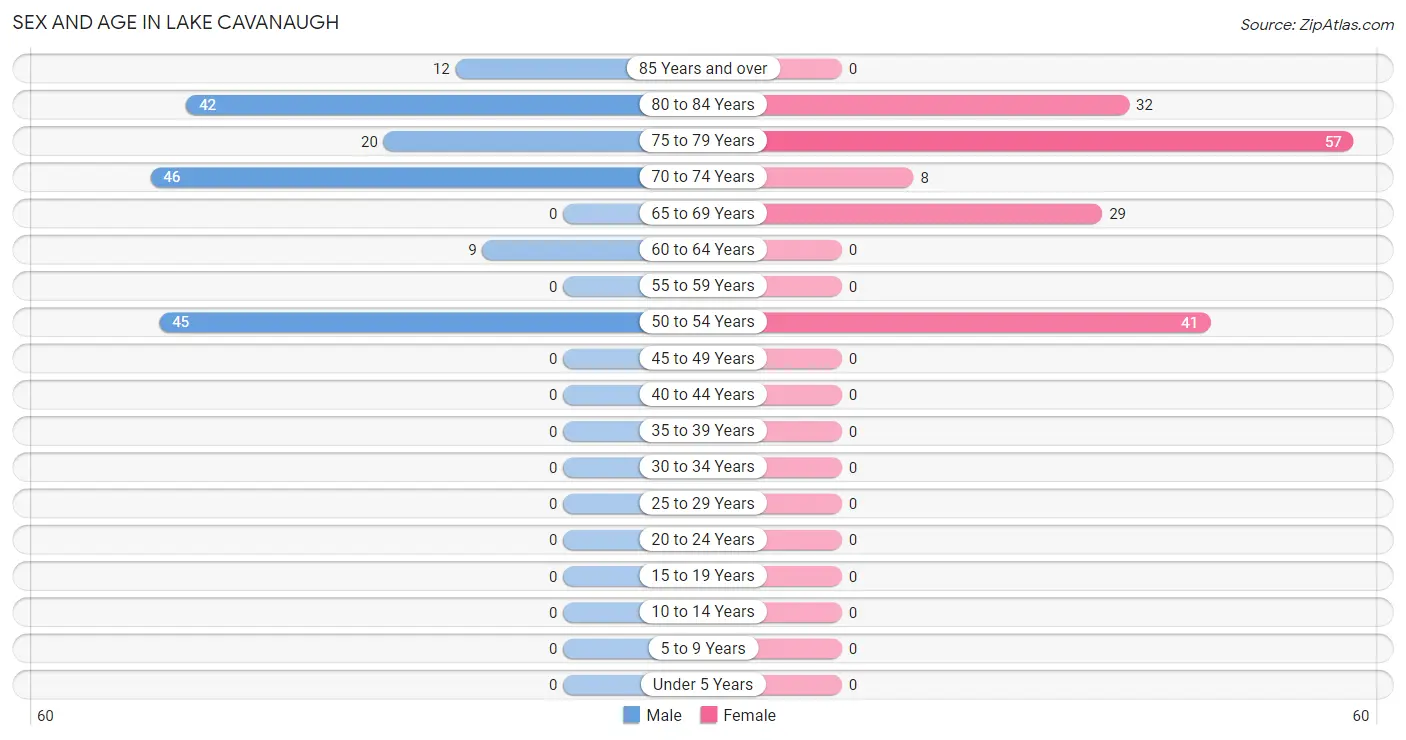
| Age Bracket | Male | Female |
| Under 5 Years | 0 (0.0%) | 0 (0.0%) |
| 5 to 9 Years | 0 (0.0%) | 0 (0.0%) |
| 10 to 14 Years | 0 (0.0%) | 0 (0.0%) |
| 15 to 19 Years | 0 (0.0%) | 0 (0.0%) |
| 20 to 24 Years | 0 (0.0%) | 0 (0.0%) |
| 25 to 29 Years | 0 (0.0%) | 0 (0.0%) |
| 30 to 34 Years | 0 (0.0%) | 0 (0.0%) |
| 35 to 39 Years | 0 (0.0%) | 0 (0.0%) |
| 40 to 44 Years | 0 (0.0%) | 0 (0.0%) |
| 45 to 49 Years | 0 (0.0%) | 0 (0.0%) |
| 50 to 54 Years | 45 (25.9%) | 41 (24.5%) |
| 55 to 59 Years | 0 (0.0%) | 0 (0.0%) |
| 60 to 64 Years | 9 (5.2%) | 0 (0.0%) |
| 65 to 69 Years | 0 (0.0%) | 29 (17.4%) |
| 70 to 74 Years | 46 (26.4%) | 8 (4.8%) |
| 75 to 79 Years | 20 (11.5%) | 57 (34.1%) |
| 80 to 84 Years | 42 (24.1%) | 32 (19.2%) |
| 85 Years and over | 12 (6.9%) | 0 (0.0%) |
| Total | 174 (100.0%) | 167 (100.0%) |
Families and Households in Lake Cavanaugh
Median Family Size in Lake Cavanaugh
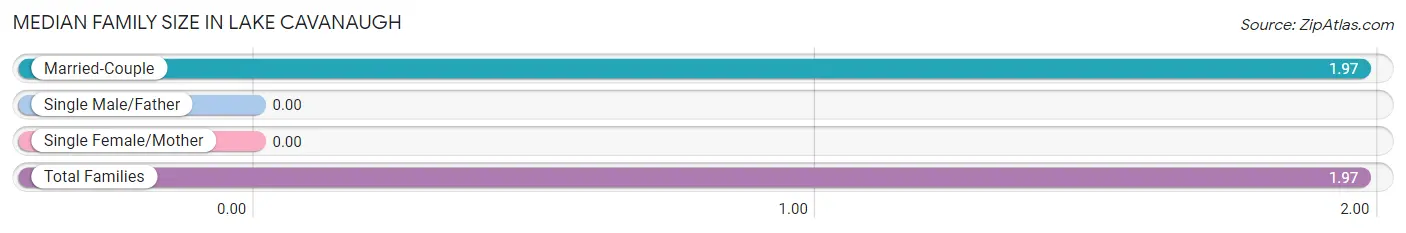
| Family Type | # Families | Family Size |
| Married-Couple | 136 (100.0%) | 1.97 |
| Single Male/Father | 0 (0.0%) | - |
| Single Female/Mother | 0 (0.0%) | - |
| Total Families | 136 (100.0%) | 1.97 |
Median Household Size in Lake Cavanaugh
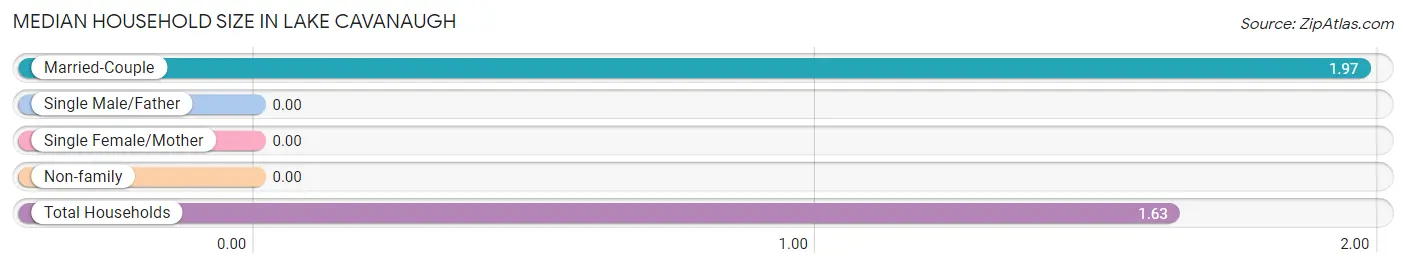
| Household Type | # Households | Household Size |
| Married-Couple | 136 (65.1%) | 1.97 |
| Single Male/Father | 0 (0.0%) | - |
| Single Female/Mother | 0 (0.0%) | - |
| Non-family | 73 (34.9%) | - |
| Total Households | 209 (100.0%) | 1.63 |
Household Size by Marriage Status in Lake Cavanaugh
Out of a total of 209 households in Lake Cavanaugh, 136 (65.1%) are family households, while 73 (34.9%) are nonfamily households. The most numerous type of family households are 2-person households, comprising 136, and the most common type of nonfamily households are 1-person households, comprising 73.
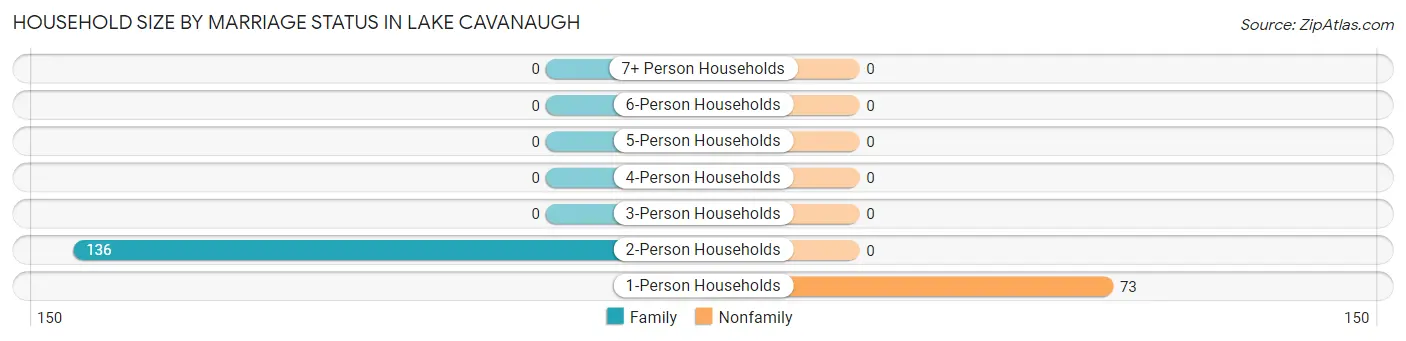
| Household Size | Family Households | Nonfamily Households |
| 1-Person Households | - | 73 (34.9%) |
| 2-Person Households | 136 (65.1%) | 0 (0.0%) |
| 3-Person Households | 0 (0.0%) | 0 (0.0%) |
| 4-Person Households | 0 (0.0%) | 0 (0.0%) |
| 5-Person Households | 0 (0.0%) | 0 (0.0%) |
| 6-Person Households | 0 (0.0%) | 0 (0.0%) |
| 7+ Person Households | 0 (0.0%) | 0 (0.0%) |
| Total | 136 (65.1%) | 73 (34.9%) |
Female Fertility in Lake Cavanaugh
Fertility by Age in Lake Cavanaugh
| Age Bracket | Women with Births | Births / 1,000 Women |
| 15 to 19 years | 0 (0.0%) | 0.0 |
| 20 to 34 years | 0 (0.0%) | 0.0 |
| 35 to 50 years | 0 (0.0%) | 0.0 |
| Total | 0 (0.0%) | 0.0 |
Fertility by Age by Marriage Status in Lake Cavanaugh
| Age Bracket | Married | Unmarried |
| 15 to 19 years | 0 (0.0%) | 0 (0.0%) |
| 20 to 34 years | 0 (0.0%) | 0 (0.0%) |
| 35 to 50 years | 0 (0.0%) | 0 (0.0%) |
| Total | 0 (0.0%) | 0 (0.0%) |
Fertility by Education in Lake Cavanaugh
| Educational Attainment | Women with Births | Births / 1,000 Women |
| Less than High School | 0 (0.0%) | 0.0 |
| High School Diploma | 0 (0.0%) | 0.0 |
| College or Associate's Degree | 0 (0.0%) | 0.0 |
| Bachelor's Degree | 0 (0.0%) | 0.0 |
| Graduate Degree | 0 (0.0%) | 0.0 |
| Total | 0 (0.0%) | 0.0 |
Fertility by Education by Marriage Status in Lake Cavanaugh
| Educational Attainment | Married | Unmarried |
| Less than High School | 0 (0.0%) | 0 (0.0%) |
| High School Diploma | 0 (0.0%) | 0 (0.0%) |
| College or Associate's Degree | 0 (0.0%) | 0 (0.0%) |
| Bachelor's Degree | 0 (0.0%) | 0 (0.0%) |
| Graduate Degree | 0 (0.0%) | 0 (0.0%) |
| Total | 0 (0.0%) | 0 (0.0%) |
Employment Characteristics in Lake Cavanaugh
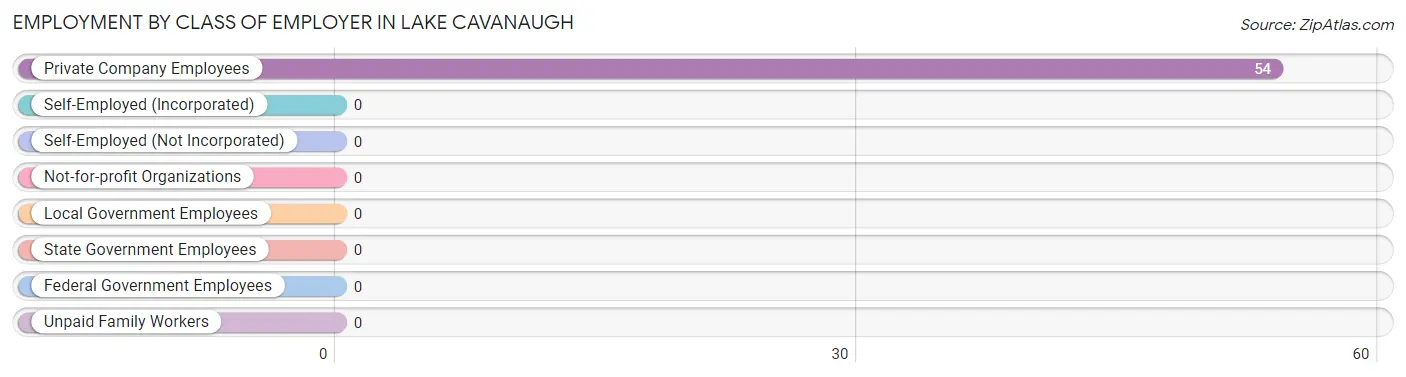
Employment by Class of Employer in Lake Cavanaugh
Among the 54 employed individuals in Lake Cavanaugh, , and private company employees (54 | 100.0%) make up the most common classes of employment.
| Employer Class | # Employees | % Employees |
| Private Company Employees | 54 | 100.0% |
| Self-Employed (Incorporated) | 0 | 0.0% |
| Self-Employed (Not Incorporated) | 0 | 0.0% |
| Not-for-profit Organizations | 0 | 0.0% |
| Local Government Employees | 0 | 0.0% |
| State Government Employees | 0 | 0.0% |
| Federal Government Employees | 0 | 0.0% |
| Unpaid Family Workers | 0 | 0.0% |
| Total | 54 | 100.0% |
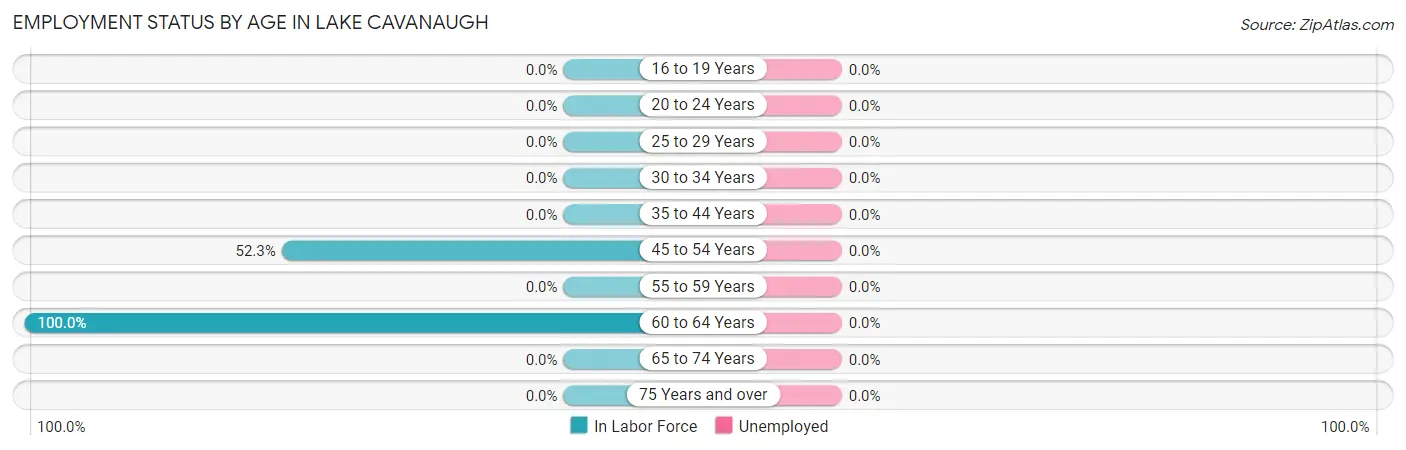
Employment Status by Age in Lake Cavanaugh
| Age Bracket | In Labor Force | Unemployed |
| 16 to 19 Years | 0 (0.0%) | 0 (0.0%) |
| 20 to 24 Years | 0 (0.0%) | 0 (0.0%) |
| 25 to 29 Years | 0 (0.0%) | 0 (0.0%) |
| 30 to 34 Years | 0 (0.0%) | 0 (0.0%) |
| 35 to 44 Years | 0 (0.0%) | 0 (0.0%) |
| 45 to 54 Years | 45 (52.3%) | 0 (0.0%) |
| 55 to 59 Years | 0 (0.0%) | 0 (0.0%) |
| 60 to 64 Years | 9 (100.0%) | 0 (0.0%) |
| 65 to 74 Years | 0 (0.0%) | 0 (0.0%) |
| 75 Years and over | 0 (0.0%) | 0 (0.0%) |
| Total | 54 (15.8%) | 0 (0.0%) |
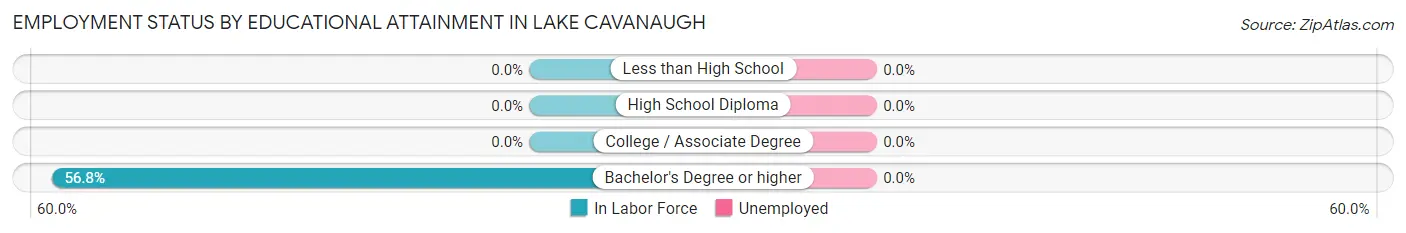
Employment Status by Educational Attainment in Lake Cavanaugh
| Educational Attainment | In Labor Force | Unemployed |
| Less than High School | 0 (0.0%) | 0 (0.0%) |
| High School Diploma | 0 (0.0%) | 0 (0.0%) |
| College / Associate Degree | 0 (0.0%) | 0 (0.0%) |
| Bachelor's Degree or higher | 54 (56.8%) | 0 (0.0%) |
| Total | 54 (56.8%) | 0 (0.0%) |
Employment Occupations by Sex in Lake Cavanaugh
Management, Business, Science and Arts Occupations
Management, Business, Science and Arts Occupations by Sex
| Occupation | Male | Female |
| Management | 0 (0.0%) | 0 (0.0%) |
| Business & Financial | 0 (0.0%) | 0 (0.0%) |
| Computers, Engineering & Science | 0 (0.0%) | 0 (0.0%) |
| Computers & Mathematics | 0 (0.0%) | 0 (0.0%) |
| Architecture & Engineering | 0 (0.0%) | 0 (0.0%) |
| Life, Physical & Social Science | 0 (0.0%) | 0 (0.0%) |
| Community & Social Service | 0 (0.0%) | 0 (0.0%) |
| Education, Arts & Media | 0 (0.0%) | 0 (0.0%) |
| Legal Services & Support | 0 (0.0%) | 0 (0.0%) |
| Education Instruction & Library | 0 (0.0%) | 0 (0.0%) |
| Arts, Media & Entertainment | 0 (0.0%) | 0 (0.0%) |
| Health Diagnosing & Treating | 0 (0.0%) | 0 (0.0%) |
| Health Technologists | 0 (0.0%) | 0 (0.0%) |
| Total (Category) | 0 (0.0%) | 0 (0.0%) |
| Total (Overall) | 54 (100.0%) | 0 (0.0%) |
Services Occupations
Services Occupations by Sex
| Occupation | Male | Female |
| Healthcare Support | 0 (0.0%) | 0 (0.0%) |
| Security & Protection | 0 (0.0%) | 0 (0.0%) |
| Firefighting & Prevention | 0 (0.0%) | 0 (0.0%) |
| Law Enforcement | 0 (0.0%) | 0 (0.0%) |
| Food Preparation & Serving | 0 (0.0%) | 0 (0.0%) |
| Cleaning & Maintenance | 0 (0.0%) | 0 (0.0%) |
| Personal Care & Service | 0 (0.0%) | 0 (0.0%) |
| Total (Category) | 0 (0.0%) | 0 (0.0%) |
| Total (Overall) | 54 (100.0%) | 0 (0.0%) |
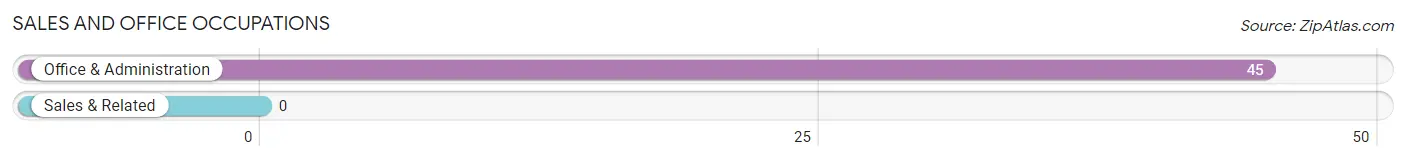
Sales and Office Occupations
The most common Sales and Office occupations in Lake Cavanaugh are , and Office & Administration (45 | 83.3%).
Sales and Office Occupations by Sex
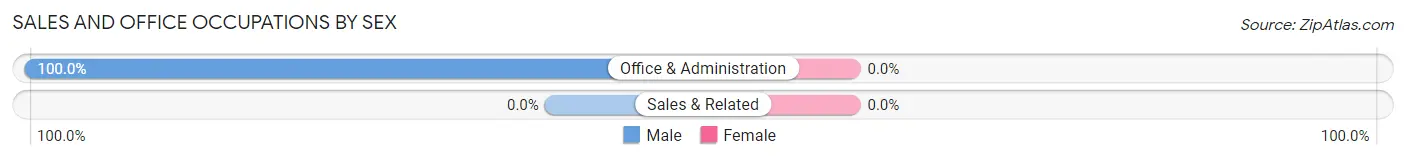
| Occupation | Male | Female |
| Sales & Related | 0 (0.0%) | 0 (0.0%) |
| Office & Administration | 45 (100.0%) | 0 (0.0%) |
| Total (Category) | 45 (100.0%) | 0 (0.0%) |
| Total (Overall) | 54 (100.0%) | 0 (0.0%) |
Natural Resources, Construction and Maintenance Occupations
Natural Resources, Construction and Maintenance Occupations by Sex
| Occupation | Male | Female |
| Farming, Fishing & Forestry | 0 (0.0%) | 0 (0.0%) |
| Construction & Extraction | 0 (0.0%) | 0 (0.0%) |
| Installation, Maintenance & Repair | 0 (0.0%) | 0 (0.0%) |
| Total (Category) | 0 (0.0%) | 0 (0.0%) |
| Total (Overall) | 54 (100.0%) | 0 (0.0%) |
Production, Transportation and Moving Occupations
The most common Production, Transportation and Moving occupations in Lake Cavanaugh are , and Transportation (9 | 16.7%).

Production, Transportation and Moving Occupations by Sex
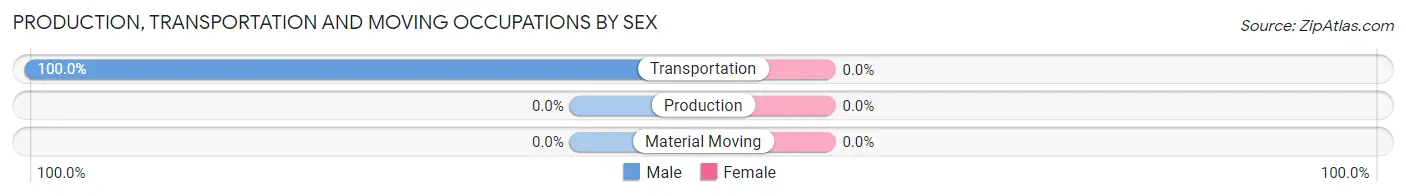
| Occupation | Male | Female |
| Production | 0 (0.0%) | 0 (0.0%) |
| Transportation | 9 (100.0%) | 0 (0.0%) |
| Material Moving | 0 (0.0%) | 0 (0.0%) |
| Total (Category) | 9 (100.0%) | 0 (0.0%) |
| Total (Overall) | 54 (100.0%) | 0 (0.0%) |
Employment Industries by Sex in Lake Cavanaugh
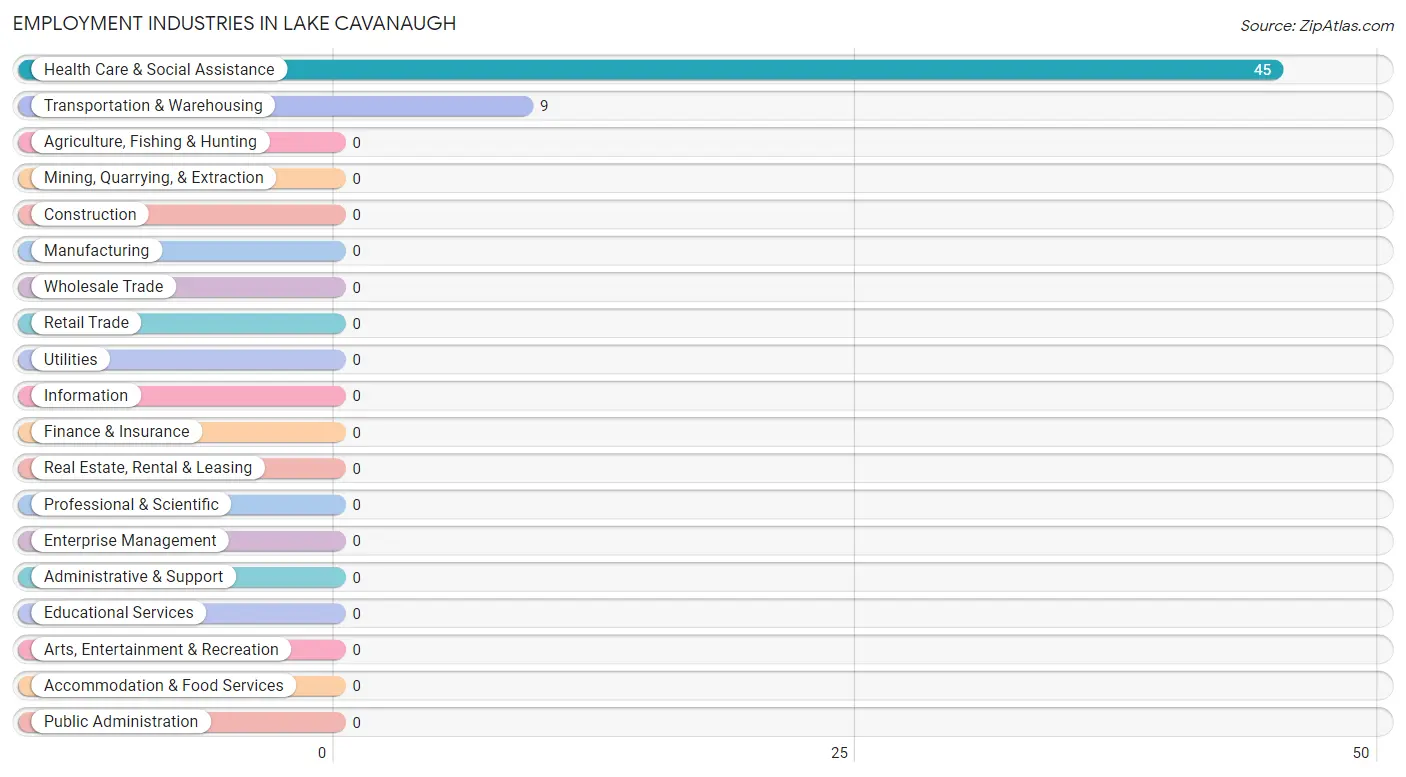
Employment Industries in Lake Cavanaugh
The major employment industries in Lake Cavanaugh include Health Care & Social Assistance (45 | 83.3%), and Transportation & Warehousing (9 | 16.7%).
Employment Industries by Sex in Lake Cavanaugh
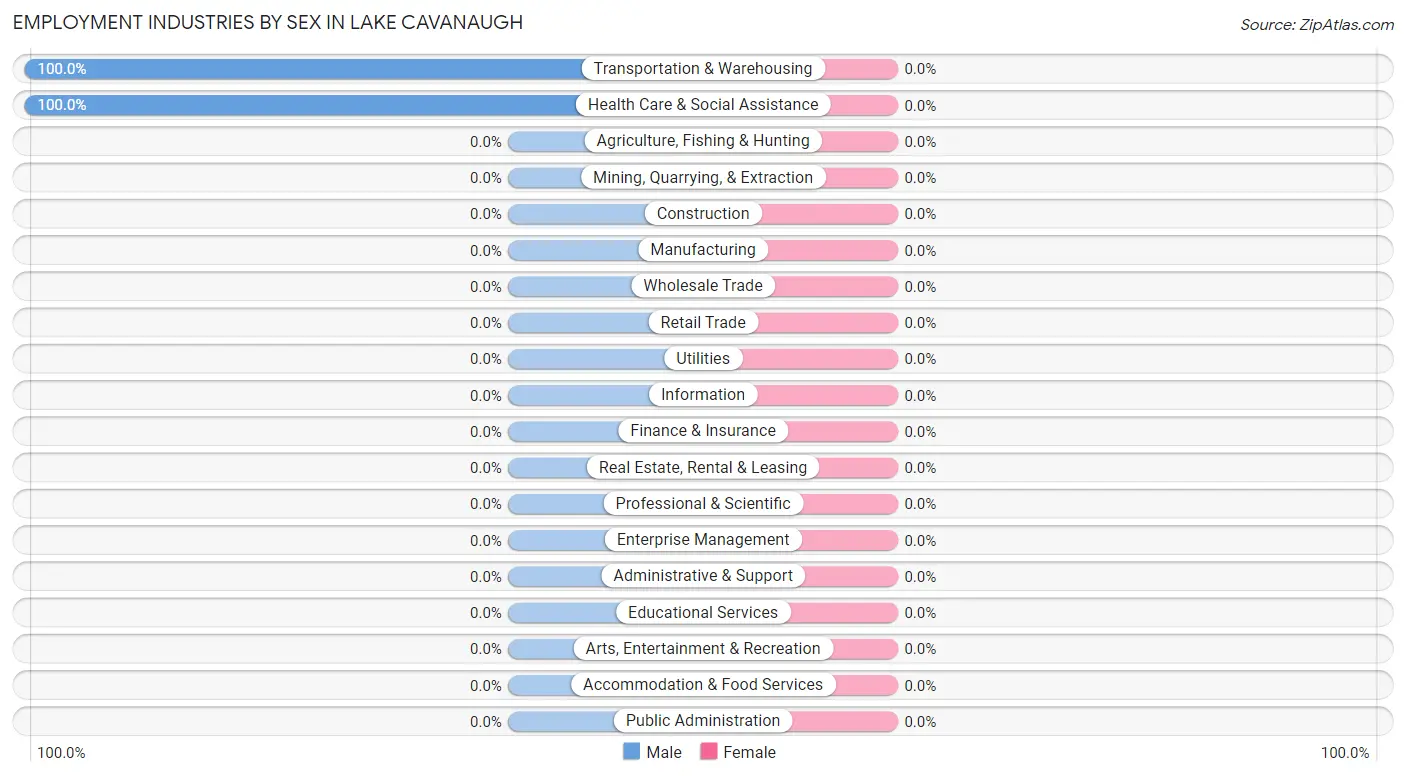
| Industry | Male | Female |
| Agriculture, Fishing & Hunting | 0 (0.0%) | 0 (0.0%) |
| Mining, Quarrying, & Extraction | 0 (0.0%) | 0 (0.0%) |
| Construction | 0 (0.0%) | 0 (0.0%) |
| Manufacturing | 0 (0.0%) | 0 (0.0%) |
| Wholesale Trade | 0 (0.0%) | 0 (0.0%) |
| Retail Trade | 0 (0.0%) | 0 (0.0%) |
| Transportation & Warehousing | 9 (100.0%) | 0 (0.0%) |
| Utilities | 0 (0.0%) | 0 (0.0%) |
| Information | 0 (0.0%) | 0 (0.0%) |
| Finance & Insurance | 0 (0.0%) | 0 (0.0%) |
| Real Estate, Rental & Leasing | 0 (0.0%) | 0 (0.0%) |
| Professional & Scientific | 0 (0.0%) | 0 (0.0%) |
| Enterprise Management | 0 (0.0%) | 0 (0.0%) |
| Administrative & Support | 0 (0.0%) | 0 (0.0%) |
| Educational Services | 0 (0.0%) | 0 (0.0%) |
| Health Care & Social Assistance | 45 (100.0%) | 0 (0.0%) |
| Arts, Entertainment & Recreation | 0 (0.0%) | 0 (0.0%) |
| Accommodation & Food Services | 0 (0.0%) | 0 (0.0%) |
| Public Administration | 0 (0.0%) | 0 (0.0%) |
| Total | 54 (100.0%) | 0 (0.0%) |
Education in Lake Cavanaugh
School Enrollment in Lake Cavanaugh
| School Level | # Students | % Students |
| Nursery / Preschool | 0 | 0.0% |
| Kindergarten | 0 | 0.0% |
| Elementary School | 0 | 0.0% |
| Middle School | 0 | 0.0% |
| High School | 0 | 0.0% |
| College / Undergraduate | 0 | 0.0% |
| Graduate / Professional | 0 | 0.0% |
| Total | 0 | 0.0% |
School Enrollment by Age by Funding Source in Lake Cavanaugh
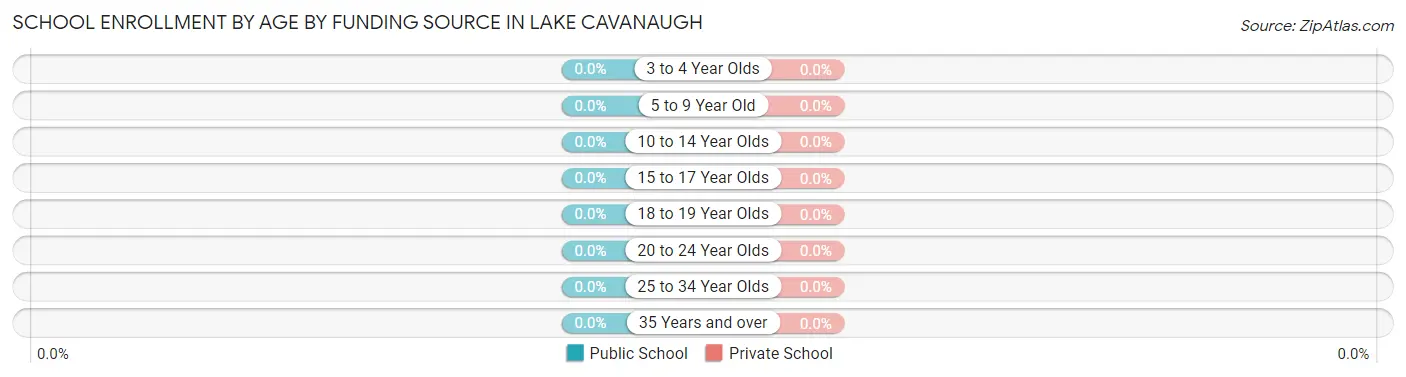
| Age Bracket | Public School | Private School |
| 3 to 4 Year Olds | 0 (0.0%) | 0 (0.0%) |
| 5 to 9 Year Old | 0 (0.0%) | 0 (0.0%) |
| 10 to 14 Year Olds | 0 (0.0%) | 0 (0.0%) |
| 15 to 17 Year Olds | 0 (0.0%) | 0 (0.0%) |
| 18 to 19 Year Olds | 0 (0.0%) | 0 (0.0%) |
| 20 to 24 Year Olds | 0 (0.0%) | 0 (0.0%) |
| 25 to 34 Year Olds | 0 (0.0%) | 0 (0.0%) |
| 35 Years and over | 0 (0.0%) | 0 (0.0%) |
| Total | 0 (0.0%) | 0 (0.0%) |
Educational Attainment by Field of Study in Lake Cavanaugh
Business (86 | 40.6%), education (51 | 24.1%), engineering (30 | 14.1%), computers & mathematics (20 | 9.4%), and science & technology (9 | 4.3%) are the most common fields of study among 212 individuals in Lake Cavanaugh who have obtained a bachelor's degree or higher.
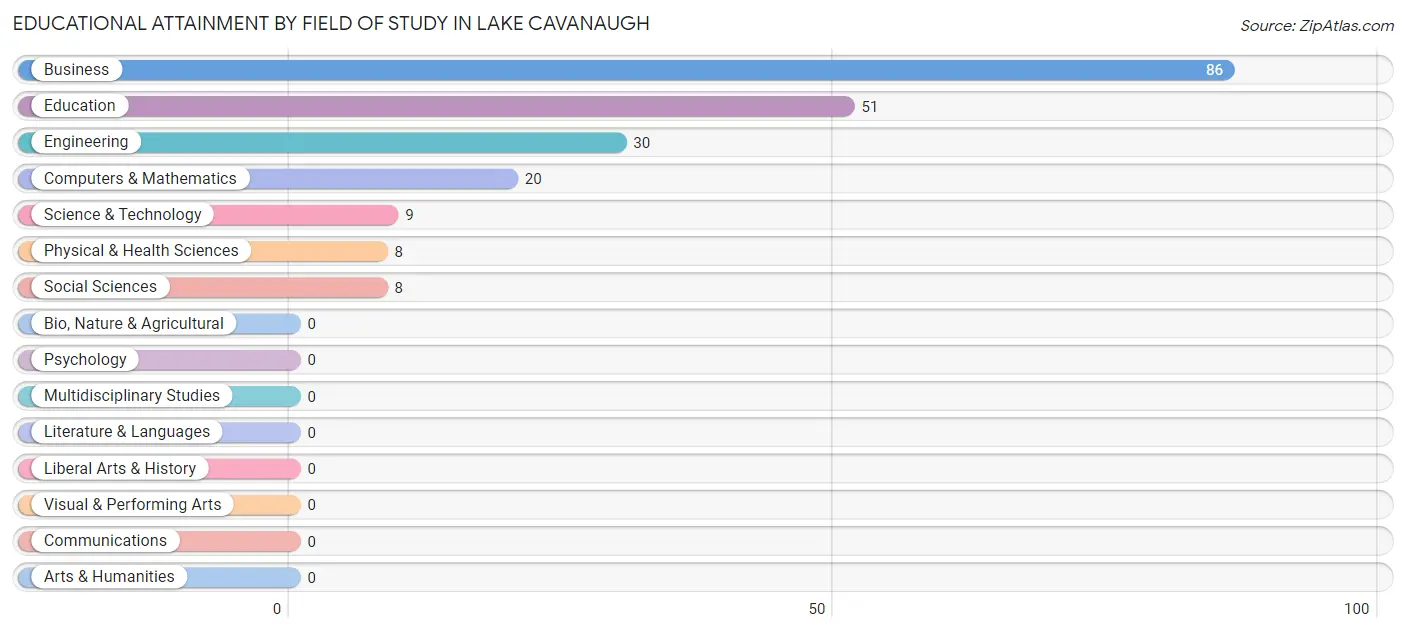
| Field of Study | # Graduates | % Graduates |
| Computers & Mathematics | 20 | 9.4% |
| Bio, Nature & Agricultural | 0 | 0.0% |
| Physical & Health Sciences | 8 | 3.8% |
| Psychology | 0 | 0.0% |
| Social Sciences | 8 | 3.8% |
| Engineering | 30 | 14.1% |
| Multidisciplinary Studies | 0 | 0.0% |
| Science & Technology | 9 | 4.3% |
| Business | 86 | 40.6% |
| Education | 51 | 24.1% |
| Literature & Languages | 0 | 0.0% |
| Liberal Arts & History | 0 | 0.0% |
| Visual & Performing Arts | 0 | 0.0% |
| Communications | 0 | 0.0% |
| Arts & Humanities | 0 | 0.0% |
| Total | 212 | 100.0% |
Transportation & Commute in Lake Cavanaugh
Vehicle Availability by Sex in Lake Cavanaugh
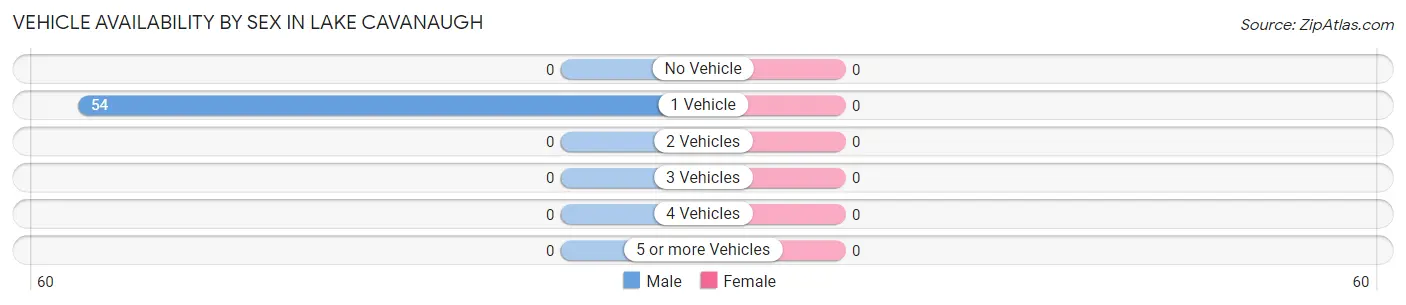
| Vehicles Available | Male | Female |
| No Vehicle | 0 (0.0%) | 0 (0.0%) |
| 1 Vehicle | 54 (100.0%) | 0 (0.0%) |
| 2 Vehicles | 0 (0.0%) | 0 (0.0%) |
| 3 Vehicles | 0 (0.0%) | 0 (0.0%) |
| 4 Vehicles | 0 (0.0%) | 0 (0.0%) |
| 5 or more Vehicles | 0 (0.0%) | 0 (0.0%) |
| Total | 54 (100.0%) | 0 (0.0%) |
Commute Time in Lake Cavanaugh
The most frequently occuring commute durations in Lake Cavanaugh are 45 to 59 minutes (45 commuters, 83.3%), 90 or more minutes (9 commuters, 16.7%), and less than 5 minutes (0 commuters, 0.0%).
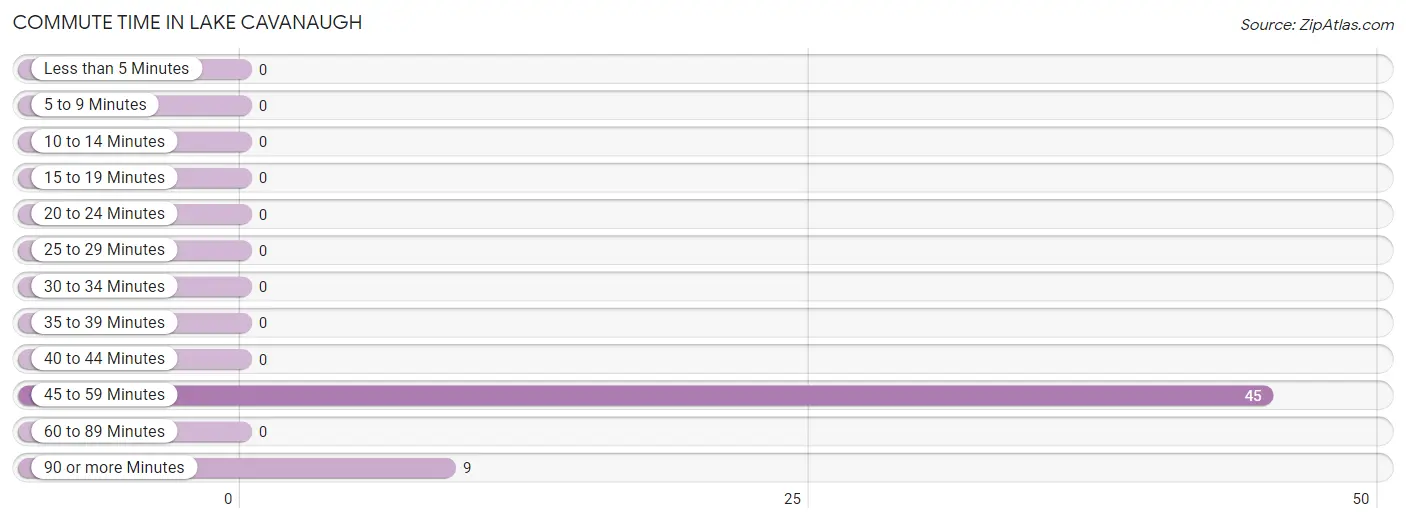
| Commute Time | # Commuters | % Commuters |
| Less than 5 Minutes | 0 | 0.0% |
| 5 to 9 Minutes | 0 | 0.0% |
| 10 to 14 Minutes | 0 | 0.0% |
| 15 to 19 Minutes | 0 | 0.0% |
| 20 to 24 Minutes | 0 | 0.0% |
| 25 to 29 Minutes | 0 | 0.0% |
| 30 to 34 Minutes | 0 | 0.0% |
| 35 to 39 Minutes | 0 | 0.0% |
| 40 to 44 Minutes | 0 | 0.0% |
| 45 to 59 Minutes | 45 | 83.3% |
| 60 to 89 Minutes | 0 | 0.0% |
| 90 or more Minutes | 9 | 16.7% |
Commute Time by Sex in Lake Cavanaugh
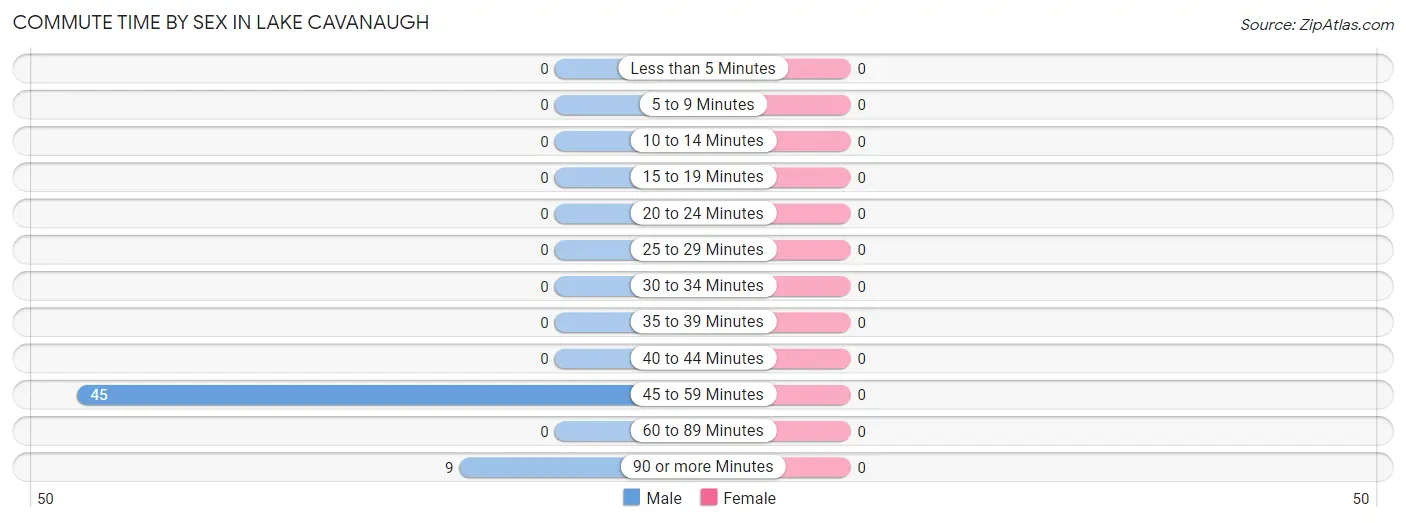
| Commute Time | Male | Female |
| Less than 5 Minutes | 0 (0.0%) | 0 (0.0%) |
| 5 to 9 Minutes | 0 (0.0%) | 0 (0.0%) |
| 10 to 14 Minutes | 0 (0.0%) | 0 (0.0%) |
| 15 to 19 Minutes | 0 (0.0%) | 0 (0.0%) |
| 20 to 24 Minutes | 0 (0.0%) | 0 (0.0%) |
| 25 to 29 Minutes | 0 (0.0%) | 0 (0.0%) |
| 30 to 34 Minutes | 0 (0.0%) | 0 (0.0%) |
| 35 to 39 Minutes | 0 (0.0%) | 0 (0.0%) |
| 40 to 44 Minutes | 0 (0.0%) | 0 (0.0%) |
| 45 to 59 Minutes | 45 (83.3%) | 0 (0.0%) |
| 60 to 89 Minutes | 0 (0.0%) | 0 (0.0%) |
| 90 or more Minutes | 9 (16.7%) | 0 (0.0%) |
Time of Departure to Work by Sex in Lake Cavanaugh
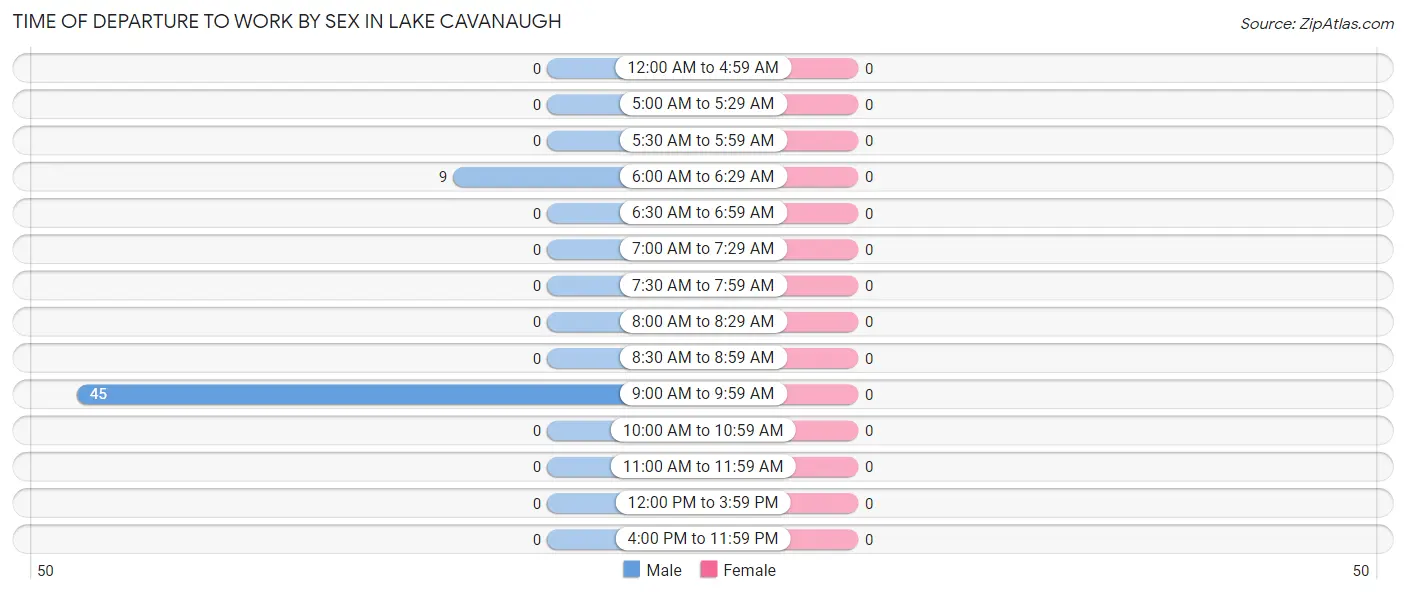
| Time of Departure | Male | Female |
| 12:00 AM to 4:59 AM | 0 (0.0%) | 0 (0.0%) |
| 5:00 AM to 5:29 AM | 0 (0.0%) | 0 (0.0%) |
| 5:30 AM to 5:59 AM | 0 (0.0%) | 0 (0.0%) |
| 6:00 AM to 6:29 AM | 9 (16.7%) | 0 (0.0%) |
| 6:30 AM to 6:59 AM | 0 (0.0%) | 0 (0.0%) |
| 7:00 AM to 7:29 AM | 0 (0.0%) | 0 (0.0%) |
| 7:30 AM to 7:59 AM | 0 (0.0%) | 0 (0.0%) |
| 8:00 AM to 8:29 AM | 0 (0.0%) | 0 (0.0%) |
| 8:30 AM to 8:59 AM | 0 (0.0%) | 0 (0.0%) |
| 9:00 AM to 9:59 AM | 45 (83.3%) | 0 (0.0%) |
| 10:00 AM to 10:59 AM | 0 (0.0%) | 0 (0.0%) |
| 11:00 AM to 11:59 AM | 0 (0.0%) | 0 (0.0%) |
| 12:00 PM to 3:59 PM | 0 (0.0%) | 0 (0.0%) |
| 4:00 PM to 11:59 PM | 0 (0.0%) | 0 (0.0%) |
| Total | 54 (100.0%) | 0 (0.0%) |
Housing Occupancy in Lake Cavanaugh
Occupancy by Ownership in Lake Cavanaugh
Of the total 209 dwellings in Lake Cavanaugh, owner-occupied units account for 209 (100.0%), while renter-occupied units make up 0 (0.0%).
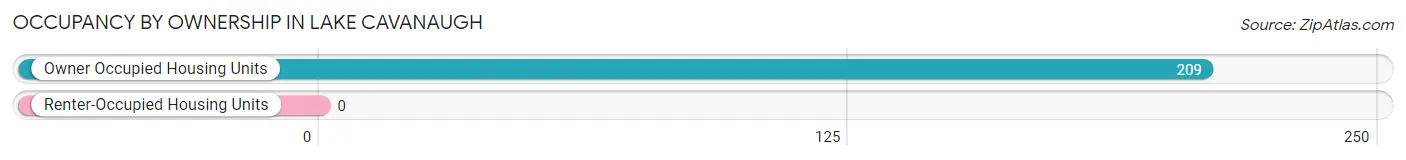
| Occupancy | # Housing Units | % Housing Units |
| Owner Occupied Housing Units | 209 | 100.0% |
| Renter-Occupied Housing Units | 0 | 0.0% |
| Total Occupied Housing Units | 209 | 100.0% |
Occupancy by Household Size in Lake Cavanaugh
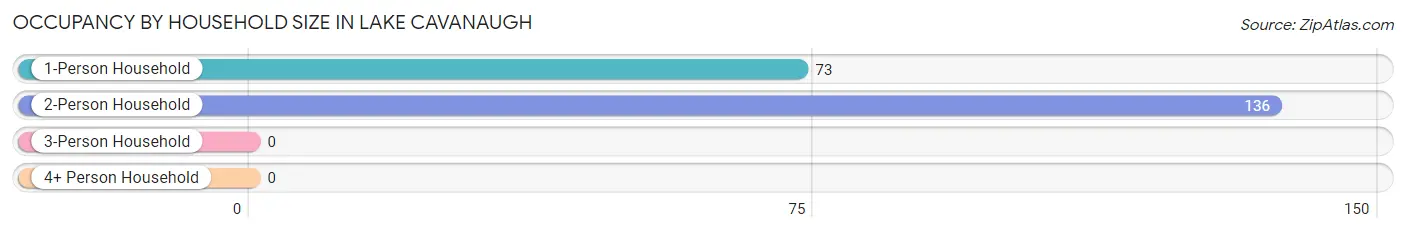
| Household Size | # Housing Units | % Housing Units |
| 1-Person Household | 73 | 34.9% |
| 2-Person Household | 136 | 65.1% |
| 3-Person Household | 0 | 0.0% |
| 4+ Person Household | 0 | 0.0% |
| Total Housing Units | 209 | 100.0% |
Occupancy by Ownership by Household Size in Lake Cavanaugh
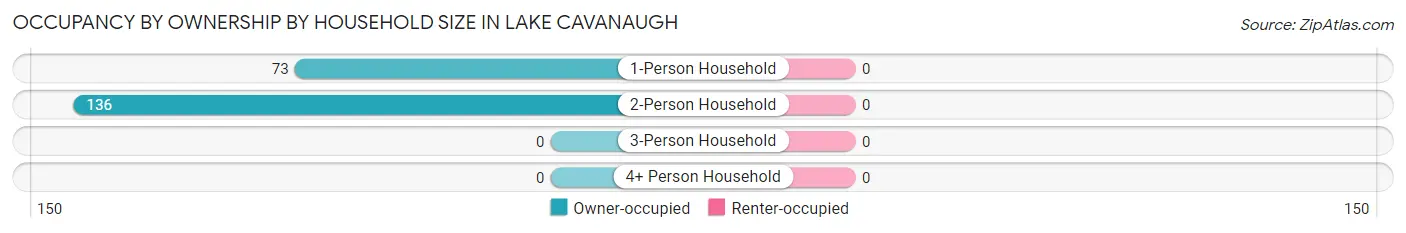
| Household Size | Owner-occupied | Renter-occupied |
| 1-Person Household | 73 (100.0%) | 0 (0.0%) |
| 2-Person Household | 136 (100.0%) | 0 (0.0%) |
| 3-Person Household | 0 (0.0%) | 0 (0.0%) |
| 4+ Person Household | 0 (0.0%) | 0 (0.0%) |
| Total Housing Units | 209 (100.0%) | 0 (0.0%) |
Occupancy by Educational Attainment in Lake Cavanaugh
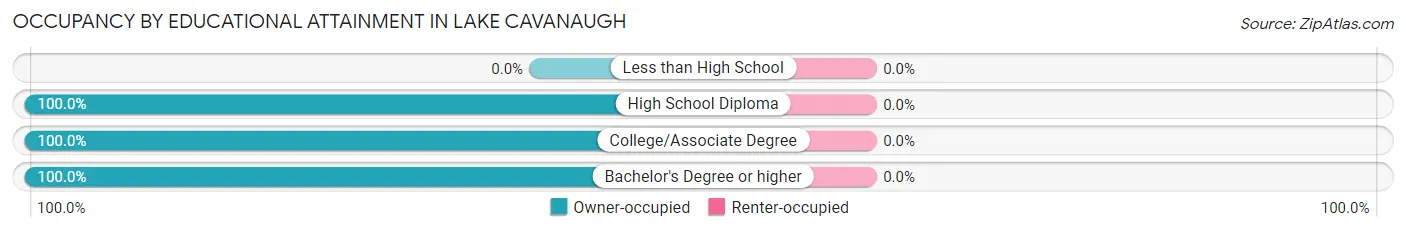
| Household Size | Owner-occupied | Renter-occupied |
| Less than High School | 0 (0.0%) | 0 (0.0%) |
| High School Diploma | 22 (100.0%) | 0 (0.0%) |
| College/Associate Degree | 61 (100.0%) | 0 (0.0%) |
| Bachelor's Degree or higher | 126 (100.0%) | 0 (0.0%) |
Occupancy by Age of Householder in Lake Cavanaugh
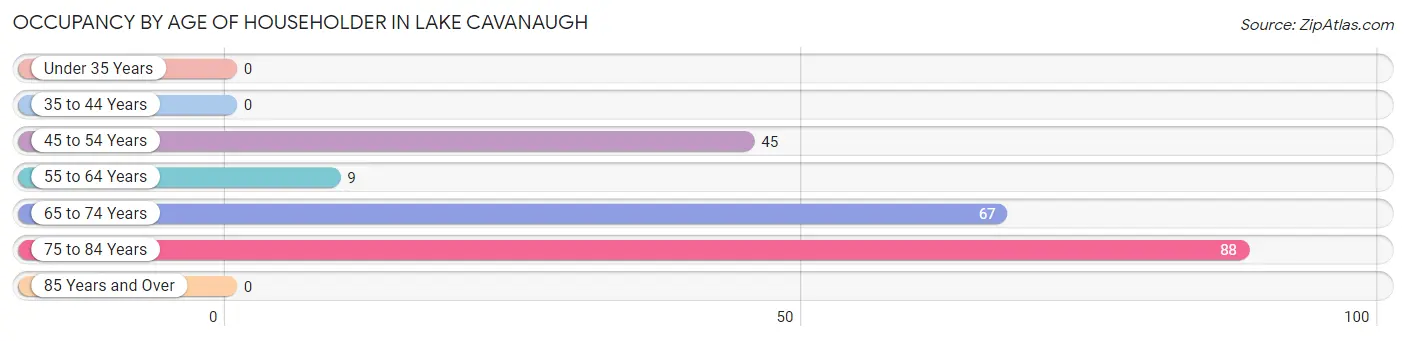
| Age Bracket | # Households | % Households |
| Under 35 Years | 0 | 0.0% |
| 35 to 44 Years | 0 | 0.0% |
| 45 to 54 Years | 45 | 21.5% |
| 55 to 64 Years | 9 | 4.3% |
| 65 to 74 Years | 67 | 32.1% |
| 75 to 84 Years | 88 | 42.1% |
| 85 Years and Over | 0 | 0.0% |
| Total | 209 | 100.0% |
Housing Finances in Lake Cavanaugh
Median Income by Occupancy in Lake Cavanaugh
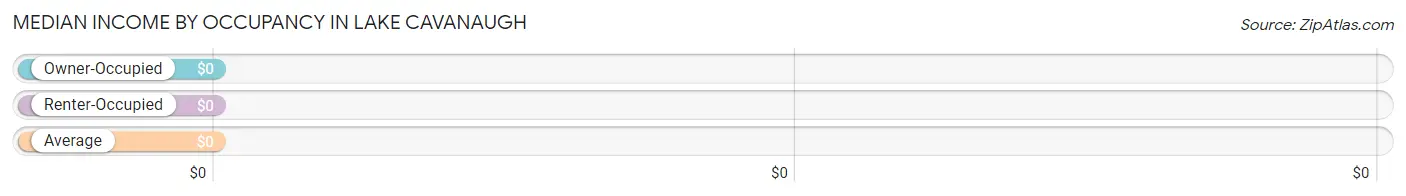
| Occupancy Type | # Households | Median Income |
| Owner-Occupied | 209 (100.0%) | $0 |
| Renter-Occupied | 0 (0.0%) | $0 |
| Average | 209 (100.0%) | $0 |
Occupancy by Householder Income Bracket in Lake Cavanaugh
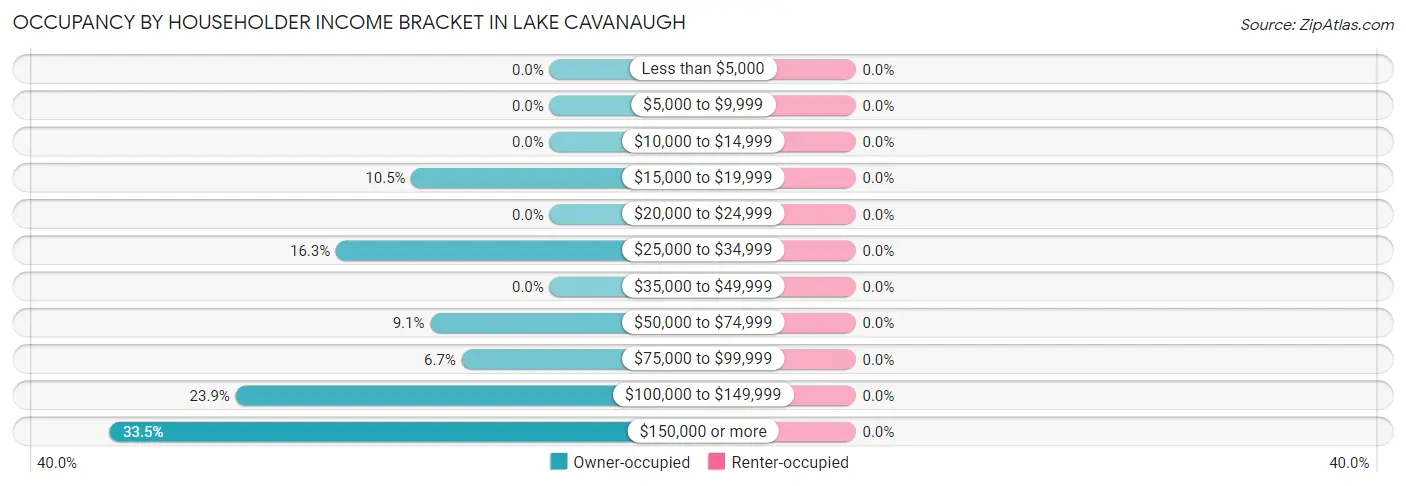
| Income Bracket | Owner-occupied | Renter-occupied |
| Less than $5,000 | 0 (0.0%) | 0 (0.0%) |
| $5,000 to $9,999 | 0 (0.0%) | 0 (0.0%) |
| $10,000 to $14,999 | 0 (0.0%) | 0 (0.0%) |
| $15,000 to $19,999 | 22 (10.5%) | 0 (0.0%) |
| $20,000 to $24,999 | 0 (0.0%) | 0 (0.0%) |
| $25,000 to $34,999 | 34 (16.3%) | 0 (0.0%) |
| $35,000 to $49,999 | 0 (0.0%) | 0 (0.0%) |
| $50,000 to $74,999 | 19 (9.1%) | 0 (0.0%) |
| $75,000 to $99,999 | 14 (6.7%) | 0 (0.0%) |
| $100,000 to $149,999 | 50 (23.9%) | 0 (0.0%) |
| $150,000 or more | 70 (33.5%) | 0 (0.0%) |
| Total | 209 (100.0%) | 0 (0.0%) |
Monthly Housing Cost Tiers in Lake Cavanaugh
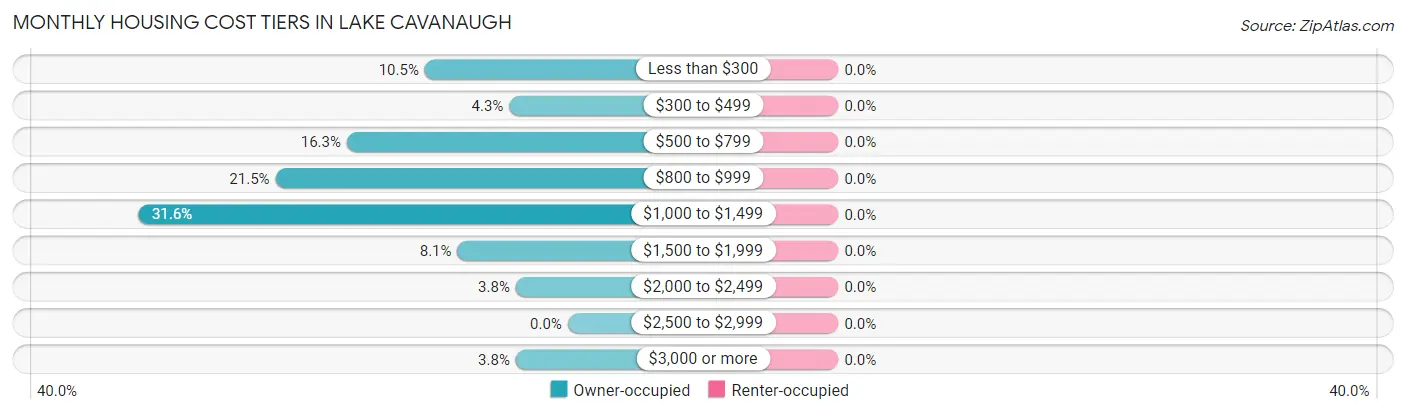
| Monthly Cost | Owner-occupied | Renter-occupied |
| Less than $300 | 22 (10.5%) | 0 (0.0%) |
| $300 to $499 | 9 (4.3%) | 0 (0.0%) |
| $500 to $799 | 34 (16.3%) | 0 (0.0%) |
| $800 to $999 | 45 (21.5%) | 0 (0.0%) |
| $1,000 to $1,499 | 66 (31.6%) | 0 (0.0%) |
| $1,500 to $1,999 | 17 (8.1%) | 0 (0.0%) |
| $2,000 to $2,499 | 8 (3.8%) | 0 (0.0%) |
| $2,500 to $2,999 | 0 (0.0%) | 0 (0.0%) |
| $3,000 or more | 8 (3.8%) | 0 (0.0%) |
| Total | 209 (100.0%) | 0 (0.0%) |
Physical Housing Characteristics in Lake Cavanaugh
Housing Structures in Lake Cavanaugh
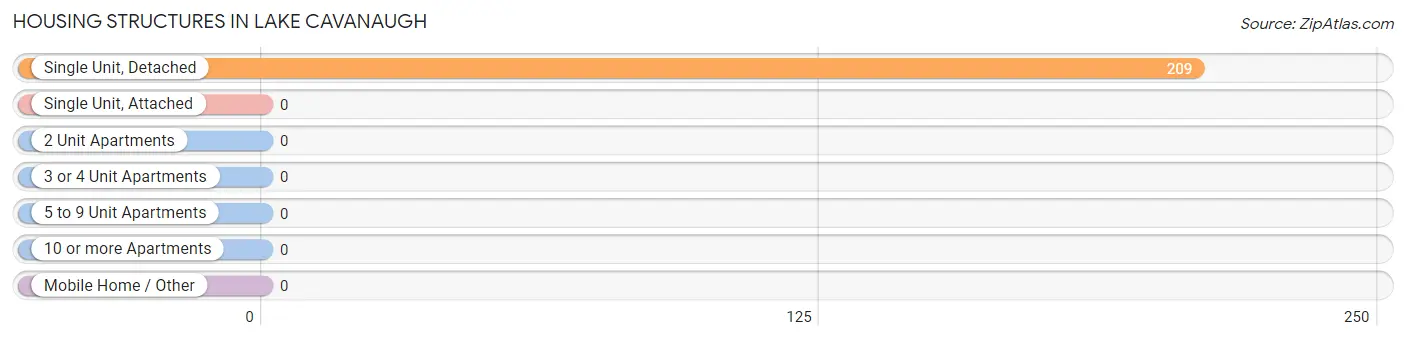
| Structure Type | # Housing Units | % Housing Units |
| Single Unit, Detached | 209 | 100.0% |
| Single Unit, Attached | 0 | 0.0% |
| 2 Unit Apartments | 0 | 0.0% |
| 3 or 4 Unit Apartments | 0 | 0.0% |
| 5 to 9 Unit Apartments | 0 | 0.0% |
| 10 or more Apartments | 0 | 0.0% |
| Mobile Home / Other | 0 | 0.0% |
| Total | 209 | 100.0% |
Housing Structures by Occupancy in Lake Cavanaugh
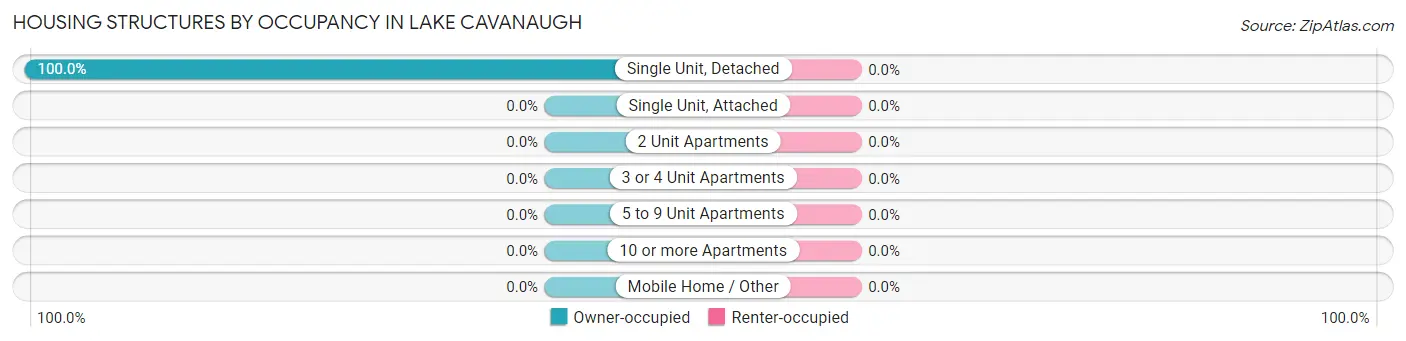
| Structure Type | Owner-occupied | Renter-occupied |
| Single Unit, Detached | 209 (100.0%) | 0 (0.0%) |
| Single Unit, Attached | 0 (0.0%) | 0 (0.0%) |
| 2 Unit Apartments | 0 (0.0%) | 0 (0.0%) |
| 3 or 4 Unit Apartments | 0 (0.0%) | 0 (0.0%) |
| 5 to 9 Unit Apartments | 0 (0.0%) | 0 (0.0%) |
| 10 or more Apartments | 0 (0.0%) | 0 (0.0%) |
| Mobile Home / Other | 0 (0.0%) | 0 (0.0%) |
| Total | 209 (100.0%) | 0 (0.0%) |
Housing Structures by Number of Rooms in Lake Cavanaugh
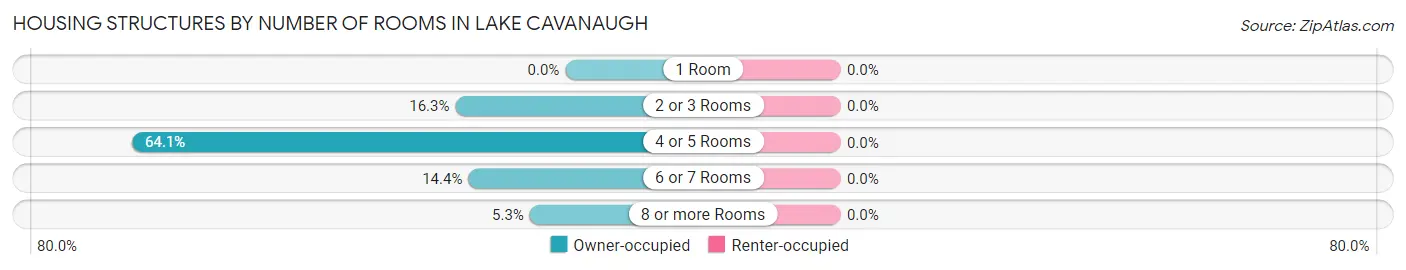
| Number of Rooms | Owner-occupied | Renter-occupied |
| 1 Room | 0 (0.0%) | 0 (0.0%) |
| 2 or 3 Rooms | 34 (16.3%) | 0 (0.0%) |
| 4 or 5 Rooms | 134 (64.1%) | 0 (0.0%) |
| 6 or 7 Rooms | 30 (14.3%) | 0 (0.0%) |
| 8 or more Rooms | 11 (5.3%) | 0 (0.0%) |
| Total | 209 (100.0%) | 0 (0.0%) |
Housing Structure by Heating Type in Lake Cavanaugh
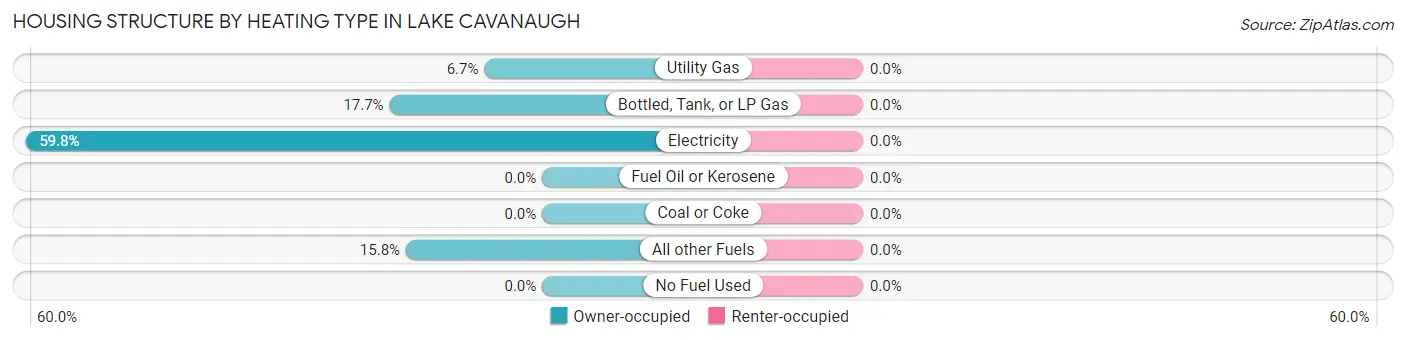
| Heating Type | Owner-occupied | Renter-occupied |
| Utility Gas | 14 (6.7%) | 0 (0.0%) |
| Bottled, Tank, or LP Gas | 37 (17.7%) | 0 (0.0%) |
| Electricity | 125 (59.8%) | 0 (0.0%) |
| Fuel Oil or Kerosene | 0 (0.0%) | 0 (0.0%) |
| Coal or Coke | 0 (0.0%) | 0 (0.0%) |
| All other Fuels | 33 (15.8%) | 0 (0.0%) |
| No Fuel Used | 0 (0.0%) | 0 (0.0%) |
| Total | 209 (100.0%) | 0 (0.0%) |
Household Vehicle Usage in Lake Cavanaugh
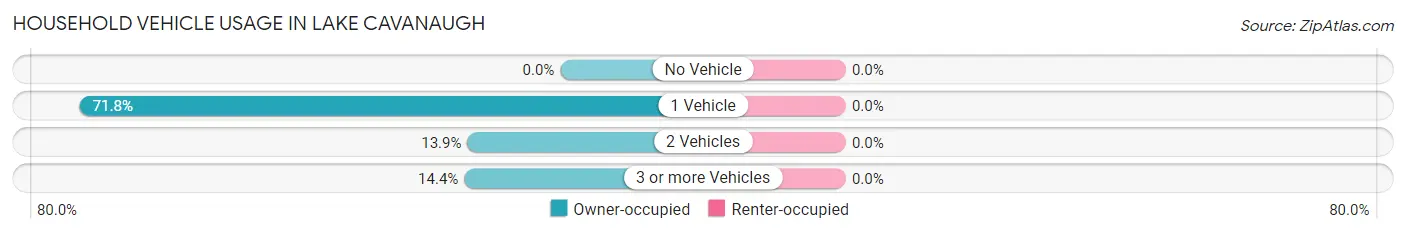
| Vehicles per Household | Owner-occupied | Renter-occupied |
| No Vehicle | 0 (0.0%) | 0 (0.0%) |
| 1 Vehicle | 150 (71.8%) | 0 (0.0%) |
| 2 Vehicles | 29 (13.9%) | 0 (0.0%) |
| 3 or more Vehicles | 30 (14.3%) | 0 (0.0%) |
| Total | 209 (100.0%) | 0 (0.0%) |
Real Estate & Mortgages in Lake Cavanaugh
Real Estate and Mortgage Overview in Lake Cavanaugh
| Characteristic | Without Mortgage | With Mortgage |
| Housing Units | 97 | 112 |
| Median Property Value | $483,300 | $588,700 |
| Median Household Income | $100,179 | $61 |
| Monthly Housing Costs | $839 | $8 |
| Real Estate Taxes | $4,833 | $0 |
Property Value by Mortgage Status in Lake Cavanaugh
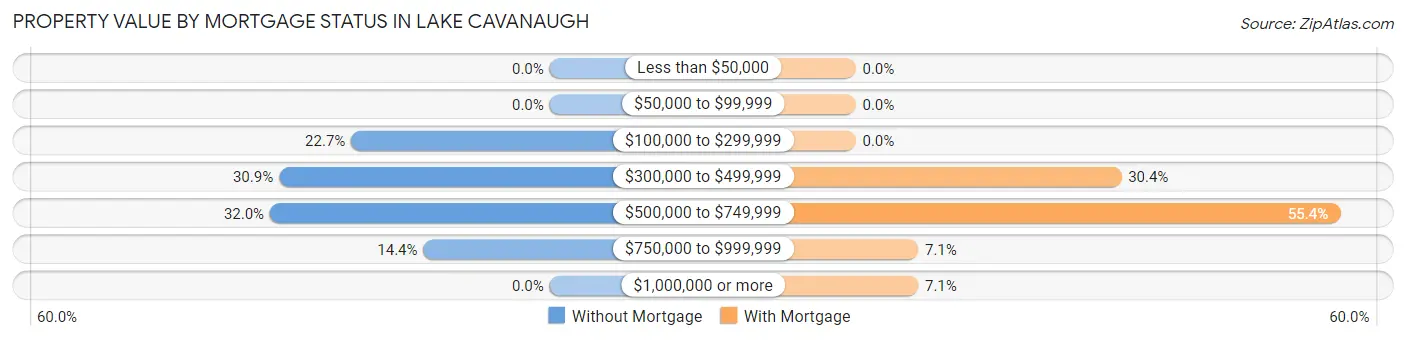
| Property Value | Without Mortgage | With Mortgage |
| Less than $50,000 | 0 (0.0%) | 0 (0.0%) |
| $50,000 to $99,999 | 0 (0.0%) | 0 (0.0%) |
| $100,000 to $299,999 | 22 (22.7%) | 0 (0.0%) |
| $300,000 to $499,999 | 30 (30.9%) | 34 (30.4%) |
| $500,000 to $749,999 | 31 (32.0%) | 62 (55.4%) |
| $750,000 to $999,999 | 14 (14.4%) | 8 (7.1%) |
| $1,000,000 or more | 0 (0.0%) | 8 (7.1%) |
| Total | 97 (100.0%) | 112 (100.0%) |
Household Income by Mortgage Status in Lake Cavanaugh
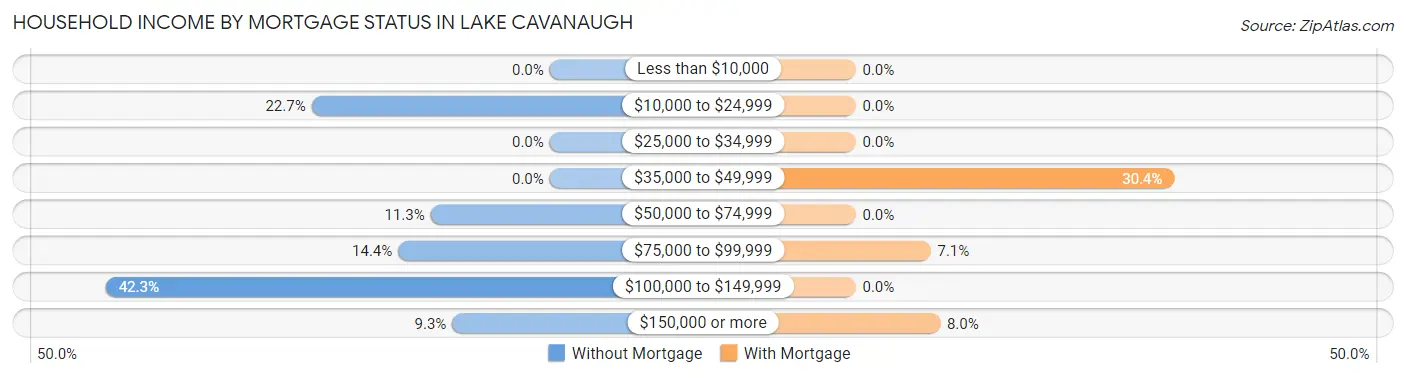
| Household Income | Without Mortgage | With Mortgage |
| Less than $10,000 | 0 (0.0%) | 0 (0.0%) |
| $10,000 to $24,999 | 22 (22.7%) | 0 (0.0%) |
| $25,000 to $34,999 | 0 (0.0%) | 0 (0.0%) |
| $35,000 to $49,999 | 0 (0.0%) | 34 (30.4%) |
| $50,000 to $74,999 | 11 (11.3%) | 0 (0.0%) |
| $75,000 to $99,999 | 14 (14.4%) | 8 (7.1%) |
| $100,000 to $149,999 | 41 (42.3%) | 0 (0.0%) |
| $150,000 or more | 9 (9.3%) | 9 (8.0%) |
| Total | 97 (100.0%) | 112 (100.0%) |
Property Value to Household Income Ratio in Lake Cavanaugh
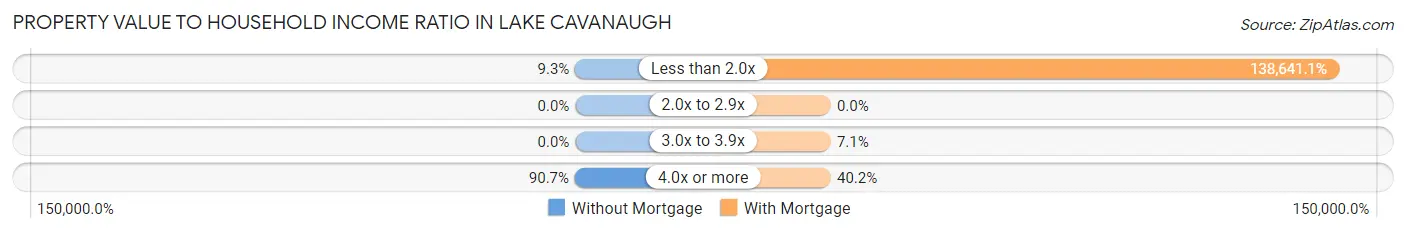
| Value-to-Income Ratio | Without Mortgage | With Mortgage |
| Less than 2.0x | 9 (9.3%) | 155,278 (138,641.1%) |
| 2.0x to 2.9x | 0 (0.0%) | 0 (0.0%) |
| 3.0x to 3.9x | 0 (0.0%) | 8 (7.1%) |
| 4.0x or more | 88 (90.7%) | 45 (40.2%) |
| Total | 97 (100.0%) | 112 (100.0%) |
Real Estate Taxes by Mortgage Status in Lake Cavanaugh
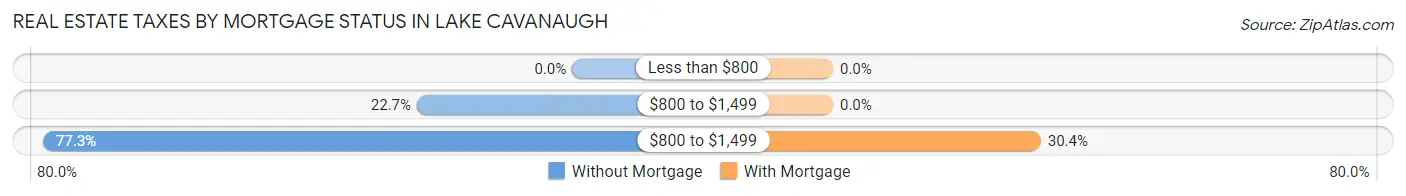
| Property Taxes | Without Mortgage | With Mortgage |
| Less than $800 | 0 (0.0%) | 0 (0.0%) |
| $800 to $1,499 | 22 (22.7%) | 0 (0.0%) |
| $800 to $1,499 | 75 (77.3%) | 34 (30.4%) |
| Total | 97 (100.0%) | 112 (100.0%) |
Health & Disability in Lake Cavanaugh
Health Insurance Coverage by Age in Lake Cavanaugh
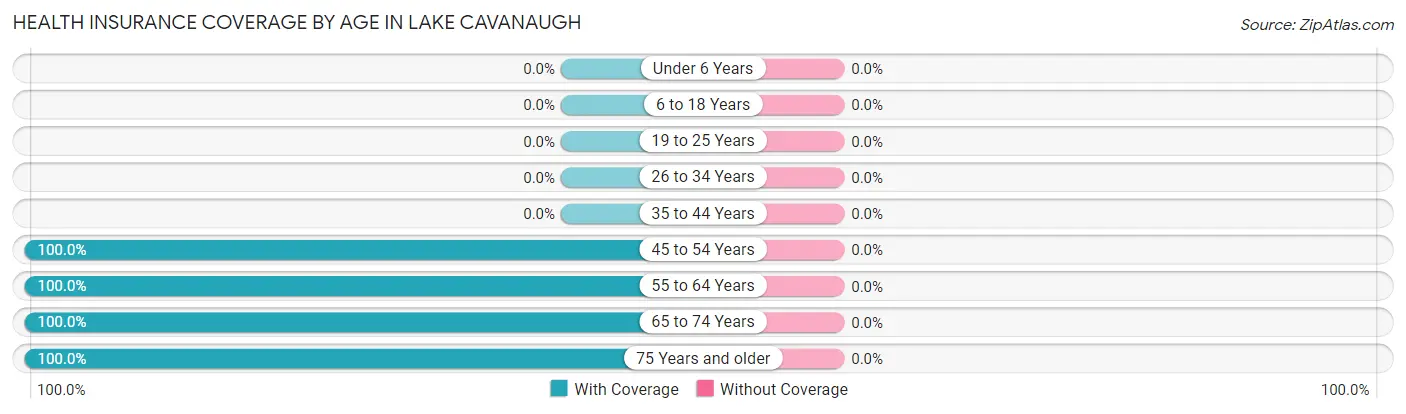
| Age Bracket | With Coverage | Without Coverage |
| Under 6 Years | 0 (0.0%) | 0 (0.0%) |
| 6 to 18 Years | 0 (0.0%) | 0 (0.0%) |
| 19 to 25 Years | 0 (0.0%) | 0 (0.0%) |
| 26 to 34 Years | 0 (0.0%) | 0 (0.0%) |
| 35 to 44 Years | 0 (0.0%) | 0 (0.0%) |
| 45 to 54 Years | 86 (100.0%) | 0 (0.0%) |
| 55 to 64 Years | 9 (100.0%) | 0 (0.0%) |
| 65 to 74 Years | 83 (100.0%) | 0 (0.0%) |
| 75 Years and older | 163 (100.0%) | 0 (0.0%) |
| Total | 341 (100.0%) | 0 (0.0%) |
Health Insurance Coverage by Citizenship Status in Lake Cavanaugh
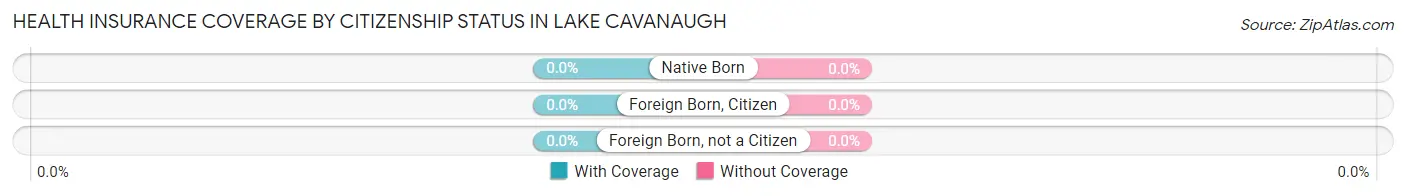
| Citizenship Status | With Coverage | Without Coverage |
| Native Born | 0 (0.0%) | 0 (0.0%) |
| Foreign Born, Citizen | 0 (0.0%) | 0 (0.0%) |
| Foreign Born, not a Citizen | 0 (0.0%) | 0 (0.0%) |
Health Insurance Coverage by Household Income in Lake Cavanaugh
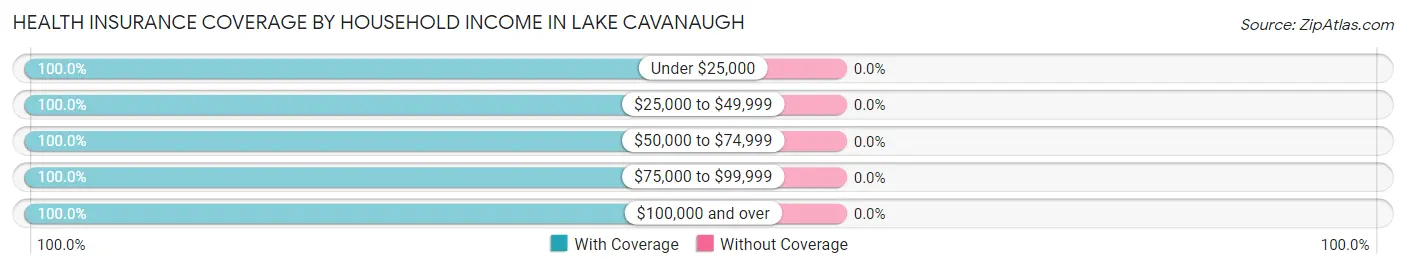
| Household Income | With Coverage | Without Coverage |
| Under $25,000 | 22 (100.0%) | 0 (0.0%) |
| $25,000 to $49,999 | 34 (100.0%) | 0 (0.0%) |
| $50,000 to $74,999 | 31 (100.0%) | 0 (0.0%) |
| $75,000 to $99,999 | 27 (100.0%) | 0 (0.0%) |
| $100,000 and over | 227 (100.0%) | 0 (0.0%) |
Public vs Private Health Insurance Coverage by Age in Lake Cavanaugh
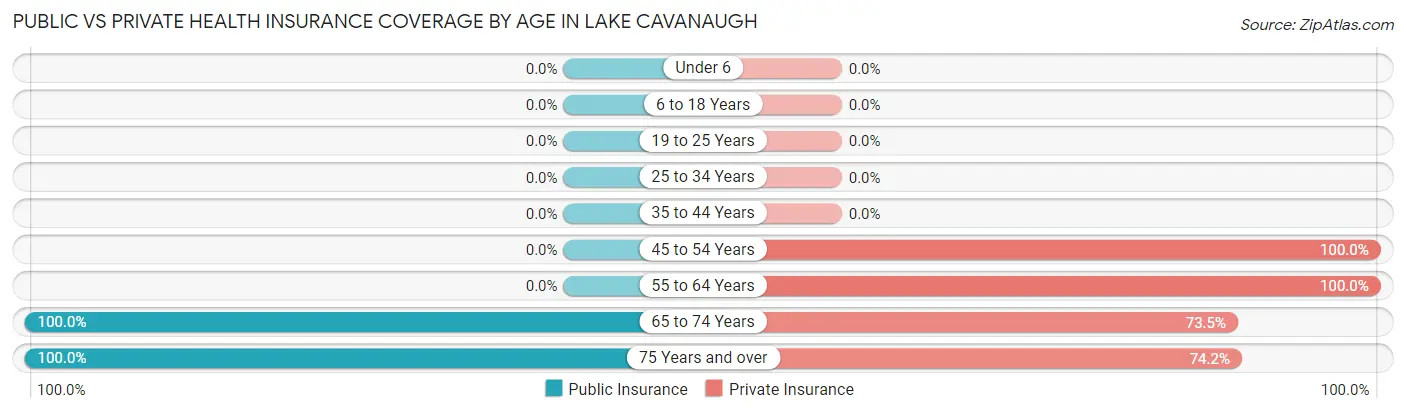
| Age Bracket | Public Insurance | Private Insurance |
| Under 6 | 0 (0.0%) | 0 (0.0%) |
| 6 to 18 Years | 0 (0.0%) | 0 (0.0%) |
| 19 to 25 Years | 0 (0.0%) | 0 (0.0%) |
| 25 to 34 Years | 0 (0.0%) | 0 (0.0%) |
| 35 to 44 Years | 0 (0.0%) | 0 (0.0%) |
| 45 to 54 Years | 0 (0.0%) | 86 (100.0%) |
| 55 to 64 Years | 0 (0.0%) | 9 (100.0%) |
| 65 to 74 Years | 83 (100.0%) | 61 (73.5%) |
| 75 Years and over | 163 (100.0%) | 121 (74.2%) |
| Total | 246 (72.1%) | 277 (81.2%) |
Disability Status by Sex by Age in Lake Cavanaugh
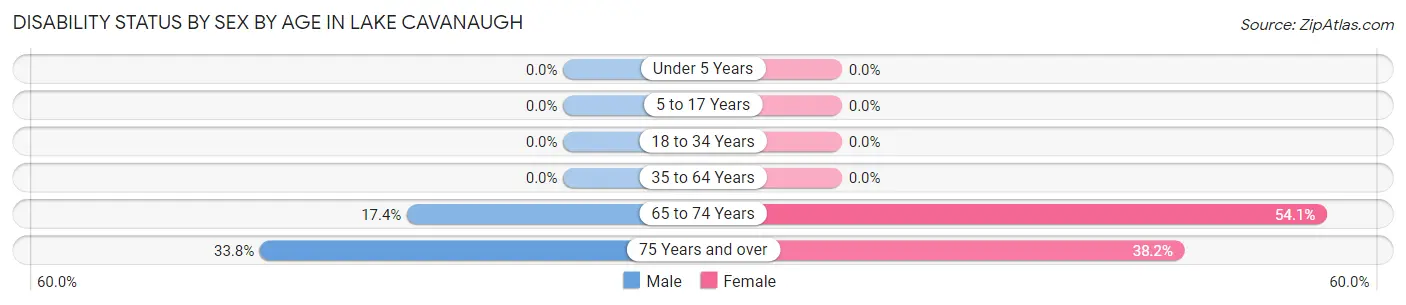
| Age Bracket | Male | Female |
| Under 5 Years | 0 (0.0%) | 0 (0.0%) |
| 5 to 17 Years | 0 (0.0%) | 0 (0.0%) |
| 18 to 34 Years | 0 (0.0%) | 0 (0.0%) |
| 35 to 64 Years | 0 (0.0%) | 0 (0.0%) |
| 65 to 74 Years | 8 (17.4%) | 20 (54.0%) |
| 75 Years and over | 25 (33.8%) | 34 (38.2%) |
Disability Class by Sex by Age in Lake Cavanaugh
Disability Class: Hearing Difficulty
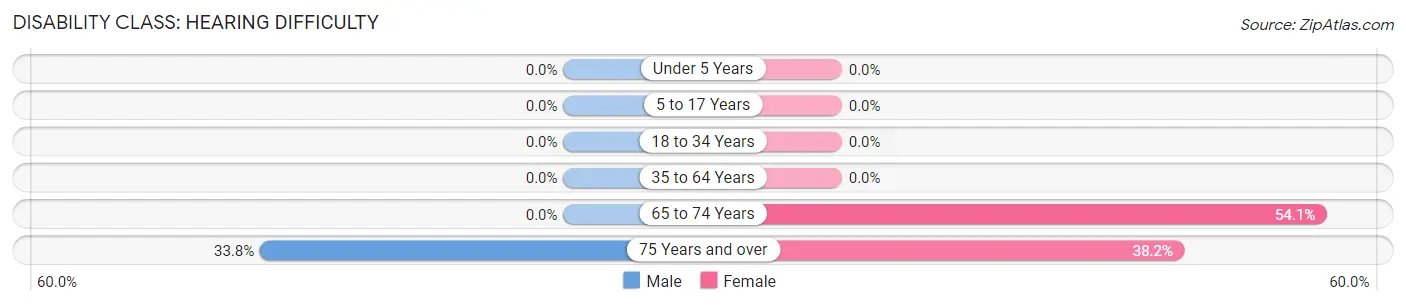
| Age Bracket | Male | Female |
| Under 5 Years | 0 (0.0%) | 0 (0.0%) |
| 5 to 17 Years | 0 (0.0%) | 0 (0.0%) |
| 18 to 34 Years | 0 (0.0%) | 0 (0.0%) |
| 35 to 64 Years | 0 (0.0%) | 0 (0.0%) |
| 65 to 74 Years | 0 (0.0%) | 20 (54.0%) |
| 75 Years and over | 25 (33.8%) | 34 (38.2%) |
Disability Class: Vision Difficulty
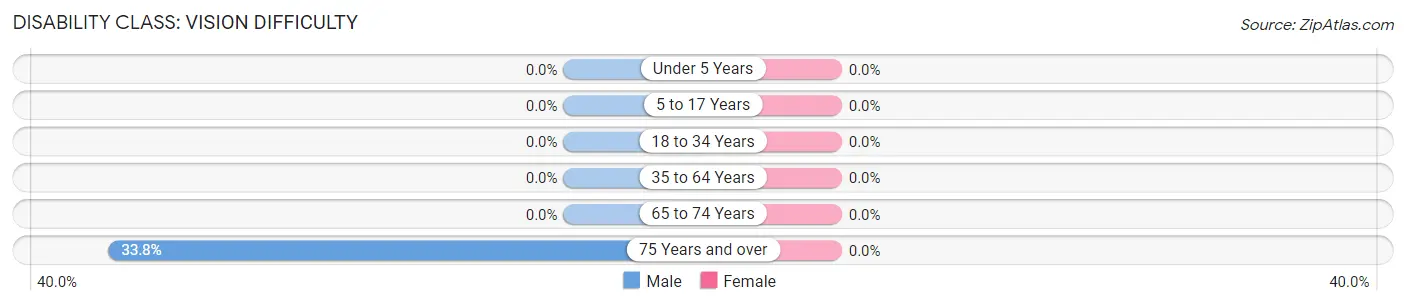
| Age Bracket | Male | Female |
| Under 5 Years | 0 (0.0%) | 0 (0.0%) |
| 5 to 17 Years | 0 (0.0%) | 0 (0.0%) |
| 18 to 34 Years | 0 (0.0%) | 0 (0.0%) |
| 35 to 64 Years | 0 (0.0%) | 0 (0.0%) |
| 65 to 74 Years | 0 (0.0%) | 0 (0.0%) |
| 75 Years and over | 25 (33.8%) | 0 (0.0%) |
Disability Class: Cognitive Difficulty
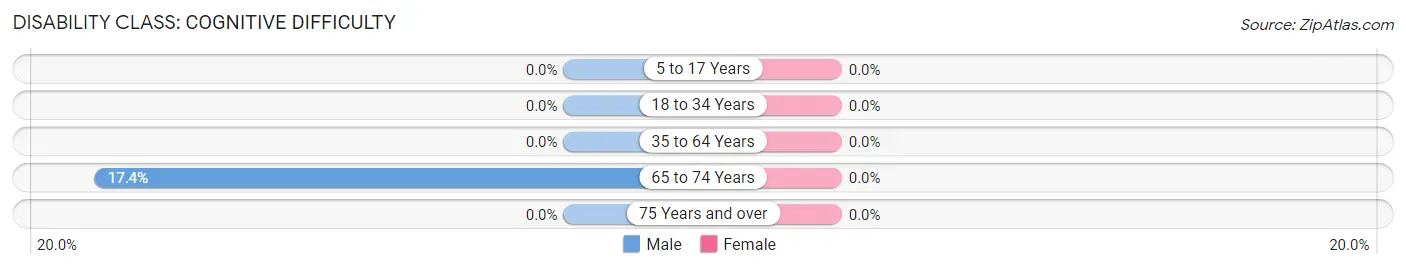
| Age Bracket | Male | Female |
| 5 to 17 Years | 0 (0.0%) | 0 (0.0%) |
| 18 to 34 Years | 0 (0.0%) | 0 (0.0%) |
| 35 to 64 Years | 0 (0.0%) | 0 (0.0%) |
| 65 to 74 Years | 8 (17.4%) | 0 (0.0%) |
| 75 Years and over | 0 (0.0%) | 0 (0.0%) |
Disability Class: Ambulatory Difficulty
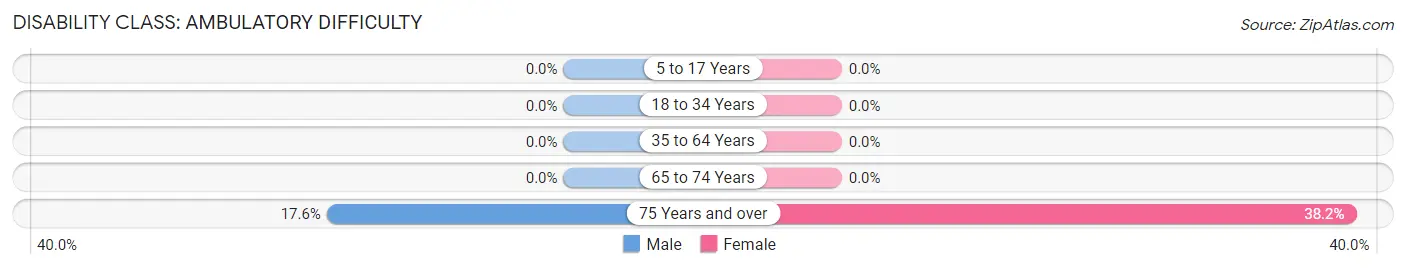
| Age Bracket | Male | Female |
| 5 to 17 Years | 0 (0.0%) | 0 (0.0%) |
| 18 to 34 Years | 0 (0.0%) | 0 (0.0%) |
| 35 to 64 Years | 0 (0.0%) | 0 (0.0%) |
| 65 to 74 Years | 0 (0.0%) | 0 (0.0%) |
| 75 Years and over | 13 (17.6%) | 34 (38.2%) |
Disability Class: Self-Care Difficulty
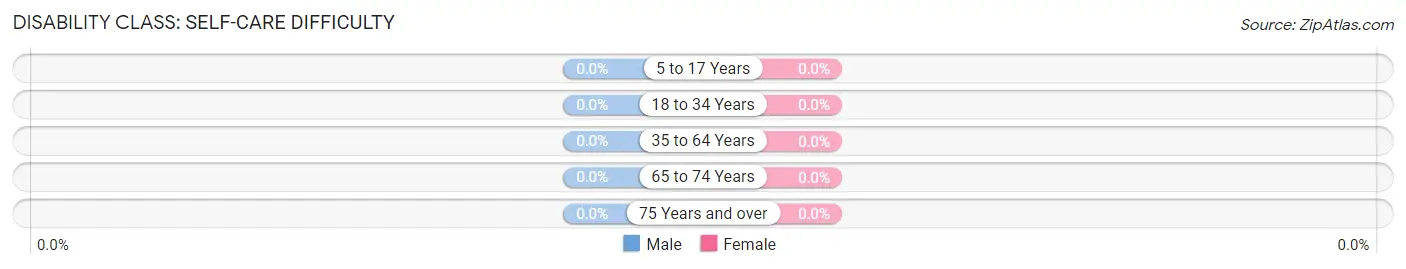
| Age Bracket | Male | Female |
| 5 to 17 Years | 0 (0.0%) | 0 (0.0%) |
| 18 to 34 Years | 0 (0.0%) | 0 (0.0%) |
| 35 to 64 Years | 0 (0.0%) | 0 (0.0%) |
| 65 to 74 Years | 0 (0.0%) | 0 (0.0%) |
| 75 Years and over | 0 (0.0%) | 0 (0.0%) |
Technology Access in Lake Cavanaugh
Computing Device Access in Lake Cavanaugh
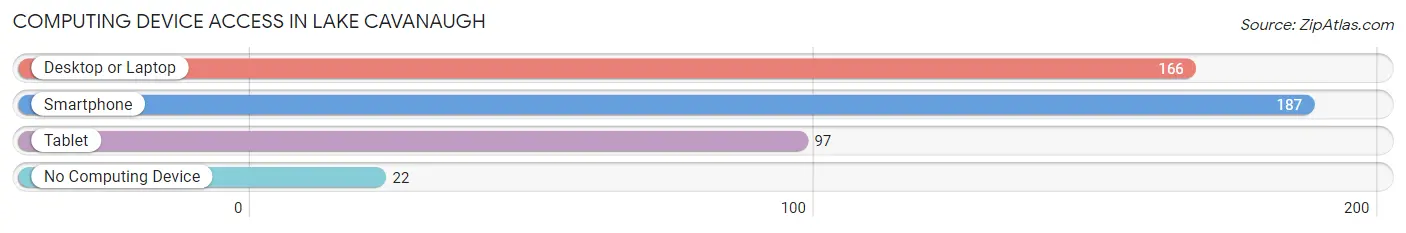
| Device Type | # Households | % Households |
| Desktop or Laptop | 166 | 79.4% |
| Smartphone | 187 | 89.5% |
| Tablet | 97 | 46.4% |
| No Computing Device | 22 | 10.5% |
| Total | 209 | 100.0% |
Internet Access in Lake Cavanaugh
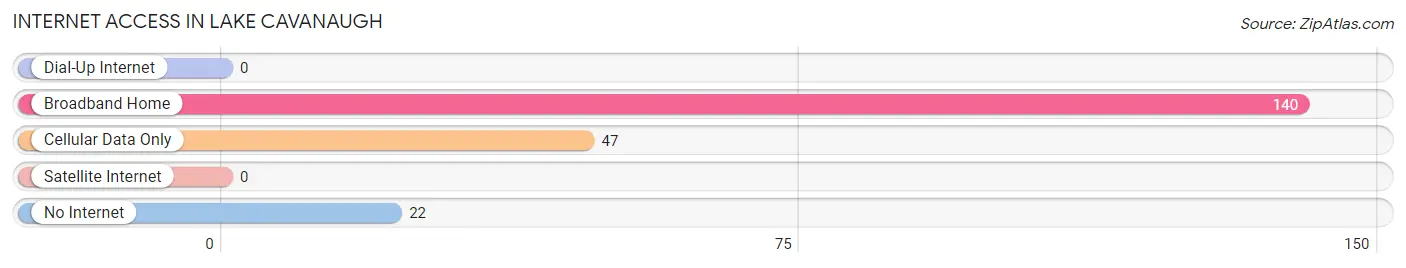
| Internet Type | # Households | % Households |
| Dial-Up Internet | 0 | 0.0% |
| Broadband Home | 140 | 67.0% |
| Cellular Data Only | 47 | 22.5% |
| Satellite Internet | 0 | 0.0% |
| No Internet | 22 | 10.5% |
| Total | 209 | 100.0% |
Lake Cavanaugh Summary
Lake Cavanaugh is a small unincorporated community located in the foothills of the Cascade Mountains in Snohomish County, Washington. It is situated on the south shore of Lake Cavanaugh, a lake that was created by a dam in the early 1900s. The community is located approximately 25 miles northeast of Seattle and is part of the Seattle metropolitan area.
History
The area around Lake Cavanaugh was first settled in the late 1800s by homesteaders and loggers. The lake was created in the early 1900s when a dam was built on the Stillaguamish River. The lake was named after the Cavanaugh family, who were among the first settlers in the area.
In the early 1900s, the area around Lake Cavanaugh was a popular destination for fishing and camping. The lake was stocked with trout and other fish, and the surrounding forests provided ample hunting opportunities. In the 1920s, the area began to attract more visitors, and a number of resorts and cabins were built around the lake.
In the 1950s, the area around Lake Cavanaugh began to experience rapid growth as Seattle's population expanded. The lake became a popular destination for weekend getaways and summer vacations. In the 1960s, the area around the lake was developed into a residential community.
Geography
Lake Cavanaugh is located in the foothills of the Cascade Mountains in Snohomish County, Washington. The lake is approximately 25 miles northeast of Seattle and is part of the Seattle metropolitan area. The lake is surrounded by the Cascade foothills and is fed by the Stillaguamish River. The lake is approximately 1,200 acres in size and has a maximum depth of approximately 60 feet.
The area around Lake Cavanaugh is mostly rural, with a few small towns and villages scattered throughout the area. The nearest major city is Everett, which is approximately 20 miles to the west.
Economy
The economy of Lake Cavanaugh is largely based on tourism and recreation. The lake is a popular destination for fishing, boating, and other outdoor activities. There are several resorts and cabins located around the lake, as well as a number of restaurants and other businesses catering to visitors.
The area around Lake Cavanaugh is also home to a number of small businesses, including a few wineries and a brewery. The area is also home to a number of farms and ranches, which produce a variety of crops and livestock.
Demographics
As of the 2010 census, the population of Lake Cavanaugh was 1,845. The population is predominantly white (94.3%), with small percentages of other races. The median household income is $60,000, and the median home value is $250,000.
The majority of the population is employed in the service industry (37.3%), followed by retail (17.2%) and construction (14.2%). The unemployment rate is 4.2%, which is lower than the national average.
Conclusion
Lake Cavanaugh is a small unincorporated community located in the foothills of the Cascade Mountains in Snohomish County, Washington. It is situated on the south shore of Lake Cavanaugh, a lake that was created by a dam in the early 1900s. The area around Lake Cavanaugh is mostly rural, with a few small towns and villages scattered throughout the area. The economy of Lake Cavanaugh is largely based on tourism and recreation, and the population is predominantly white. The area is a popular destination for fishing, boating, and other outdoor activities, and is home to a number of small businesses, farms, and ranches.
Common Questions
What is Per Capita Income in Lake Cavanaugh?
Per Capita income in Lake Cavanaugh is $67,632.
What is the Median Family Income in Lake Cavanaugh?
Median Family Income in Lake Cavanaugh is $149,125.
What is Inequality or Gini Index in Lake Cavanaugh?
Inequality or Gini Index in Lake Cavanaugh is 0.37.
What is the Total Population of Lake Cavanaugh?
Total Population of Lake Cavanaugh is 341.
What is the Total Male Population of Lake Cavanaugh?
Total Male Population of Lake Cavanaugh is 174.
What is the Total Female Population of Lake Cavanaugh?
Total Female Population of Lake Cavanaugh is 167.
What is the Ratio of Males per 100 Females in Lake Cavanaugh?
There are 104.19 Males per 100 Females in Lake Cavanaugh.
What is the Ratio of Females per 100 Males in Lake Cavanaugh?
There are 95.98 Females per 100 Males in Lake Cavanaugh.
What is the Median Population Age in Lake Cavanaugh?
Median Population Age in Lake Cavanaugh is 74.7 Years.
What is the Average Family Size in Lake Cavanaugh
Average Family Size in Lake Cavanaugh is 2.0 People.
What is the Average Household Size in Lake Cavanaugh
Average Household Size in Lake Cavanaugh is 1.6 People.
How Large is the Labor Force in Lake Cavanaugh?
There are 54 People in the Labor Forcein in Lake Cavanaugh.
What is the Percentage of People in the Labor Force in Lake Cavanaugh?
15.8% of People are in the Labor Force in Lake Cavanaugh.