Nile, WA Map & Demographics
Nile Map
Nile Overview
$36,913
PER CAPITA INCOME
$131,528
AVG FAMILY INCOME
0.38
INEQUALITY / GINI INDEX
115
TOTAL POPULATION
57
MALE POPULATION
58
FEMALE POPULATION
98.28
MALES / 100 FEMALES
101.75
FEMALES / 100 MALES
35.6
MEDIAN AGE
2.9
AVG FAMILY SIZE
1.7
AVG HOUSEHOLD SIZE
48
LABOR FORCE [ PEOPLE ]
51.1%
PERCENT IN LABOR FORCE
50.0%
UNEMPLOYMENT RATE
Income in Nile
Income Overview in Nile
| Characteristic | Number | Measure |
| Per Capita Income | 115 | $36,913 |
| Median Family Income | 25 | $131,528 |
| Mean Family Income | 25 | $112,380 |
| Median Household Income | 68 | $0 |
| Mean Household Income | 68 | $59,704 |
| Income Deficit | 25 | $0 |
| Wage / Income Gap (%) | 115 | 0.00% |
| Wage / Income Gap ($) | 115 | 100.00¢ per $1 |
| Gini / Inequality Index | 115 | 0.38 |
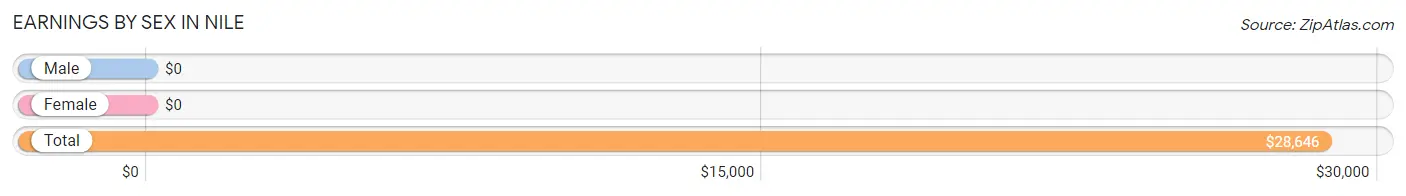
Earnings by Sex in Nile
| Sex | Number | Average Earnings |
| Male | 15 (31.2%) | $0 |
| Female | 33 (68.8%) | $0 |
| Total | 48 (100.0%) | $28,646 |
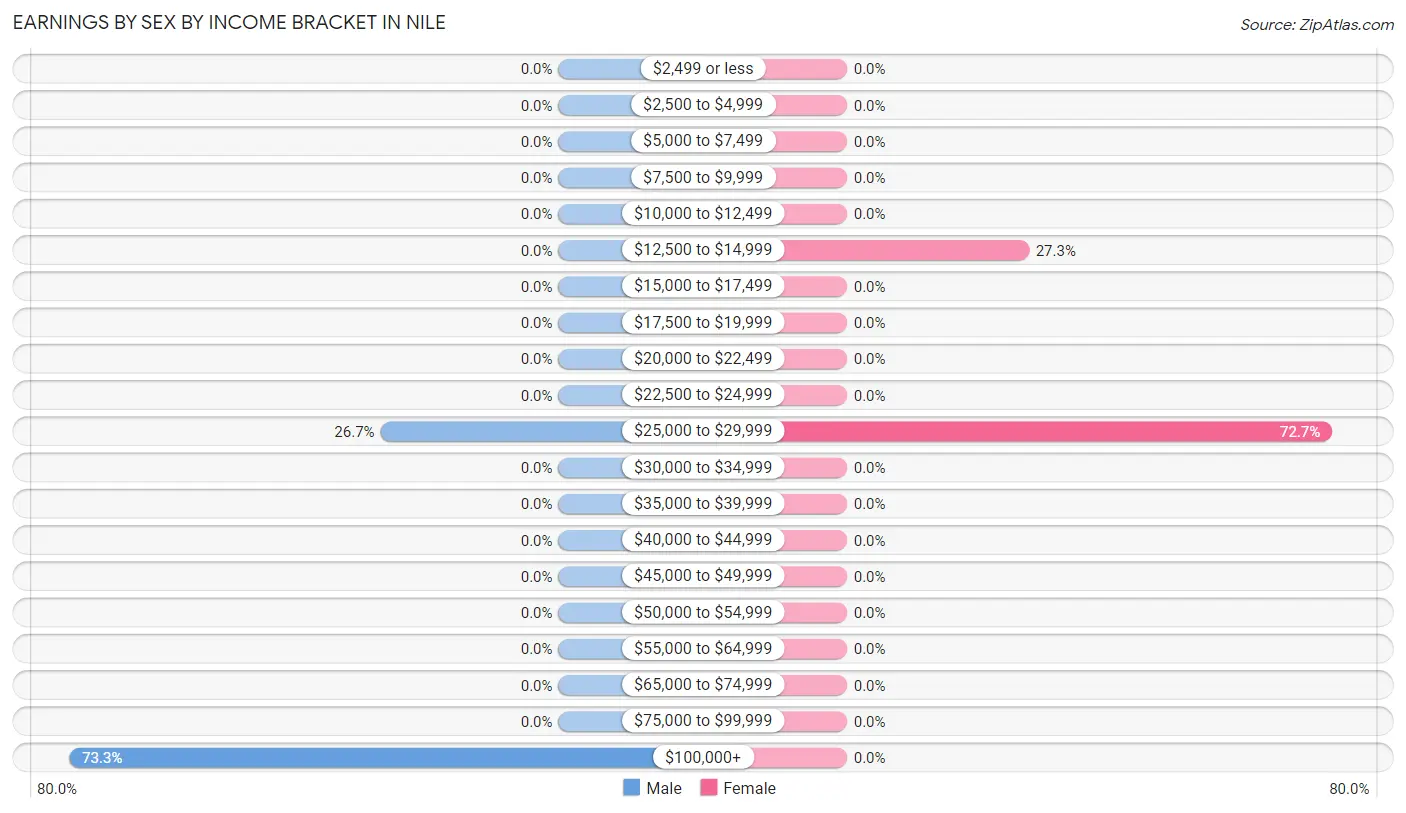
Earnings by Sex by Income Bracket in Nile
The most common earnings brackets in Nile are $100,000+ for men (11 | 73.3%) and $25,000 to $29,999 for women (24 | 72.7%).
| Income | Male | Female |
| $2,499 or less | 0 (0.0%) | 0 (0.0%) |
| $2,500 to $4,999 | 0 (0.0%) | 0 (0.0%) |
| $5,000 to $7,499 | 0 (0.0%) | 0 (0.0%) |
| $7,500 to $9,999 | 0 (0.0%) | 0 (0.0%) |
| $10,000 to $12,499 | 0 (0.0%) | 0 (0.0%) |
| $12,500 to $14,999 | 0 (0.0%) | 9 (27.3%) |
| $15,000 to $17,499 | 0 (0.0%) | 0 (0.0%) |
| $17,500 to $19,999 | 0 (0.0%) | 0 (0.0%) |
| $20,000 to $22,499 | 0 (0.0%) | 0 (0.0%) |
| $22,500 to $24,999 | 0 (0.0%) | 0 (0.0%) |
| $25,000 to $29,999 | 4 (26.7%) | 24 (72.7%) |
| $30,000 to $34,999 | 0 (0.0%) | 0 (0.0%) |
| $35,000 to $39,999 | 0 (0.0%) | 0 (0.0%) |
| $40,000 to $44,999 | 0 (0.0%) | 0 (0.0%) |
| $45,000 to $49,999 | 0 (0.0%) | 0 (0.0%) |
| $50,000 to $54,999 | 0 (0.0%) | 0 (0.0%) |
| $55,000 to $64,999 | 0 (0.0%) | 0 (0.0%) |
| $65,000 to $74,999 | 0 (0.0%) | 0 (0.0%) |
| $75,000 to $99,999 | 0 (0.0%) | 0 (0.0%) |
| $100,000+ | 11 (73.3%) | 0 (0.0%) |
| Total | 15 (100.0%) | 33 (100.0%) |
Earnings by Sex by Educational Attainment in Nile
| Educational Attainment | Male Income | Female Income |
| Less than High School | - | - |
| High School Diploma | - | - |
| College or Associate's Degree | - | - |
| Bachelor's Degree | - | - |
| Graduate Degree | - | - |
| Total | - | - |
Family Income in Nile
Family Income Brackets in Nile
According to the Nile family income data, there are 18 families falling into the $100,000 to $149,999 income range, which is the most common income bracket and makes up 72.0% of all families.
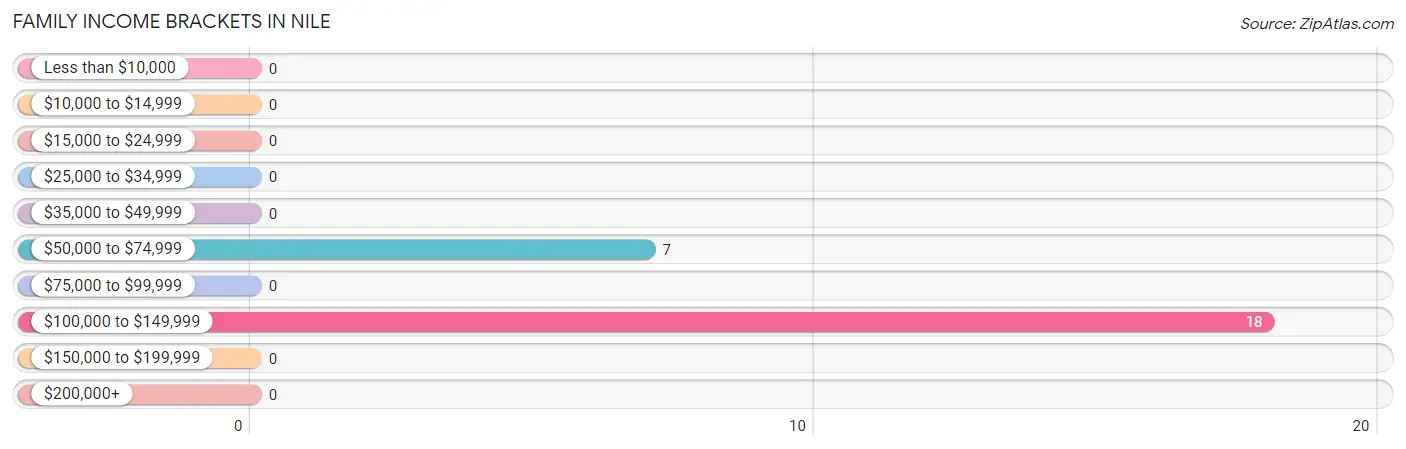
| Income Bracket | # Families | % Families |
| Less than $10,000 | 0 | 0.0% |
| $10,000 to $14,999 | 0 | 0.0% |
| $15,000 to $24,999 | 0 | 0.0% |
| $25,000 to $34,999 | 0 | 0.0% |
| $35,000 to $49,999 | 0 | 0.0% |
| $50,000 to $74,999 | 7 | 28.0% |
| $75,000 to $99,999 | 0 | 0.0% |
| $100,000 to $149,999 | 18 | 72.0% |
| $150,000 to $199,999 | 0 | 0.0% |
| $200,000+ | 0 | 0.0% |
Family Income by Famaliy Size in Nile
| Income Bracket | # Families | Median Income |
| 2-Person Families | 16 (64.0%) | $0 |
| 3-Person Families | 0 (0.0%) | $0 |
| 4-Person Families | 9 (36.0%) | $0 |
| 5-Person Families | 0 (0.0%) | $0 |
| 6-Person Families | 0 (0.0%) | $0 |
| 7+ Person Families | 0 (0.0%) | $0 |
| Total | 25 (100.0%) | $131,528 |
Family Income by Number of Earners in Nile
| Number of Earners | # Families | Median Income |
| No Earners | 16 (64.0%) | $0 |
| 1 Earner | 0 (0.0%) | $0 |
| 2 Earners | 9 (36.0%) | $0 |
| 3+ Earners | 0 (0.0%) | $0 |
| Total | 25 (100.0%) | $131,528 |
Household Income in Nile
Household Income Brackets in Nile
With 28 households falling in the category, the $25,000 to $34,999 income range is the most frequent in Nile, accounting for 41.2% of all households.
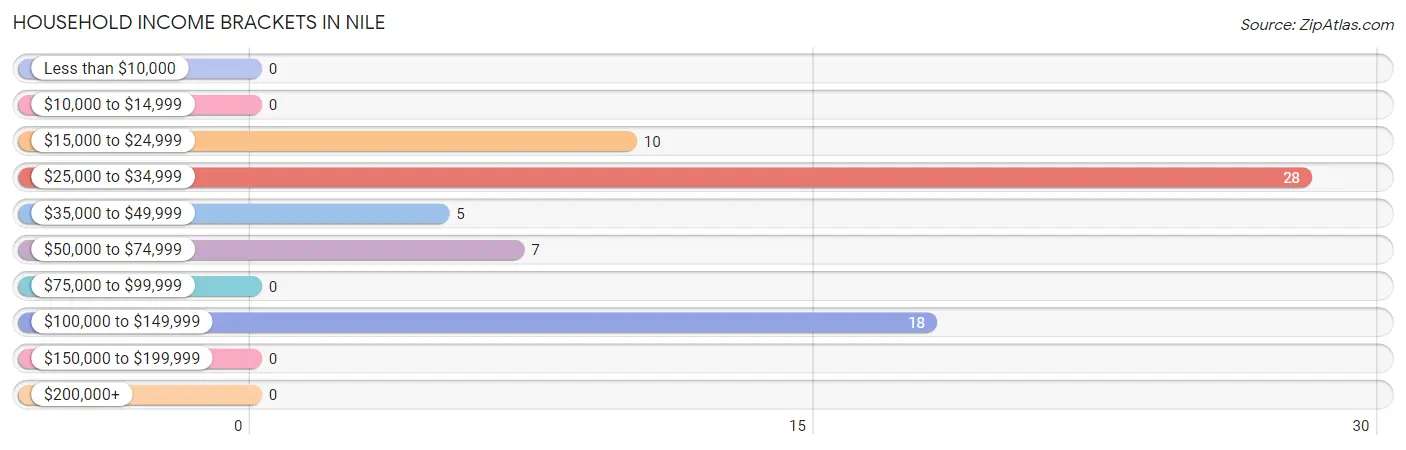
| Income Bracket | # Households | % Households |
| Less than $10,000 | 0 | 0.0% |
| $10,000 to $14,999 | 0 | 0.0% |
| $15,000 to $24,999 | 10 | 14.7% |
| $25,000 to $34,999 | 28 | 41.2% |
| $35,000 to $49,999 | 5 | 7.4% |
| $50,000 to $74,999 | 7 | 10.3% |
| $75,000 to $99,999 | 0 | 0.0% |
| $100,000 to $149,999 | 18 | 26.5% |
| $150,000 to $199,999 | 0 | 0.0% |
| $200,000+ | 0 | 0.0% |
Household Income by Householder Age in Nile
| Income Bracket | # Households | Median Income |
| 15 to 24 Years | 0 (0.0%) | $0 |
| 25 to 44 Years | 33 (48.5%) | $0 |
| 45 to 64 Years | 18 (26.5%) | $0 |
| 65+ Years | 17 (25.0%) | $0 |
| Total | 68 (100.0%) | $0 |
Poverty in Nile
Income Below Poverty by Sex and Age in Nile
| Age Bracket | Male | Female |
| Under 5 Years | 0 (0.0%) | 0 (0.0%) |
| 5 Years | 0 (0.0%) | 0 (0.0%) |
| 6 to 11 Years | 0 (0.0%) | 0 (0.0%) |
| 12 to 14 Years | 0 (0.0%) | 0 (0.0%) |
| 15 Years | 0 (0.0%) | 0 (0.0%) |
| 16 and 17 Years | 0 (0.0%) | 0 (0.0%) |
| 18 to 24 Years | 0 (0.0%) | 0 (0.0%) |
| 25 to 34 Years | 0 (0.0%) | 0 (0.0%) |
| 35 to 44 Years | 0 (0.0%) | 0 (0.0%) |
| 45 to 54 Years | 0 (0.0%) | 0 (0.0%) |
| 55 to 64 Years | 0 (0.0%) | 0 (0.0%) |
| 65 to 74 Years | 0 (0.0%) | 0 (0.0%) |
| 75 Years and over | 0 (0.0%) | 0 (0.0%) |
| Total | 0 (0.0%) | 0 (0.0%) |
Income Above Poverty by Sex and Age in Nile
According to the poverty statistics in Nile, males aged 6 to 11 years and females aged 25 to 34 years are the age groups that are most secure financially, with 100.0% of males and 100.0% of females in these age groups living above the poverty line.
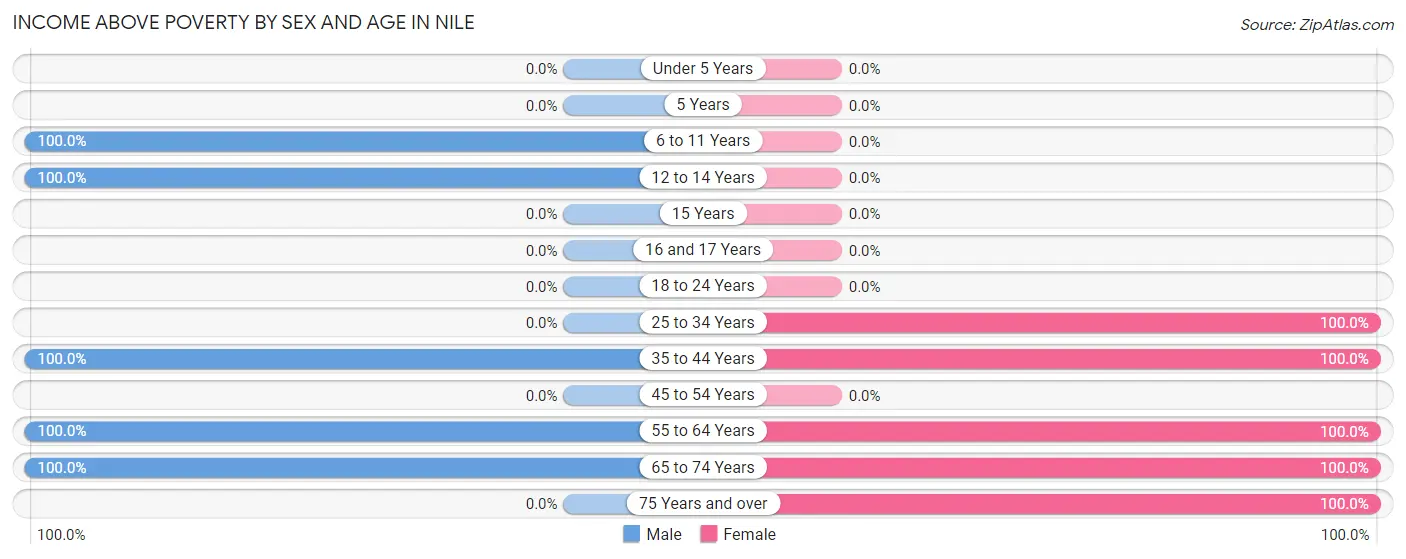
| Age Bracket | Male | Female |
| Under 5 Years | 0 (0.0%) | 0 (0.0%) |
| 5 Years | 0 (0.0%) | 0 (0.0%) |
| 6 to 11 Years | 11 (100.0%) | 0 (0.0%) |
| 12 to 14 Years | 10 (100.0%) | 0 (0.0%) |
| 15 Years | 0 (0.0%) | 0 (0.0%) |
| 16 and 17 Years | 0 (0.0%) | 0 (0.0%) |
| 18 to 24 Years | 0 (0.0%) | 0 (0.0%) |
| 25 to 34 Years | 0 (0.0%) | 24 (100.0%) |
| 35 to 44 Years | 11 (100.0%) | 9 (100.0%) |
| 45 to 54 Years | 0 (0.0%) | 0 (0.0%) |
| 55 to 64 Years | 18 (100.0%) | 8 (100.0%) |
| 65 to 74 Years | 7 (100.0%) | 10 (100.0%) |
| 75 Years and over | 0 (0.0%) | 7 (100.0%) |
| Total | 57 (100.0%) | 58 (100.0%) |
Income Below Poverty Among Married-Couple Families in Nile
| Children | Above Poverty | Below Poverty |
| No Children | 16 (100.0%) | 0 (0.0%) |
| 1 or 2 Children | 9 (100.0%) | 0 (0.0%) |
| 3 or 4 Children | 0 (0.0%) | 0 (0.0%) |
| 5 or more Children | 0 (0.0%) | 0 (0.0%) |
| Total | 25 (100.0%) | 0 (0.0%) |
Income Below Poverty Among Single-Parent Households in Nile
| Children | Single Father | Single Mother |
| No Children | 0 (0.0%) | 0 (0.0%) |
| 1 or 2 Children | 0 (0.0%) | 0 (0.0%) |
| 3 or 4 Children | 0 (0.0%) | 0 (0.0%) |
| 5 or more Children | 0 (0.0%) | 0 (0.0%) |
| Total | 0 (0.0%) | 0 (0.0%) |
Income Below Poverty Among Married-Couple vs Single-Parent Households in Nile
| Children | Married-Couple Families | Single-Parent Households |
| No Children | 0 (0.0%) | 0 (0.0%) |
| 1 or 2 Children | 0 (0.0%) | 0 (0.0%) |
| 3 or 4 Children | 0 (0.0%) | 0 (0.0%) |
| 5 or more Children | 0 (0.0%) | 0 (0.0%) |
| Total | 0 (0.0%) | 0 (0.0%) |
Race in Nile
The most populous races in Nile are , and White / Caucasian (115 | 100.0%).
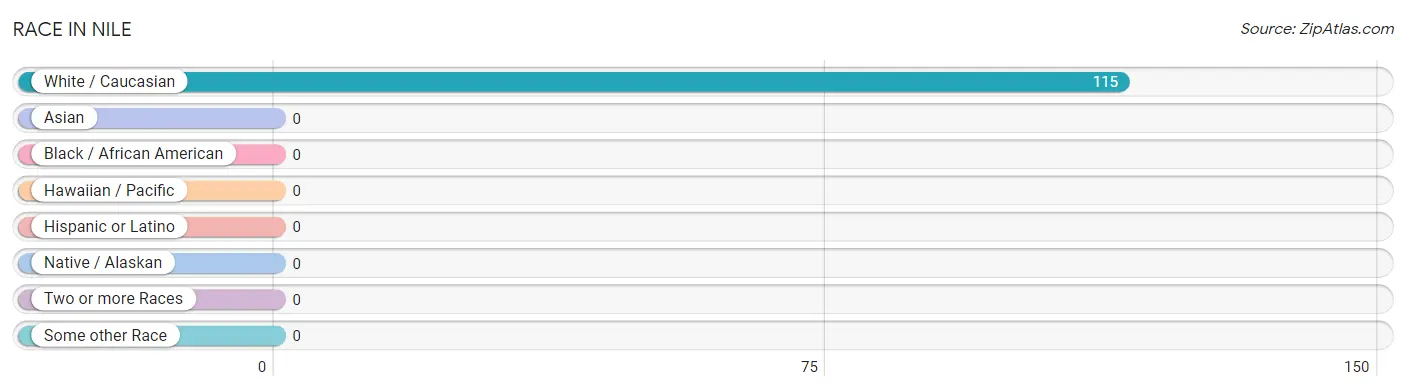
| Race | # Population | % Population |
| Asian | 0 | 0.0% |
| Black / African American | 0 | 0.0% |
| Hawaiian / Pacific | 0 | 0.0% |
| Hispanic or Latino | 0 | 0.0% |
| Native / Alaskan | 0 | 0.0% |
| White / Caucasian | 115 | 100.0% |
| Two or more Races | 0 | 0.0% |
| Some other Race | 0 | 0.0% |
| Total | 115 | 100.0% |
Ancestry in Nile
The most populous ancestries reported in Nile are German (31 | 27.0%), Czech (24 | 20.9%), Irish (21 | 18.3%), English (18 | 15.7%), and Scottish (9 | 7.8%), together accounting for 89.6% of all Nile residents.
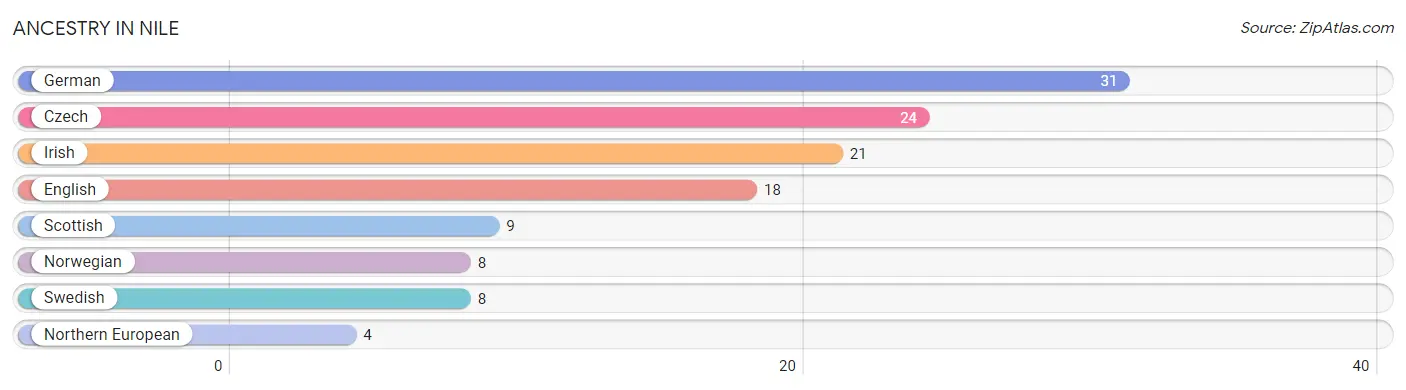
| Ancestry | # Population | % Population |
| Czech | 24 | 20.9% |
| English | 18 | 15.7% |
| German | 31 | 27.0% |
| Irish | 21 | 18.3% |
| Northern European | 4 | 3.5% |
| Norwegian | 8 | 7.0% |
| Scottish | 9 | 7.8% |
| Swedish | 8 | 7.0% | View All 8 Rows |
Immigrants in Nile
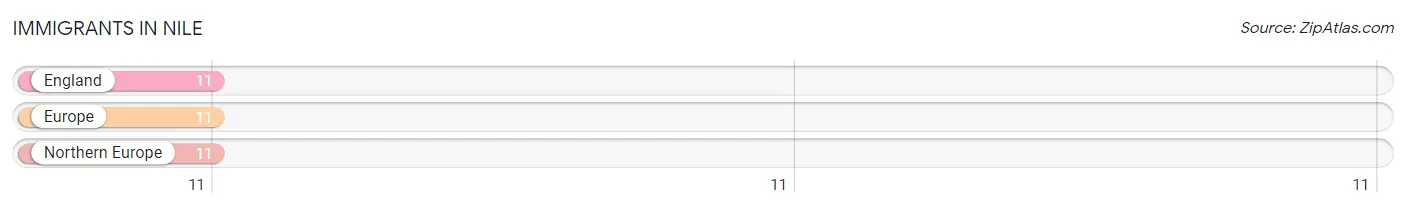
The most numerous immigrant groups reported in Nile came from England (11 | 9.6%), Europe (11 | 9.6%), and Northern Europe (11 | 9.6%), together accounting for 28.7% of all Nile residents.
| Immigration Origin | # Population | % Population |
| England | 11 | 9.6% |
| Europe | 11 | 9.6% |
| Northern Europe | 11 | 9.6% | View All 3 Rows |
Sex and Age in Nile
Sex and Age in Nile
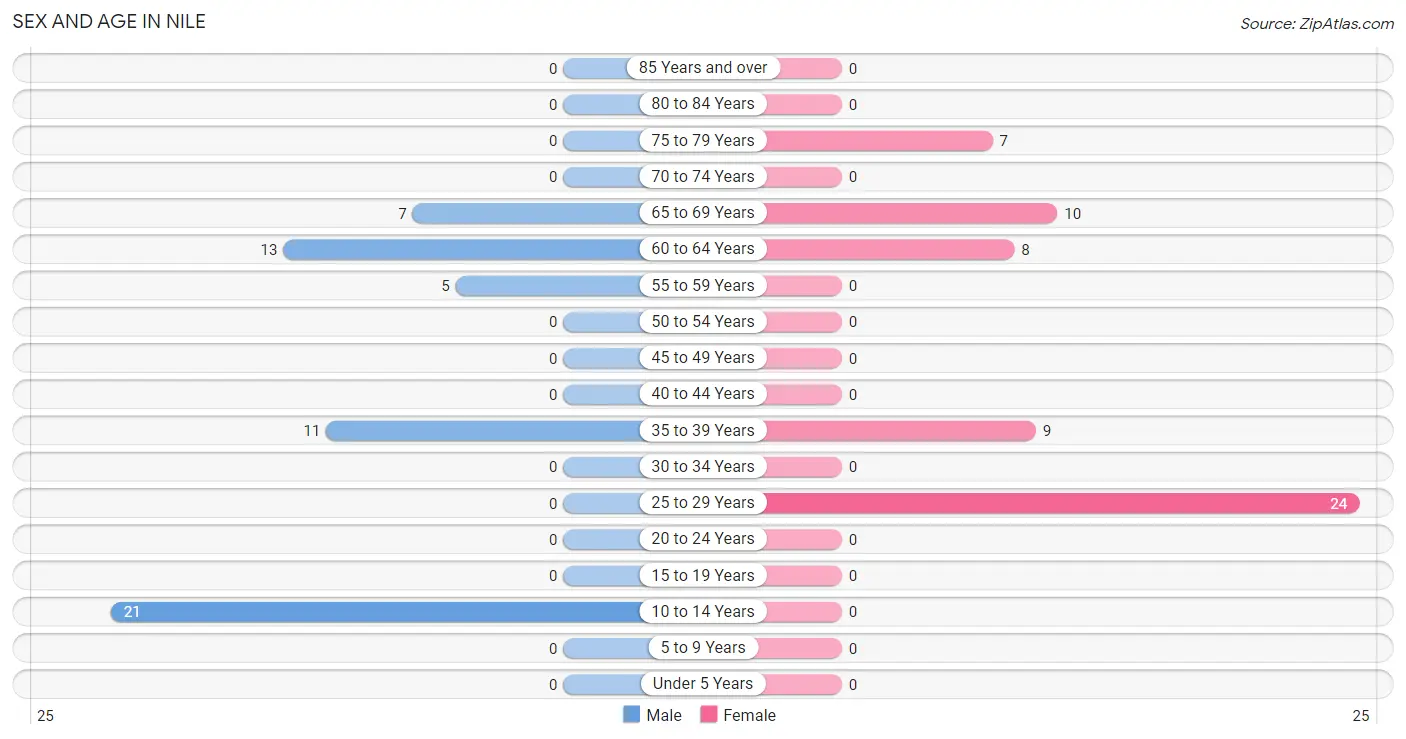
The most populous age groups in Nile are 10 to 14 Years (21 | 36.8%) for men and 25 to 29 Years (24 | 41.4%) for women.
| Age Bracket | Male | Female |
| Under 5 Years | 0 (0.0%) | 0 (0.0%) |
| 5 to 9 Years | 0 (0.0%) | 0 (0.0%) |
| 10 to 14 Years | 21 (36.8%) | 0 (0.0%) |
| 15 to 19 Years | 0 (0.0%) | 0 (0.0%) |
| 20 to 24 Years | 0 (0.0%) | 0 (0.0%) |
| 25 to 29 Years | 0 (0.0%) | 24 (41.4%) |
| 30 to 34 Years | 0 (0.0%) | 0 (0.0%) |
| 35 to 39 Years | 11 (19.3%) | 9 (15.5%) |
| 40 to 44 Years | 0 (0.0%) | 0 (0.0%) |
| 45 to 49 Years | 0 (0.0%) | 0 (0.0%) |
| 50 to 54 Years | 0 (0.0%) | 0 (0.0%) |
| 55 to 59 Years | 5 (8.8%) | 0 (0.0%) |
| 60 to 64 Years | 13 (22.8%) | 8 (13.8%) |
| 65 to 69 Years | 7 (12.3%) | 10 (17.2%) |
| 70 to 74 Years | 0 (0.0%) | 0 (0.0%) |
| 75 to 79 Years | 0 (0.0%) | 7 (12.1%) |
| 80 to 84 Years | 0 (0.0%) | 0 (0.0%) |
| 85 Years and over | 0 (0.0%) | 0 (0.0%) |
| Total | 57 (100.0%) | 58 (100.0%) |
Families and Households in Nile
Median Family Size in Nile
| Family Type | # Families | Family Size |
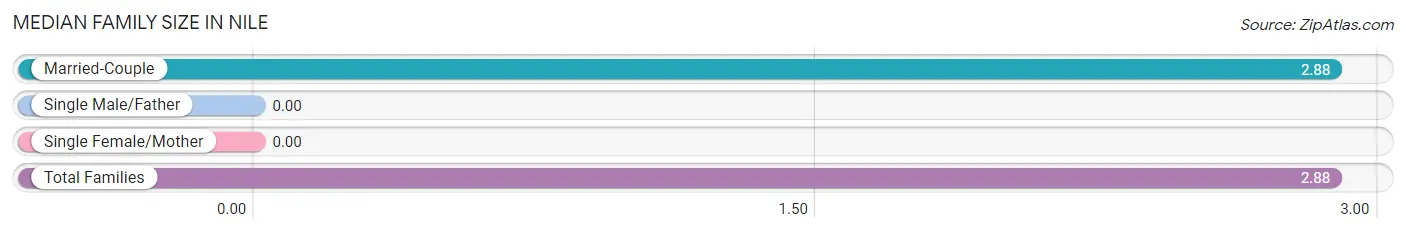
| Married-Couple | 25 (100.0%) | 2.88 |
| Single Male/Father | 0 (0.0%) | - |
| Single Female/Mother | 0 (0.0%) | - |
| Total Families | 25 (100.0%) | 2.88 |
Median Household Size in Nile
| Household Type | # Households | Household Size |
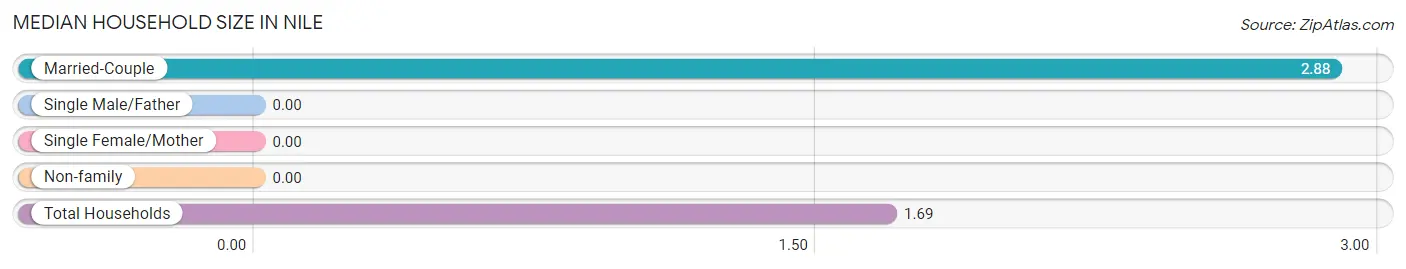
| Married-Couple | 25 (36.8%) | 2.88 |
| Single Male/Father | 0 (0.0%) | - |
| Single Female/Mother | 0 (0.0%) | - |
| Non-family | 43 (63.2%) | - |
| Total Households | 68 (100.0%) | 1.69 |
Household Size by Marriage Status in Nile
Out of a total of 68 households in Nile, 25 (36.8%) are family households, while 43 (63.2%) are nonfamily households. The most numerous type of family households are 2-person households, comprising 16, and the most common type of nonfamily households are 1-person households, comprising 43.
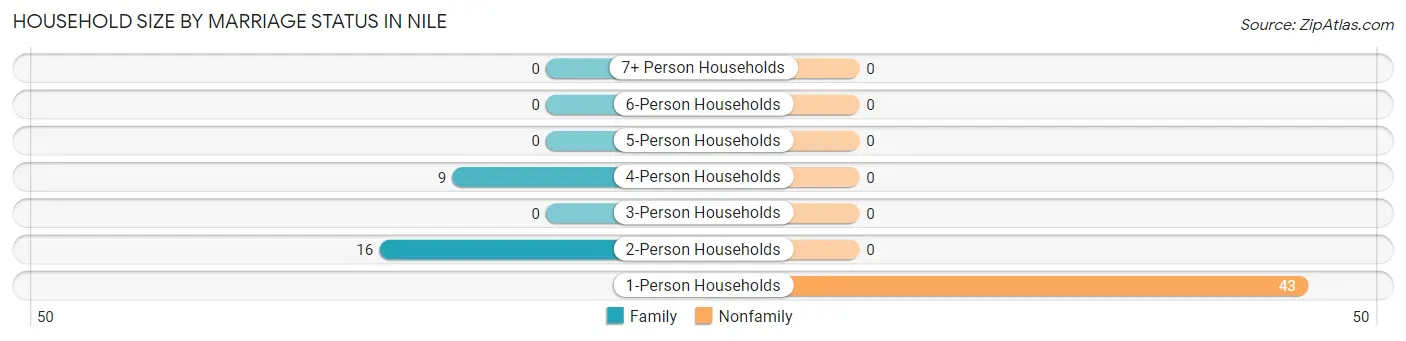
| Household Size | Family Households | Nonfamily Households |
| 1-Person Households | - | 43 (63.2%) |
| 2-Person Households | 16 (23.5%) | 0 (0.0%) |
| 3-Person Households | 0 (0.0%) | 0 (0.0%) |
| 4-Person Households | 9 (13.2%) | 0 (0.0%) |
| 5-Person Households | 0 (0.0%) | 0 (0.0%) |
| 6-Person Households | 0 (0.0%) | 0 (0.0%) |
| 7+ Person Households | 0 (0.0%) | 0 (0.0%) |
| Total | 25 (36.8%) | 43 (63.2%) |
Female Fertility in Nile
Fertility by Age in Nile
| Age Bracket | Women with Births | Births / 1,000 Women |
| 15 to 19 years | 0 (0.0%) | 0.0 |
| 20 to 34 years | 0 (0.0%) | 0.0 |
| 35 to 50 years | 0 (0.0%) | 0.0 |
| Total | 0 (0.0%) | 0.0 |
Fertility by Age by Marriage Status in Nile
| Age Bracket | Married | Unmarried |
| 15 to 19 years | 0 (0.0%) | 0 (0.0%) |
| 20 to 34 years | 0 (0.0%) | 0 (0.0%) |
| 35 to 50 years | 0 (0.0%) | 0 (0.0%) |
| Total | 0 (0.0%) | 0 (0.0%) |
Fertility by Education in Nile
| Educational Attainment | Women with Births | Births / 1,000 Women |
| Less than High School | 0 (0.0%) | 0.0 |
| High School Diploma | 0 (0.0%) | 0.0 |
| College or Associate's Degree | 0 (0.0%) | 0.0 |
| Bachelor's Degree | 0 (0.0%) | 0.0 |
| Graduate Degree | 0 (0.0%) | 0.0 |
| Total | 0 (0.0%) | 0.0 |
Fertility by Education by Marriage Status in Nile
| Educational Attainment | Married | Unmarried |
| Less than High School | 0 (0.0%) | 0 (0.0%) |
| High School Diploma | 0 (0.0%) | 0 (0.0%) |
| College or Associate's Degree | 0 (0.0%) | 0 (0.0%) |
| Bachelor's Degree | 0 (0.0%) | 0 (0.0%) |
| Graduate Degree | 0 (0.0%) | 0 (0.0%) |
| Total | 0 (0.0%) | 0 (0.0%) |
Employment Characteristics in Nile
Employment by Class of Employer in Nile
Among the 24 employed individuals in Nile, private company employees (20 | 83.3%), and self-employed (not incorporated) (4 | 16.7%) make up the most common classes of employment.
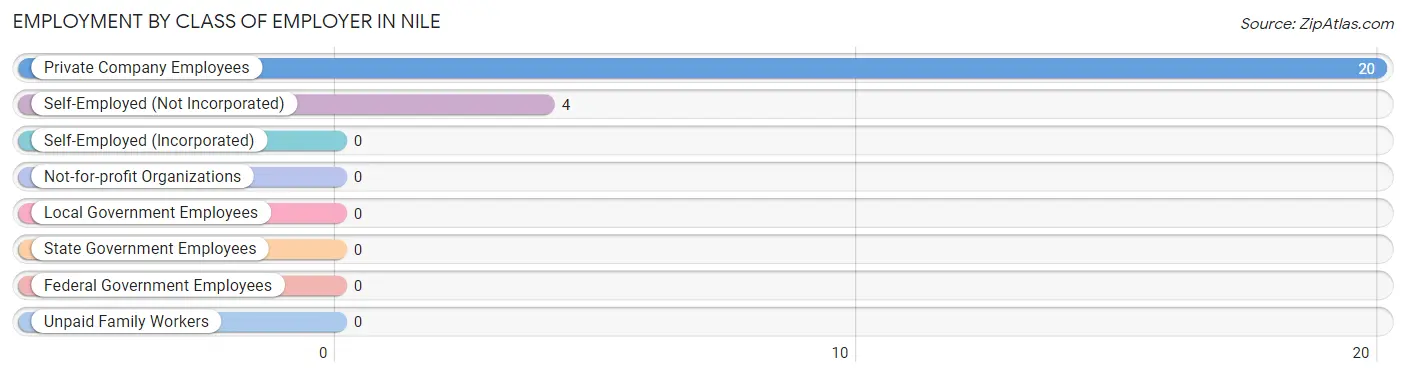
| Employer Class | # Employees | % Employees |
| Private Company Employees | 20 | 83.3% |
| Self-Employed (Incorporated) | 0 | 0.0% |
| Self-Employed (Not Incorporated) | 4 | 16.7% |
| Not-for-profit Organizations | 0 | 0.0% |
| Local Government Employees | 0 | 0.0% |
| State Government Employees | 0 | 0.0% |
| Federal Government Employees | 0 | 0.0% |
| Unpaid Family Workers | 0 | 0.0% |
| Total | 24 | 100.0% |
Employment Status by Age in Nile
According to the labor force statistics for Nile, out of the total population over 16 years of age (94), 51.1% or 48 individuals are in the labor force, with 50.0% or 24 of them unemployed. The age group with the highest labor force participation rate is 25 to 29 years, with 100.0% or 24 individuals in the labor force. Within the labor force, the 25 to 29 years age range has the highest percentage of unemployed individuals, with 100.0% or 24 of them being unemployed.
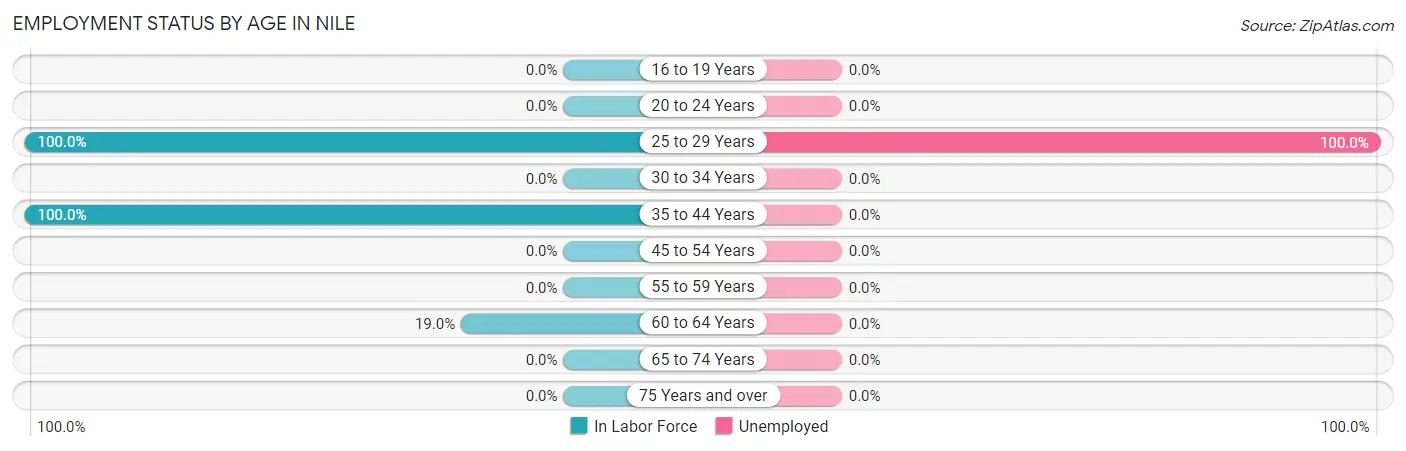
| Age Bracket | In Labor Force | Unemployed |
| 16 to 19 Years | 0 (0.0%) | 0 (0.0%) |
| 20 to 24 Years | 0 (0.0%) | 0 (0.0%) |
| 25 to 29 Years | 24 (100.0%) | 24 (100.0%) |
| 30 to 34 Years | 0 (0.0%) | 0 (0.0%) |
| 35 to 44 Years | 20 (100.0%) | 0 (0.0%) |
| 45 to 54 Years | 0 (0.0%) | 0 (0.0%) |
| 55 to 59 Years | 0 (0.0%) | 0 (0.0%) |
| 60 to 64 Years | 4 (19.0%) | 0 (0.0%) |
| 65 to 74 Years | 0 (0.0%) | 0 (0.0%) |
| 75 Years and over | 0 (0.0%) | 0 (0.0%) |
| Total | 48 (51.1%) | 24 (50.0%) |
Employment Status by Educational Attainment in Nile
According to labor force statistics for Nile, 68.6% of individuals (48) out of the total population between 25 and 64 years of age (70) are in the labor force, with 50.0% or 24 of them being unemployed. The group with the highest labor force participation rate are those with the educational attainment of college / associate degree, with 100.0% or 20 individuals in the labor force. Within the labor force, individuals with bachelor's degree or higher education have the highest percentage of unemployment, with 100.0% or 24 of them being unemployed.
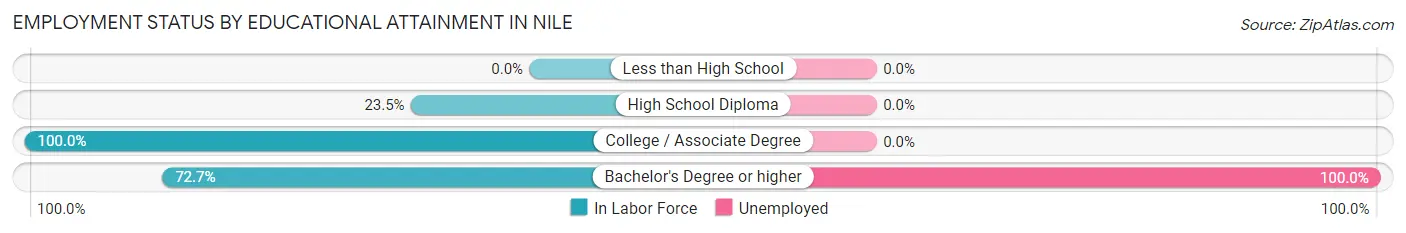
| Educational Attainment | In Labor Force | Unemployed |
| Less than High School | 0 (0.0%) | 0 (0.0%) |
| High School Diploma | 4 (23.5%) | 0 (0.0%) |
| College / Associate Degree | 20 (100.0%) | 0 (0.0%) |
| Bachelor's Degree or higher | 24 (72.7%) | 33 (100.0%) |
| Total | 48 (68.6%) | 35 (50.0%) |
Employment Occupations by Sex in Nile
Management, Business, Science and Arts Occupations
The most common Management, Business, Science and Arts occupations in Nile are Community & Social Service (9 | 37.5%), and Education Instruction & Library (9 | 37.5%).
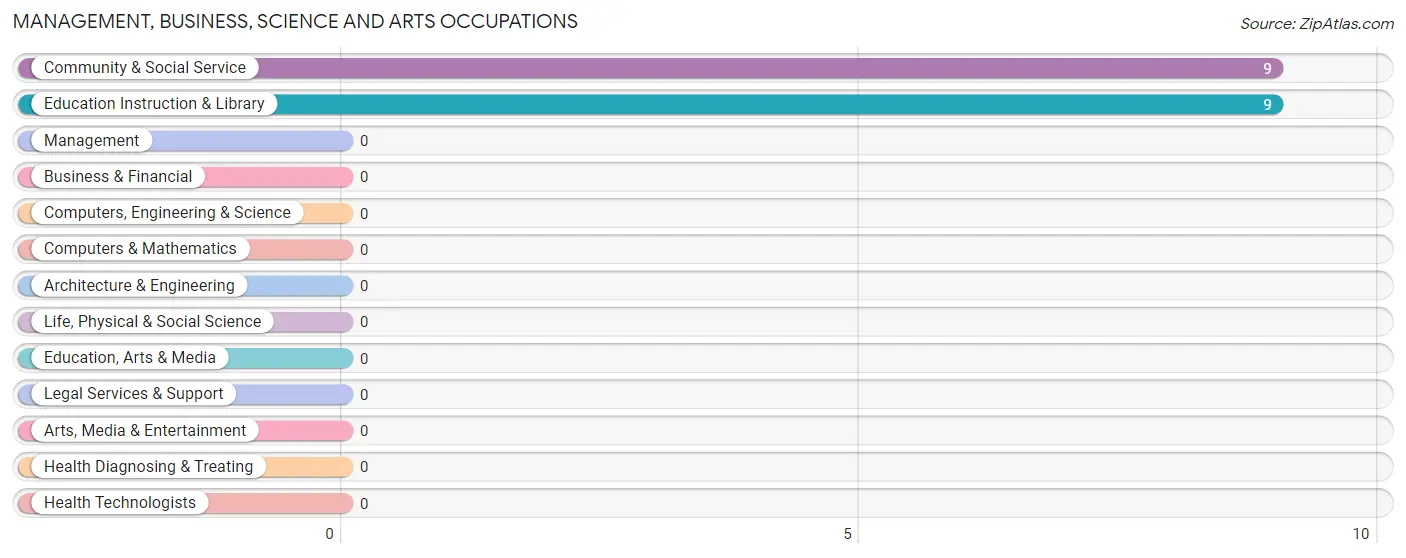
Management, Business, Science and Arts Occupations by Sex
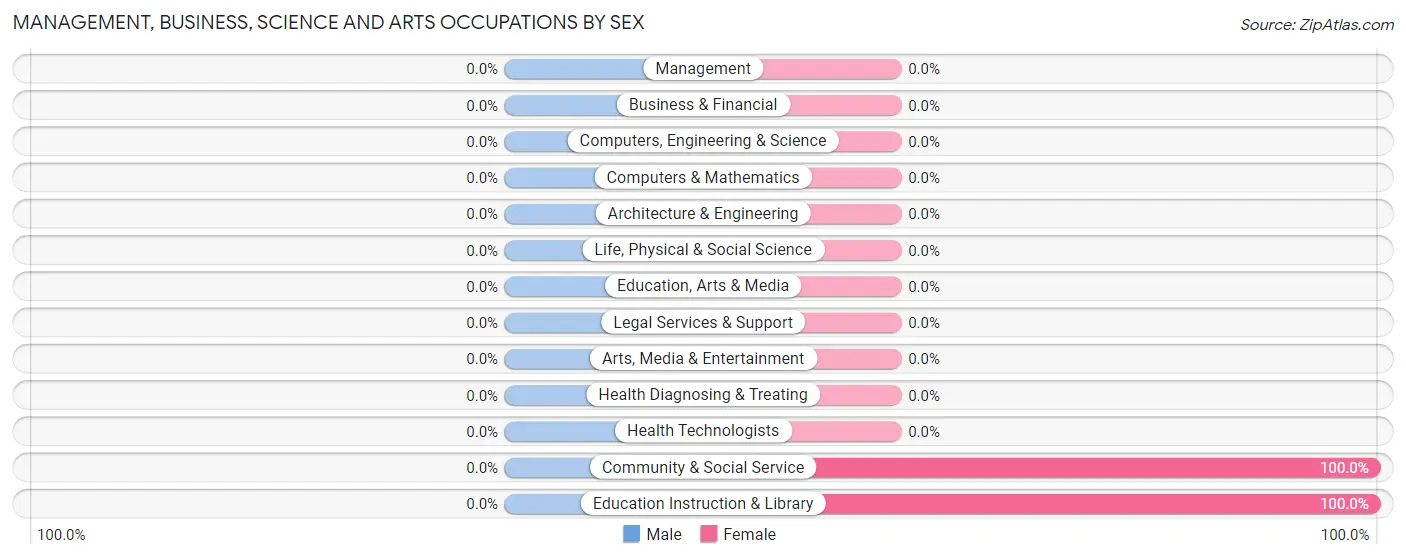
| Occupation | Male | Female |
| Management | 0 (0.0%) | 0 (0.0%) |
| Business & Financial | 0 (0.0%) | 0 (0.0%) |
| Computers, Engineering & Science | 0 (0.0%) | 0 (0.0%) |
| Computers & Mathematics | 0 (0.0%) | 0 (0.0%) |
| Architecture & Engineering | 0 (0.0%) | 0 (0.0%) |
| Life, Physical & Social Science | 0 (0.0%) | 0 (0.0%) |
| Community & Social Service | 0 (0.0%) | 9 (100.0%) |
| Education, Arts & Media | 0 (0.0%) | 0 (0.0%) |
| Legal Services & Support | 0 (0.0%) | 0 (0.0%) |
| Education Instruction & Library | 0 (0.0%) | 9 (100.0%) |
| Arts, Media & Entertainment | 0 (0.0%) | 0 (0.0%) |
| Health Diagnosing & Treating | 0 (0.0%) | 0 (0.0%) |
| Health Technologists | 0 (0.0%) | 0 (0.0%) |
| Total (Category) | 0 (0.0%) | 9 (100.0%) |
| Total (Overall) | 15 (62.5%) | 9 (37.5%) |
Services Occupations
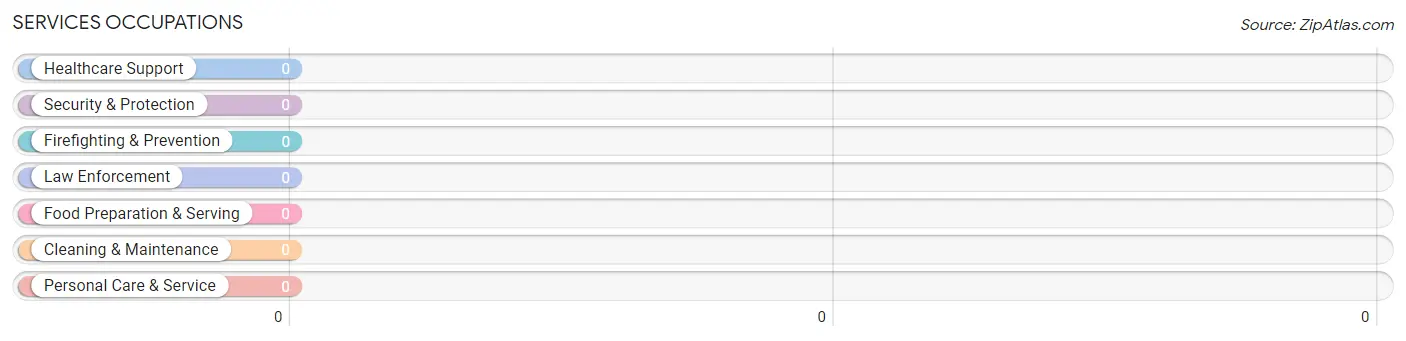
Services Occupations by Sex
| Occupation | Male | Female |
| Healthcare Support | 0 (0.0%) | 0 (0.0%) |
| Security & Protection | 0 (0.0%) | 0 (0.0%) |
| Firefighting & Prevention | 0 (0.0%) | 0 (0.0%) |
| Law Enforcement | 0 (0.0%) | 0 (0.0%) |
| Food Preparation & Serving | 0 (0.0%) | 0 (0.0%) |
| Cleaning & Maintenance | 0 (0.0%) | 0 (0.0%) |
| Personal Care & Service | 0 (0.0%) | 0 (0.0%) |
| Total (Category) | 0 (0.0%) | 0 (0.0%) |
| Total (Overall) | 15 (62.5%) | 9 (37.5%) |
Sales and Office Occupations
Sales and Office Occupations by Sex
| Occupation | Male | Female |
| Sales & Related | 0 (0.0%) | 0 (0.0%) |
| Office & Administration | 0 (0.0%) | 0 (0.0%) |
| Total (Category) | 0 (0.0%) | 0 (0.0%) |
| Total (Overall) | 15 (62.5%) | 9 (37.5%) |
Natural Resources, Construction and Maintenance Occupations
The most common Natural Resources, Construction and Maintenance occupations in Nile are , and Construction & Extraction (4 | 16.7%).
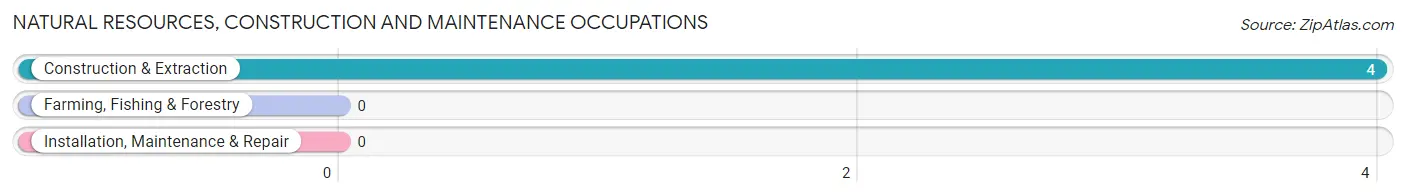
Natural Resources, Construction and Maintenance Occupations by Sex
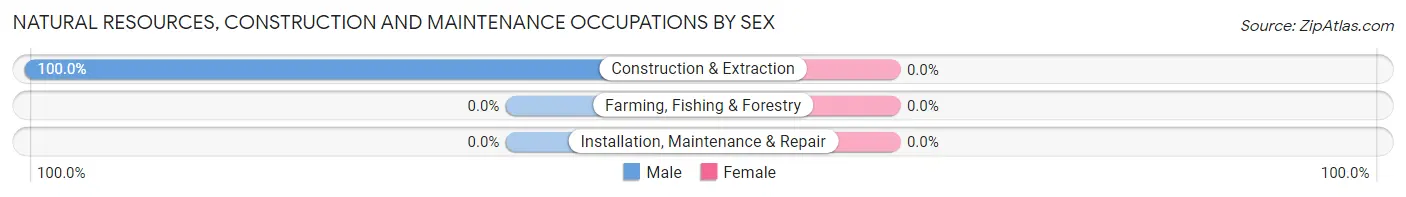
| Occupation | Male | Female |
| Farming, Fishing & Forestry | 0 (0.0%) | 0 (0.0%) |
| Construction & Extraction | 4 (100.0%) | 0 (0.0%) |
| Installation, Maintenance & Repair | 0 (0.0%) | 0 (0.0%) |
| Total (Category) | 4 (100.0%) | 0 (0.0%) |
| Total (Overall) | 15 (62.5%) | 9 (37.5%) |
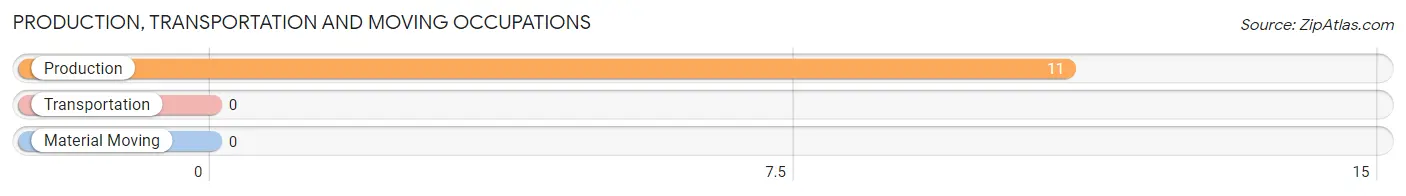
Production, Transportation and Moving Occupations
The most common Production, Transportation and Moving occupations in Nile are , and Production (11 | 45.8%).
Production, Transportation and Moving Occupations by Sex
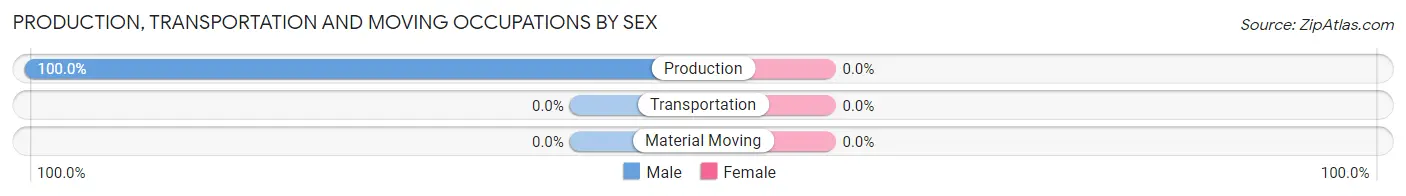
| Occupation | Male | Female |
| Production | 11 (100.0%) | 0 (0.0%) |
| Transportation | 0 (0.0%) | 0 (0.0%) |
| Material Moving | 0 (0.0%) | 0 (0.0%) |
| Total (Category) | 11 (100.0%) | 0 (0.0%) |
| Total (Overall) | 15 (62.5%) | 9 (37.5%) |
Employment Industries by Sex in Nile
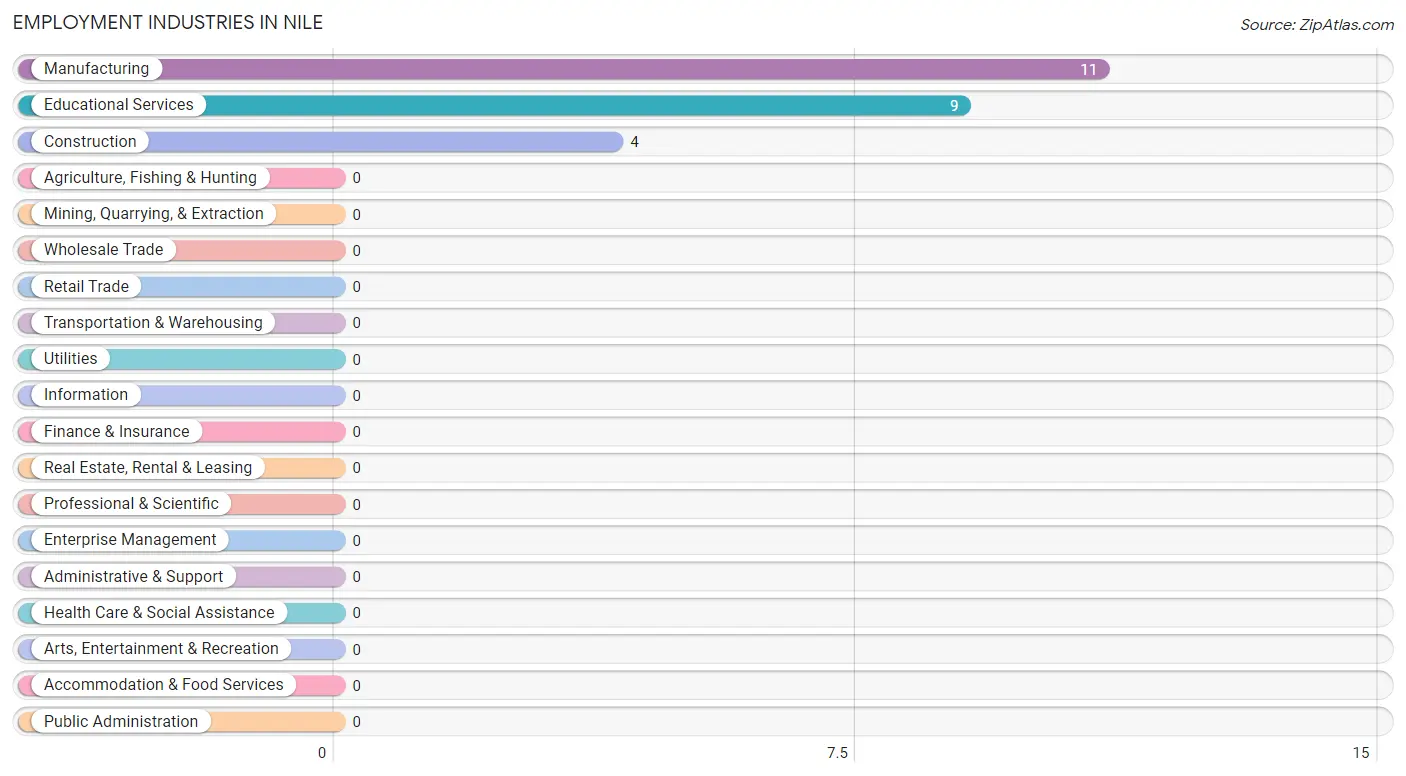
Employment Industries in Nile
The major employment industries in Nile include Manufacturing (11 | 45.8%), Educational Services (9 | 37.5%), and Construction (4 | 16.7%).
Employment Industries by Sex in Nile
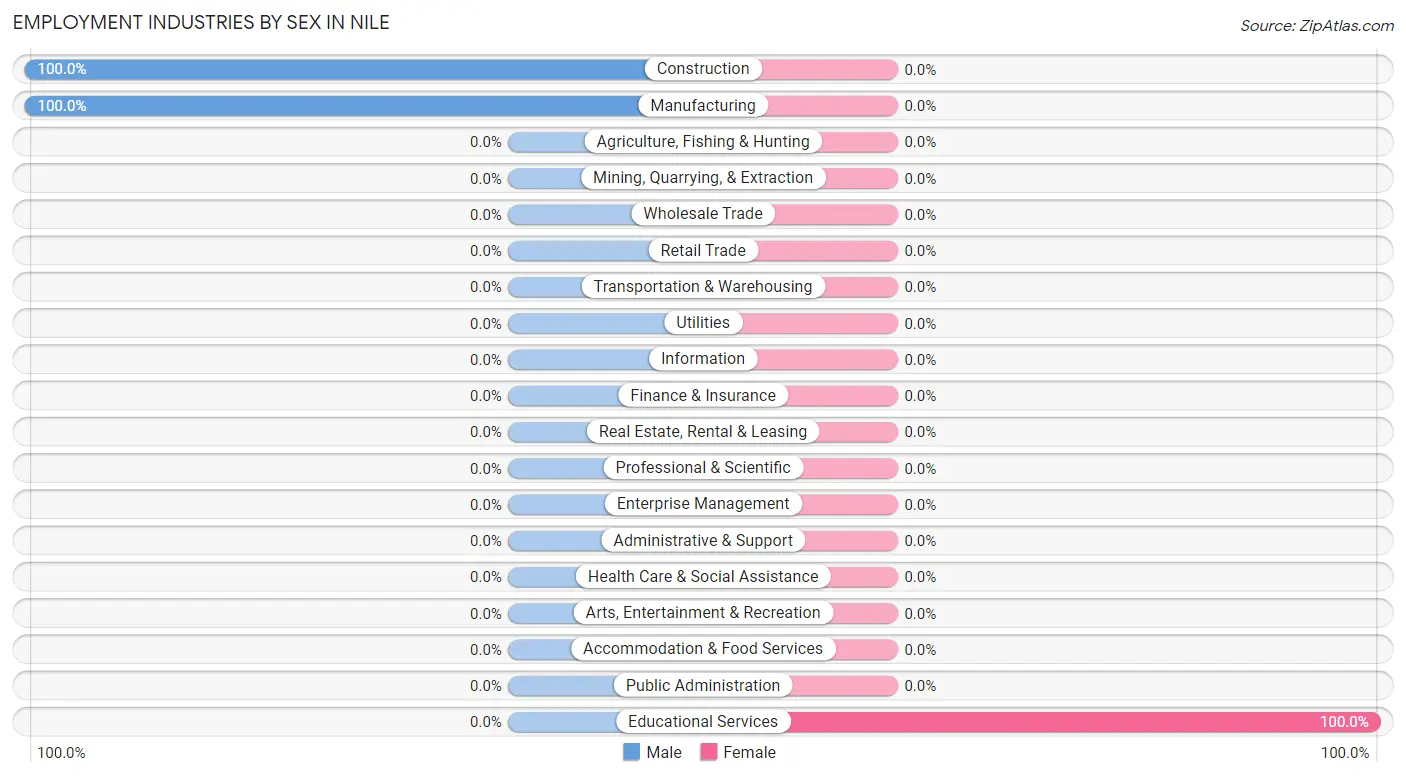
| Industry | Male | Female |
| Agriculture, Fishing & Hunting | 0 (0.0%) | 0 (0.0%) |
| Mining, Quarrying, & Extraction | 0 (0.0%) | 0 (0.0%) |
| Construction | 4 (100.0%) | 0 (0.0%) |
| Manufacturing | 11 (100.0%) | 0 (0.0%) |
| Wholesale Trade | 0 (0.0%) | 0 (0.0%) |
| Retail Trade | 0 (0.0%) | 0 (0.0%) |
| Transportation & Warehousing | 0 (0.0%) | 0 (0.0%) |
| Utilities | 0 (0.0%) | 0 (0.0%) |
| Information | 0 (0.0%) | 0 (0.0%) |
| Finance & Insurance | 0 (0.0%) | 0 (0.0%) |
| Real Estate, Rental & Leasing | 0 (0.0%) | 0 (0.0%) |
| Professional & Scientific | 0 (0.0%) | 0 (0.0%) |
| Enterprise Management | 0 (0.0%) | 0 (0.0%) |
| Administrative & Support | 0 (0.0%) | 0 (0.0%) |
| Educational Services | 0 (0.0%) | 9 (100.0%) |
| Health Care & Social Assistance | 0 (0.0%) | 0 (0.0%) |
| Arts, Entertainment & Recreation | 0 (0.0%) | 0 (0.0%) |
| Accommodation & Food Services | 0 (0.0%) | 0 (0.0%) |
| Public Administration | 0 (0.0%) | 0 (0.0%) |
| Total | 15 (62.5%) | 9 (37.5%) |
Education in Nile
School Enrollment in Nile
The most common levels of schooling among the 45 students in Nile are college / undergraduate (24 | 53.3%), elementary school (11 | 24.4%), and middle school (10 | 22.2%).
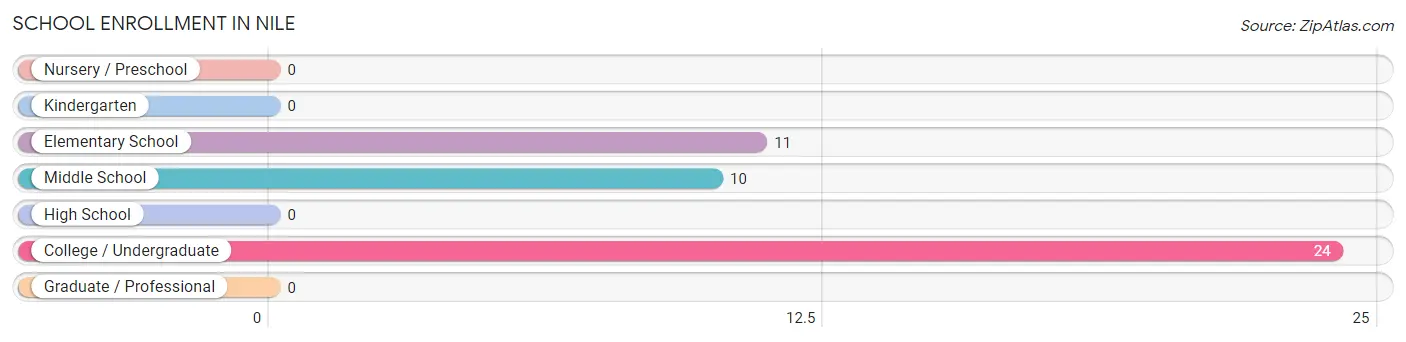
| School Level | # Students | % Students |
| Nursery / Preschool | 0 | 0.0% |
| Kindergarten | 0 | 0.0% |
| Elementary School | 11 | 24.4% |
| Middle School | 10 | 22.2% |
| High School | 0 | 0.0% |
| College / Undergraduate | 24 | 53.3% |
| Graduate / Professional | 0 | 0.0% |
| Total | 45 | 100.0% |
School Enrollment by Age by Funding Source in Nile
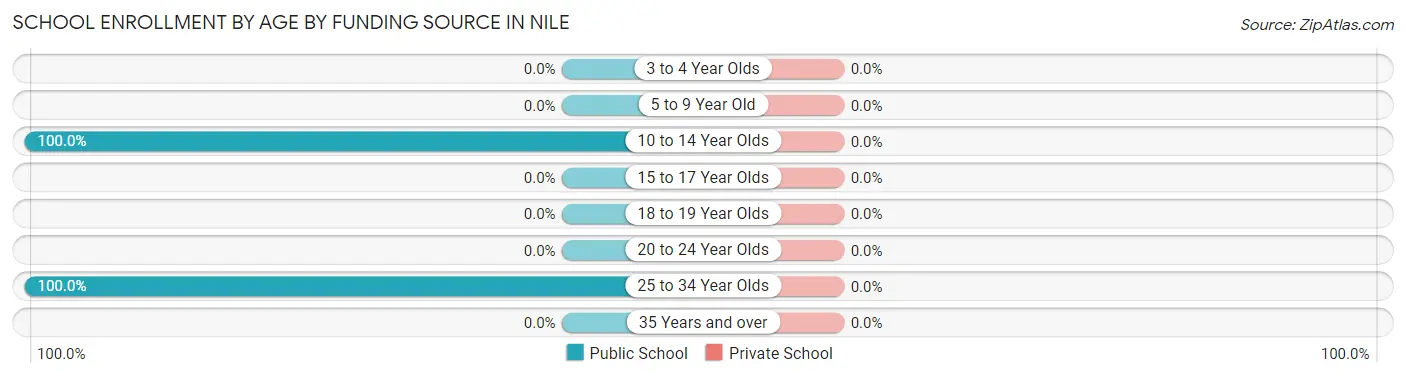
| Age Bracket | Public School | Private School |
| 3 to 4 Year Olds | 0 (0.0%) | 0 (0.0%) |
| 5 to 9 Year Old | 0 (0.0%) | 0 (0.0%) |
| 10 to 14 Year Olds | 21 (100.0%) | 0 (0.0%) |
| 15 to 17 Year Olds | 0 (0.0%) | 0 (0.0%) |
| 18 to 19 Year Olds | 0 (0.0%) | 0 (0.0%) |
| 20 to 24 Year Olds | 0 (0.0%) | 0 (0.0%) |
| 25 to 34 Year Olds | 24 (100.0%) | 0 (0.0%) |
| 35 Years and over | 0 (0.0%) | 0 (0.0%) |
| Total | 45 (100.0%) | 0 (0.0%) |
Educational Attainment by Field of Study in Nile
Visual & performing arts (24 | 49.0%), social sciences (9 | 18.4%), business (9 | 18.4%), and psychology (7 | 14.3%) are the most common fields of study among 49 individuals in Nile who have obtained a bachelor's degree or higher.
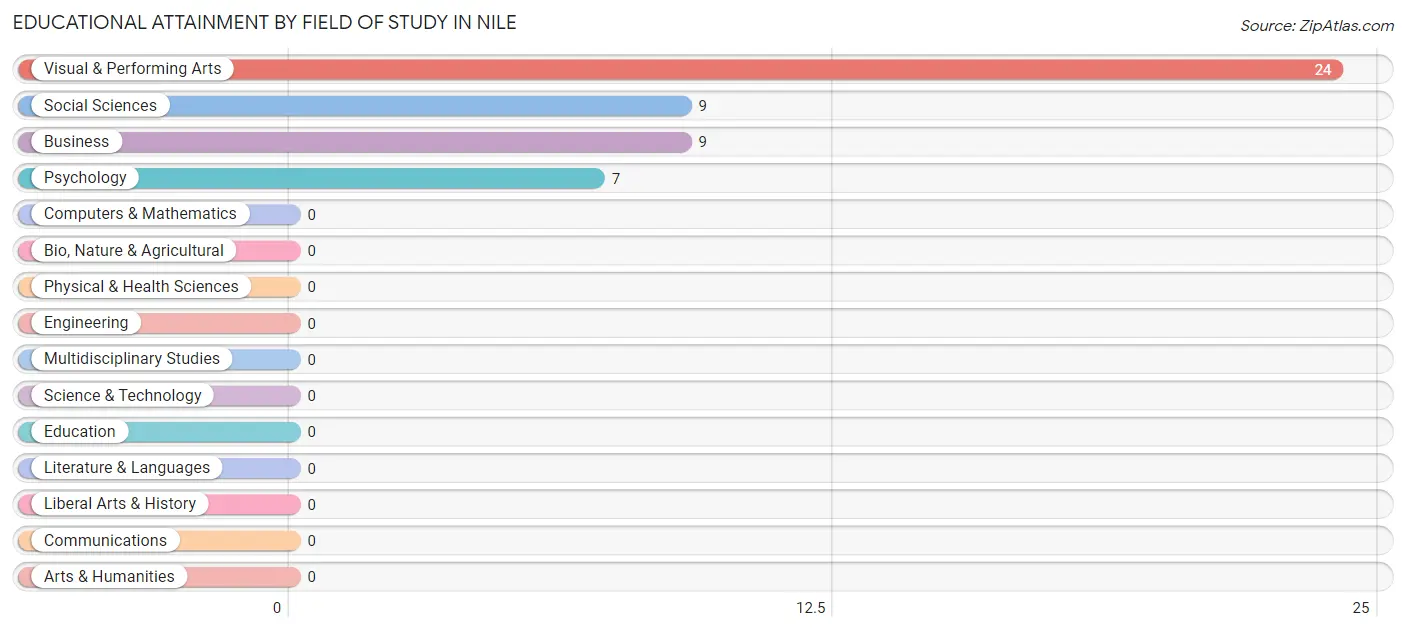
| Field of Study | # Graduates | % Graduates |
| Computers & Mathematics | 0 | 0.0% |
| Bio, Nature & Agricultural | 0 | 0.0% |
| Physical & Health Sciences | 0 | 0.0% |
| Psychology | 7 | 14.3% |
| Social Sciences | 9 | 18.4% |
| Engineering | 0 | 0.0% |
| Multidisciplinary Studies | 0 | 0.0% |
| Science & Technology | 0 | 0.0% |
| Business | 9 | 18.4% |
| Education | 0 | 0.0% |
| Literature & Languages | 0 | 0.0% |
| Liberal Arts & History | 0 | 0.0% |
| Visual & Performing Arts | 24 | 49.0% |
| Communications | 0 | 0.0% |
| Arts & Humanities | 0 | 0.0% |
| Total | 49 | 100.0% |
Transportation & Commute in Nile
Vehicle Availability by Sex in Nile
The most prevalent vehicle ownership categories in Nile are males with 3 vehicles (15, accounting for 100.0%) and females with 3 vehicles (9, making up 166.7%).
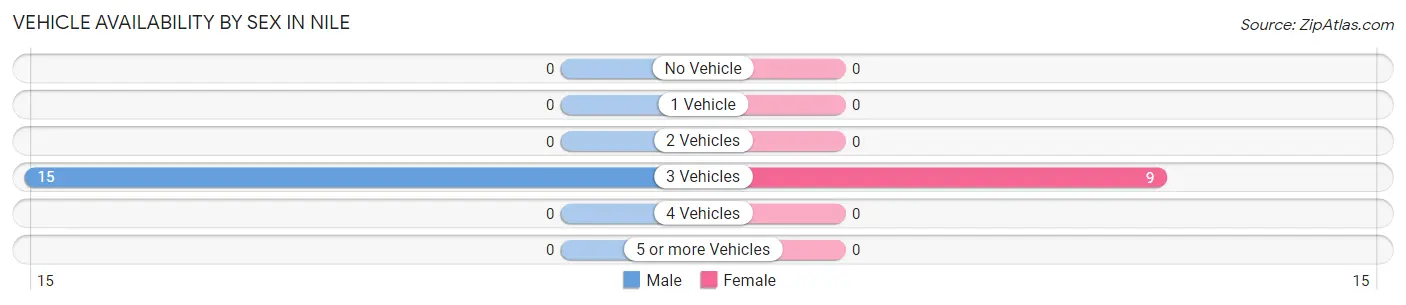
| Vehicles Available | Male | Female |
| No Vehicle | 0 (0.0%) | 0 (0.0%) |
| 1 Vehicle | 0 (0.0%) | 0 (0.0%) |
| 2 Vehicles | 0 (0.0%) | 0 (0.0%) |
| 3 Vehicles | 15 (100.0%) | 9 (100.0%) |
| 4 Vehicles | 0 (0.0%) | 0 (0.0%) |
| 5 or more Vehicles | 0 (0.0%) | 0 (0.0%) |
| Total | 15 (100.0%) | 9 (100.0%) |
Commute Time in Nile
The most frequently occuring commute durations in Nile are 90 or more minutes (11 commuters, 45.8%), 20 to 24 minutes (9 commuters, 37.5%), and 40 to 44 minutes (4 commuters, 16.7%).
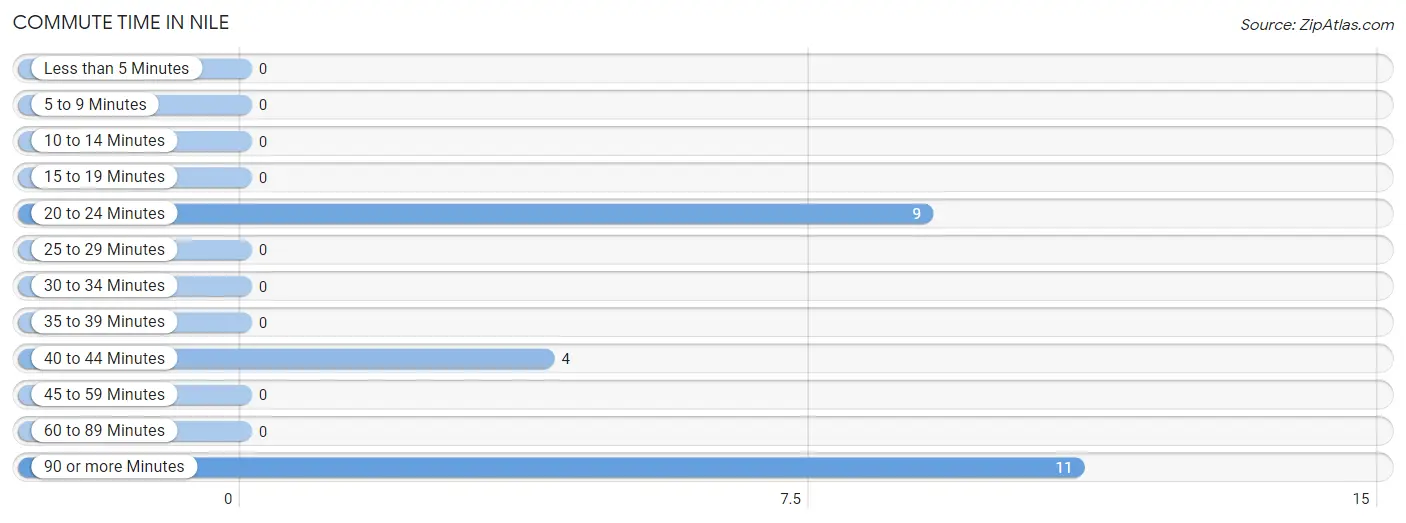
| Commute Time | # Commuters | % Commuters |
| Less than 5 Minutes | 0 | 0.0% |
| 5 to 9 Minutes | 0 | 0.0% |
| 10 to 14 Minutes | 0 | 0.0% |
| 15 to 19 Minutes | 0 | 0.0% |
| 20 to 24 Minutes | 9 | 37.5% |
| 25 to 29 Minutes | 0 | 0.0% |
| 30 to 34 Minutes | 0 | 0.0% |
| 35 to 39 Minutes | 0 | 0.0% |
| 40 to 44 Minutes | 4 | 16.7% |
| 45 to 59 Minutes | 0 | 0.0% |
| 60 to 89 Minutes | 0 | 0.0% |
| 90 or more Minutes | 11 | 45.8% |
Commute Time by Sex in Nile
The most common commute times in Nile are 90 or more minutes (11 commuters, 73.3%) for males and 20 to 24 minutes (9 commuters, 100.0%) for females.
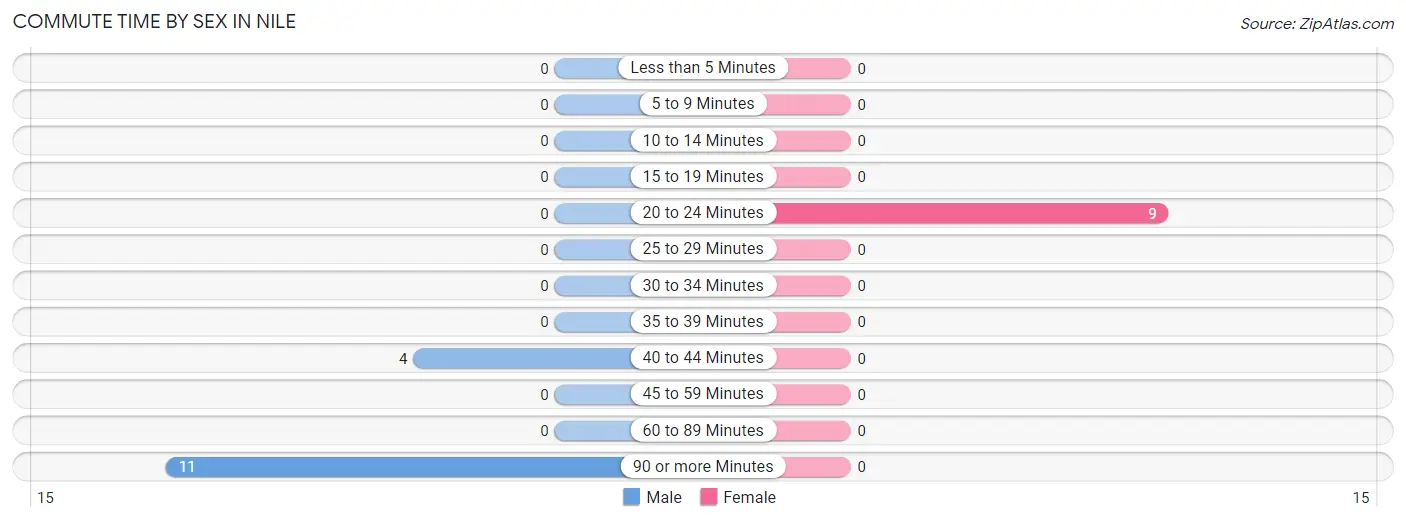
| Commute Time | Male | Female |
| Less than 5 Minutes | 0 (0.0%) | 0 (0.0%) |
| 5 to 9 Minutes | 0 (0.0%) | 0 (0.0%) |
| 10 to 14 Minutes | 0 (0.0%) | 0 (0.0%) |
| 15 to 19 Minutes | 0 (0.0%) | 0 (0.0%) |
| 20 to 24 Minutes | 0 (0.0%) | 9 (100.0%) |
| 25 to 29 Minutes | 0 (0.0%) | 0 (0.0%) |
| 30 to 34 Minutes | 0 (0.0%) | 0 (0.0%) |
| 35 to 39 Minutes | 0 (0.0%) | 0 (0.0%) |
| 40 to 44 Minutes | 4 (26.7%) | 0 (0.0%) |
| 45 to 59 Minutes | 0 (0.0%) | 0 (0.0%) |
| 60 to 89 Minutes | 0 (0.0%) | 0 (0.0%) |
| 90 or more Minutes | 11 (73.3%) | 0 (0.0%) |
Time of Departure to Work by Sex in Nile
The most frequent times of departure to work in Nile are 12:00 AM to 4:59 AM (11, 73.3%) for males and 7:00 AM to 7:29 AM (9, 100.0%) for females.
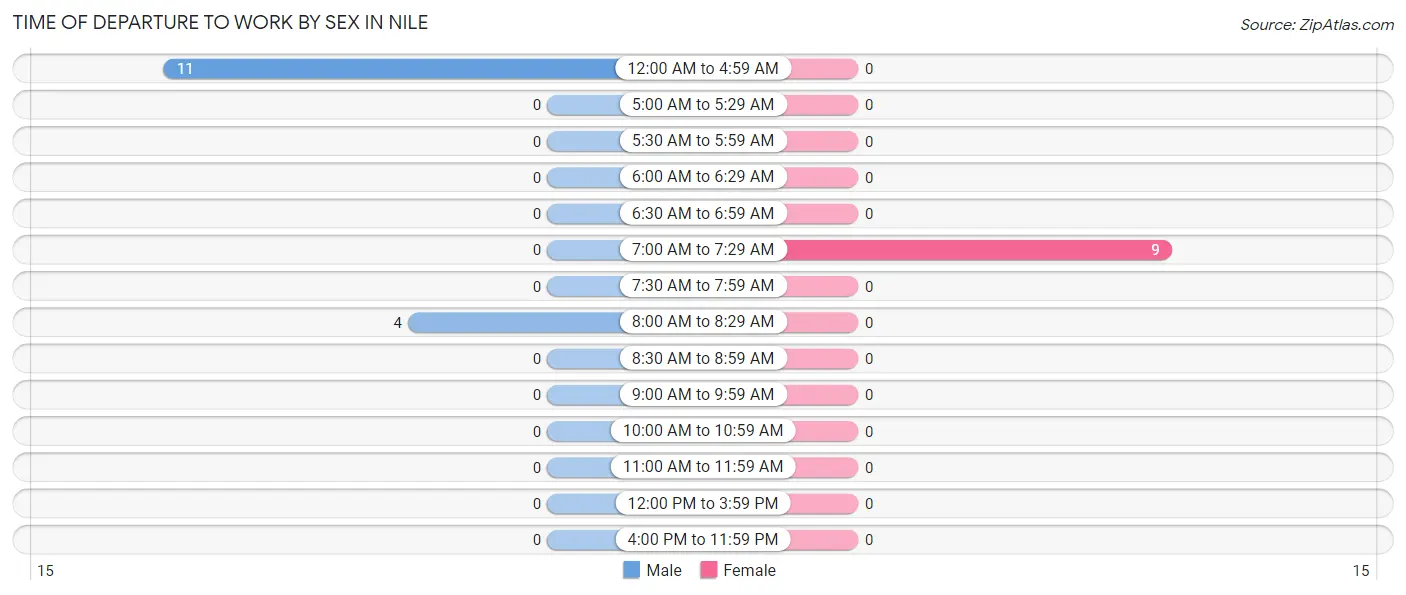
| Time of Departure | Male | Female |
| 12:00 AM to 4:59 AM | 11 (73.3%) | 0 (0.0%) |
| 5:00 AM to 5:29 AM | 0 (0.0%) | 0 (0.0%) |
| 5:30 AM to 5:59 AM | 0 (0.0%) | 0 (0.0%) |
| 6:00 AM to 6:29 AM | 0 (0.0%) | 0 (0.0%) |
| 6:30 AM to 6:59 AM | 0 (0.0%) | 0 (0.0%) |
| 7:00 AM to 7:29 AM | 0 (0.0%) | 9 (100.0%) |
| 7:30 AM to 7:59 AM | 0 (0.0%) | 0 (0.0%) |
| 8:00 AM to 8:29 AM | 4 (26.7%) | 0 (0.0%) |
| 8:30 AM to 8:59 AM | 0 (0.0%) | 0 (0.0%) |
| 9:00 AM to 9:59 AM | 0 (0.0%) | 0 (0.0%) |
| 10:00 AM to 10:59 AM | 0 (0.0%) | 0 (0.0%) |
| 11:00 AM to 11:59 AM | 0 (0.0%) | 0 (0.0%) |
| 12:00 PM to 3:59 PM | 0 (0.0%) | 0 (0.0%) |
| 4:00 PM to 11:59 PM | 0 (0.0%) | 0 (0.0%) |
| Total | 15 (100.0%) | 9 (100.0%) |
Housing Occupancy in Nile
Occupancy by Ownership in Nile
Of the total 68 dwellings in Nile, owner-occupied units account for 44 (64.7%), while renter-occupied units make up 24 (35.3%).
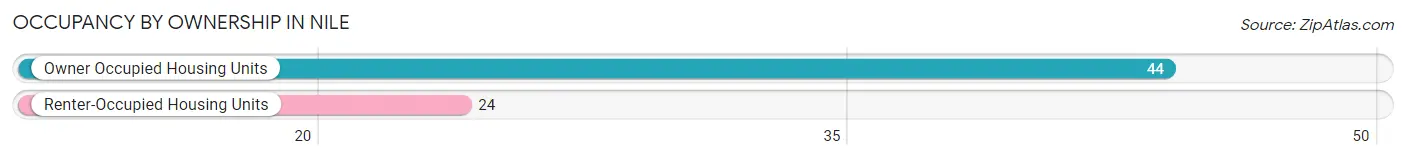
| Occupancy | # Housing Units | % Housing Units |
| Owner Occupied Housing Units | 44 | 64.7% |
| Renter-Occupied Housing Units | 24 | 35.3% |
| Total Occupied Housing Units | 68 | 100.0% |
Occupancy by Household Size in Nile
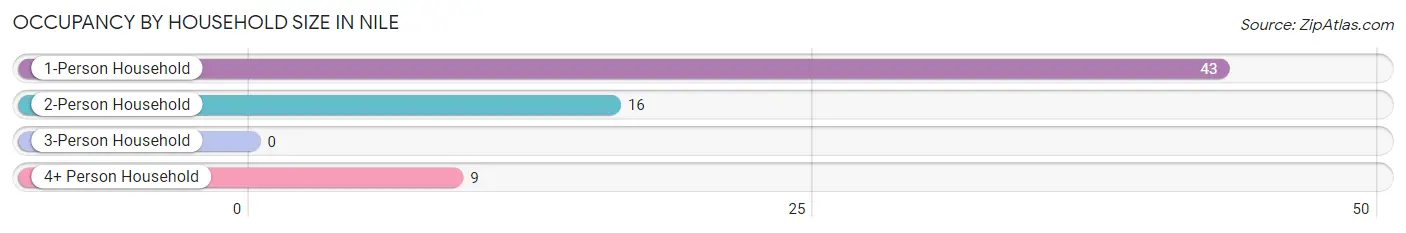
| Household Size | # Housing Units | % Housing Units |
| 1-Person Household | 43 | 63.2% |
| 2-Person Household | 16 | 23.5% |
| 3-Person Household | 0 | 0.0% |
| 4+ Person Household | 9 | 13.2% |
| Total Housing Units | 68 | 100.0% |
Occupancy by Ownership by Household Size in Nile
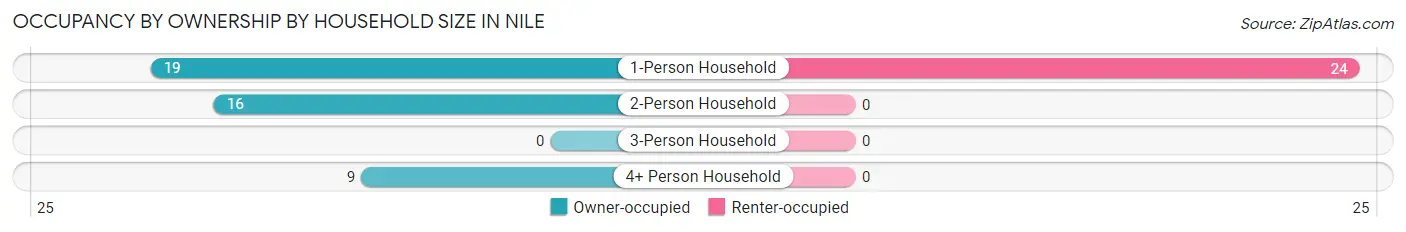
| Household Size | Owner-occupied | Renter-occupied |
| 1-Person Household | 19 (44.2%) | 24 (55.8%) |
| 2-Person Household | 16 (100.0%) | 0 (0.0%) |
| 3-Person Household | 0 (0.0%) | 0 (0.0%) |
| 4+ Person Household | 9 (100.0%) | 0 (0.0%) |
| Total Housing Units | 44 (64.7%) | 24 (35.3%) |
Occupancy by Educational Attainment in Nile
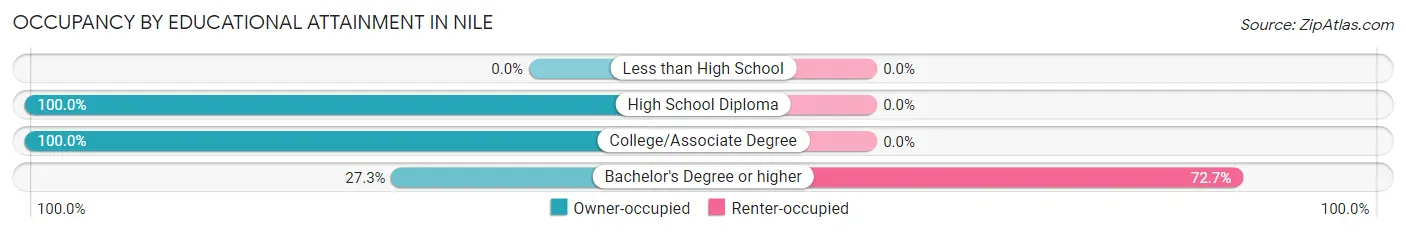
| Household Size | Owner-occupied | Renter-occupied |
| Less than High School | 0 (0.0%) | 0 (0.0%) |
| High School Diploma | 9 (100.0%) | 0 (0.0%) |
| College/Associate Degree | 26 (100.0%) | 0 (0.0%) |
| Bachelor's Degree or higher | 9 (27.3%) | 24 (72.7%) |
Occupancy by Age of Householder in Nile
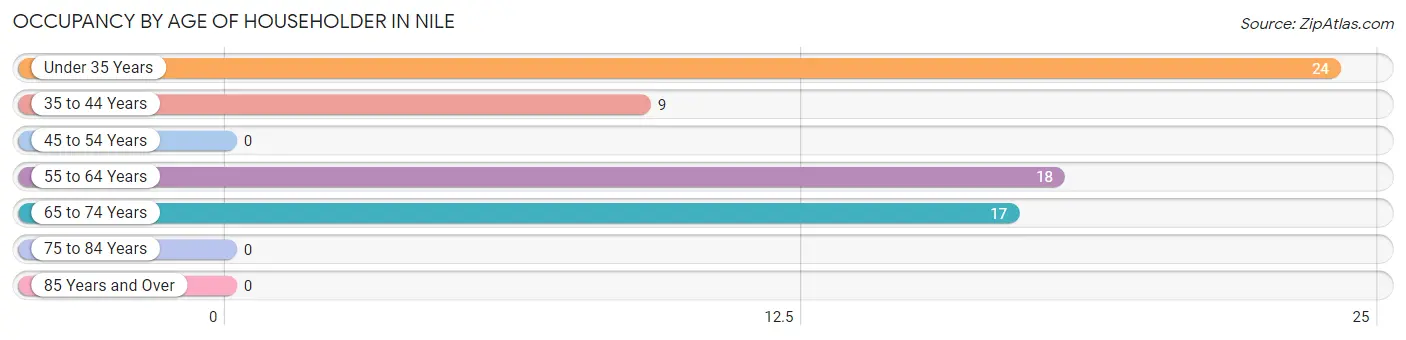
| Age Bracket | # Households | % Households |
| Under 35 Years | 24 | 35.3% |
| 35 to 44 Years | 9 | 13.2% |
| 45 to 54 Years | 0 | 0.0% |
| 55 to 64 Years | 18 | 26.5% |
| 65 to 74 Years | 17 | 25.0% |
| 75 to 84 Years | 0 | 0.0% |
| 85 Years and Over | 0 | 0.0% |
| Total | 68 | 100.0% |
Housing Finances in Nile
Median Income by Occupancy in Nile
| Occupancy Type | # Households | Median Income |
| Owner-Occupied | 44 (64.7%) | $0 |
| Renter-Occupied | 24 (35.3%) | $0 |
| Average | 68 (100.0%) | $0 |
Occupancy by Householder Income Bracket in Nile
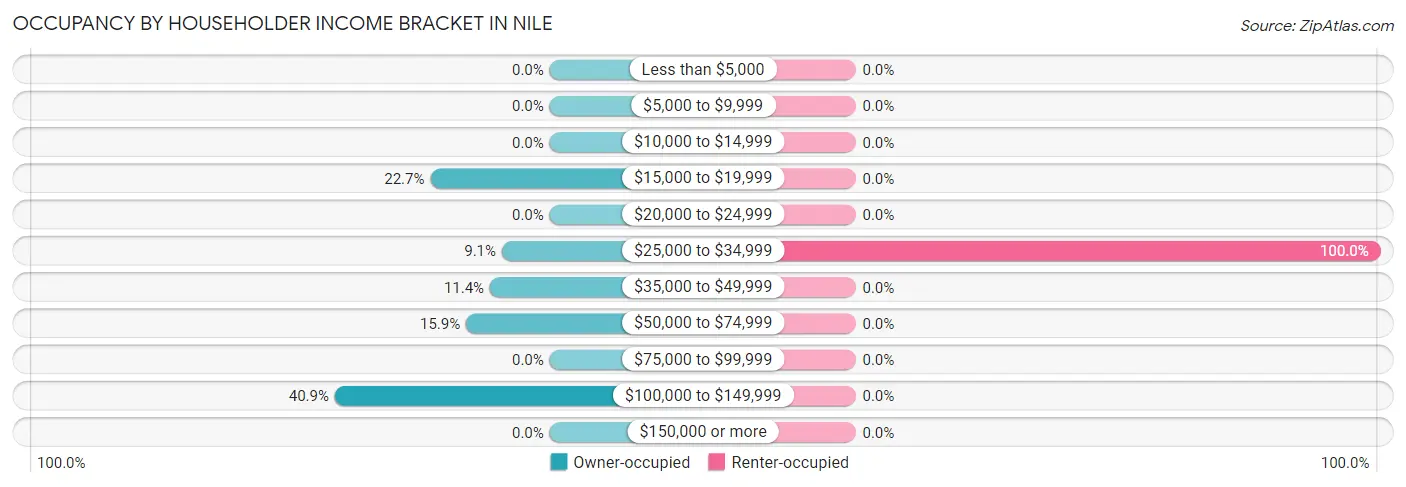
| Income Bracket | Owner-occupied | Renter-occupied |
| Less than $5,000 | 0 (0.0%) | 0 (0.0%) |
| $5,000 to $9,999 | 0 (0.0%) | 0 (0.0%) |
| $10,000 to $14,999 | 0 (0.0%) | 0 (0.0%) |
| $15,000 to $19,999 | 10 (22.7%) | 0 (0.0%) |
| $20,000 to $24,999 | 0 (0.0%) | 0 (0.0%) |
| $25,000 to $34,999 | 4 (9.1%) | 24 (100.0%) |
| $35,000 to $49,999 | 5 (11.4%) | 0 (0.0%) |
| $50,000 to $74,999 | 7 (15.9%) | 0 (0.0%) |
| $75,000 to $99,999 | 0 (0.0%) | 0 (0.0%) |
| $100,000 to $149,999 | 18 (40.9%) | 0 (0.0%) |
| $150,000 or more | 0 (0.0%) | 0 (0.0%) |
| Total | 44 (100.0%) | 24 (100.0%) |
Monthly Housing Cost Tiers in Nile
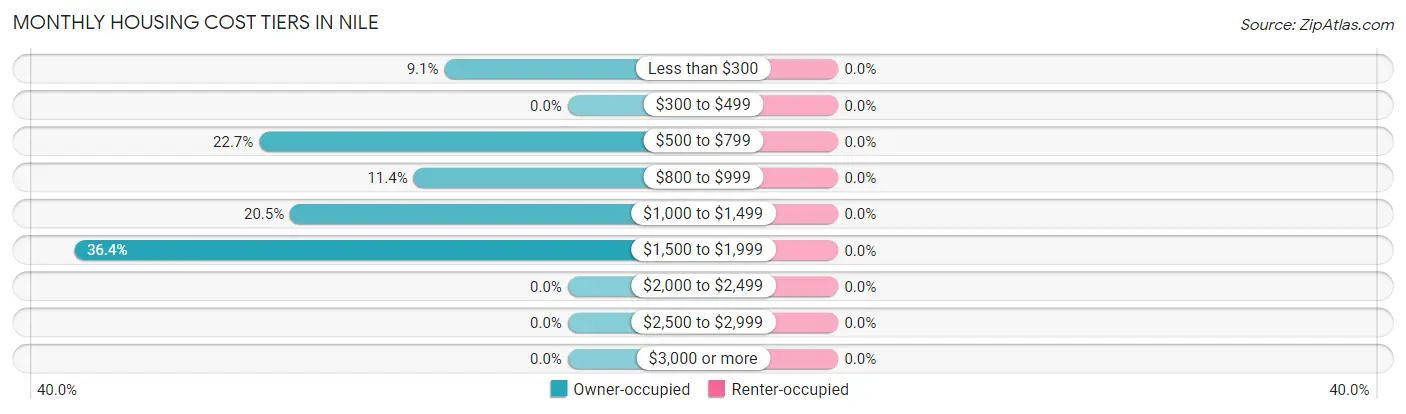
| Monthly Cost | Owner-occupied | Renter-occupied |
| Less than $300 | 4 (9.1%) | 0 (0.0%) |
| $300 to $499 | 0 (0.0%) | 0 (0.0%) |
| $500 to $799 | 10 (22.7%) | 0 (0.0%) |
| $800 to $999 | 5 (11.4%) | 0 (0.0%) |
| $1,000 to $1,499 | 9 (20.4%) | 0 (0.0%) |
| $1,500 to $1,999 | 16 (36.4%) | 0 (0.0%) |
| $2,000 to $2,499 | 0 (0.0%) | 0 (0.0%) |
| $2,500 to $2,999 | 0 (0.0%) | 0 (0.0%) |
| $3,000 or more | 0 (0.0%) | 0 (0.0%) |
| Total | 44 (100.0%) | 24 (100.0%) |
Physical Housing Characteristics in Nile
Housing Structures in Nile
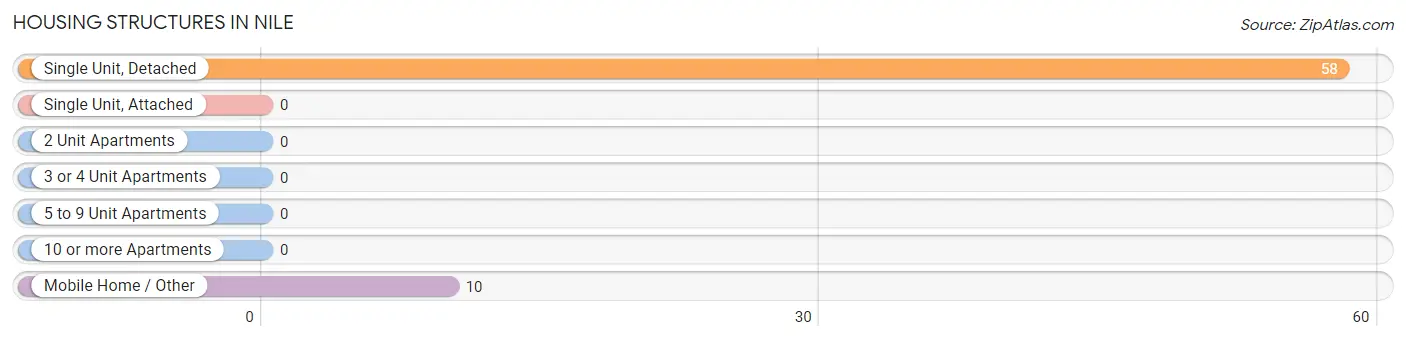
| Structure Type | # Housing Units | % Housing Units |
| Single Unit, Detached | 58 | 85.3% |
| Single Unit, Attached | 0 | 0.0% |
| 2 Unit Apartments | 0 | 0.0% |
| 3 or 4 Unit Apartments | 0 | 0.0% |
| 5 to 9 Unit Apartments | 0 | 0.0% |
| 10 or more Apartments | 0 | 0.0% |
| Mobile Home / Other | 10 | 14.7% |
| Total | 68 | 100.0% |
Housing Structures by Occupancy in Nile
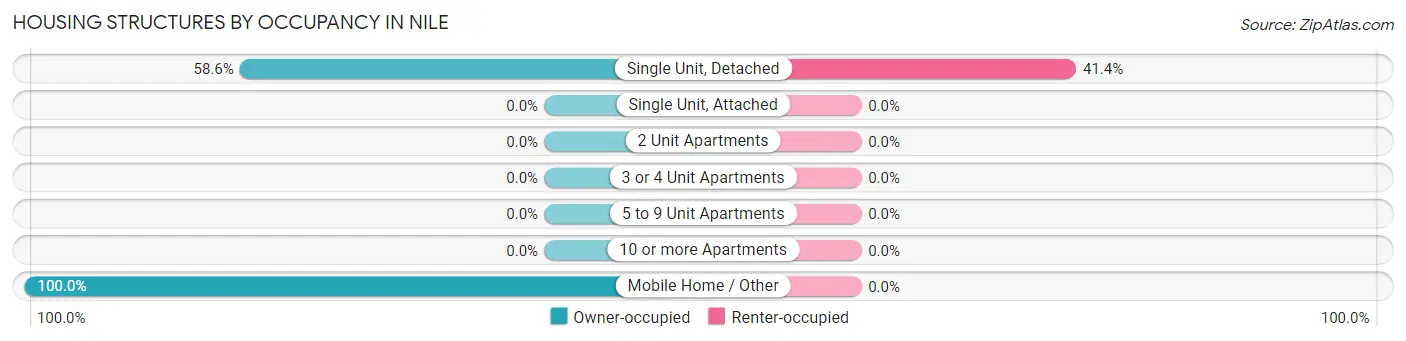
| Structure Type | Owner-occupied | Renter-occupied |
| Single Unit, Detached | 34 (58.6%) | 24 (41.4%) |
| Single Unit, Attached | 0 (0.0%) | 0 (0.0%) |
| 2 Unit Apartments | 0 (0.0%) | 0 (0.0%) |
| 3 or 4 Unit Apartments | 0 (0.0%) | 0 (0.0%) |
| 5 to 9 Unit Apartments | 0 (0.0%) | 0 (0.0%) |
| 10 or more Apartments | 0 (0.0%) | 0 (0.0%) |
| Mobile Home / Other | 10 (100.0%) | 0 (0.0%) |
| Total | 44 (64.7%) | 24 (35.3%) |
Housing Structures by Number of Rooms in Nile
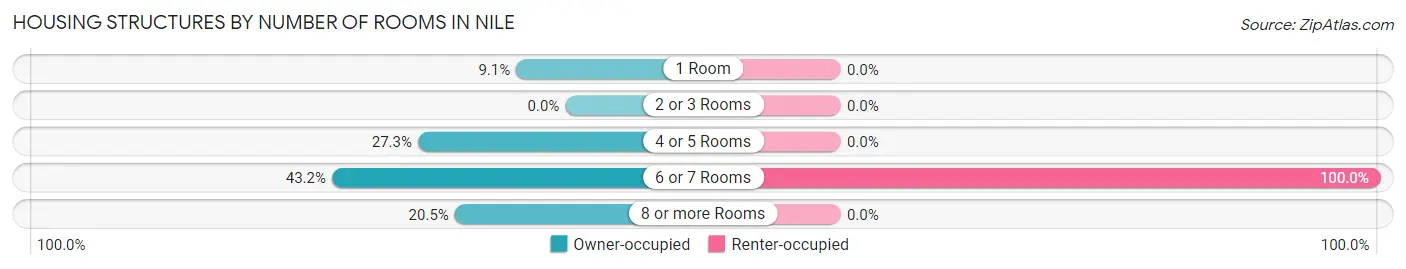
| Number of Rooms | Owner-occupied | Renter-occupied |
| 1 Room | 4 (9.1%) | 0 (0.0%) |
| 2 or 3 Rooms | 0 (0.0%) | 0 (0.0%) |
| 4 or 5 Rooms | 12 (27.3%) | 0 (0.0%) |
| 6 or 7 Rooms | 19 (43.2%) | 24 (100.0%) |
| 8 or more Rooms | 9 (20.4%) | 0 (0.0%) |
| Total | 44 (100.0%) | 24 (100.0%) |
Housing Structure by Heating Type in Nile
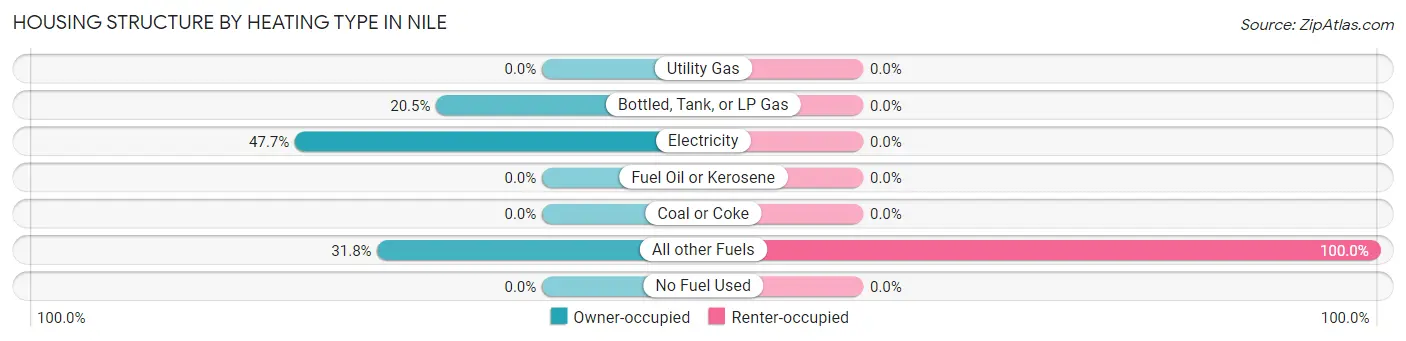
| Heating Type | Owner-occupied | Renter-occupied |
| Utility Gas | 0 (0.0%) | 0 (0.0%) |
| Bottled, Tank, or LP Gas | 9 (20.4%) | 0 (0.0%) |
| Electricity | 21 (47.7%) | 0 (0.0%) |
| Fuel Oil or Kerosene | 0 (0.0%) | 0 (0.0%) |
| Coal or Coke | 0 (0.0%) | 0 (0.0%) |
| All other Fuels | 14 (31.8%) | 24 (100.0%) |
| No Fuel Used | 0 (0.0%) | 0 (0.0%) |
| Total | 44 (100.0%) | 24 (100.0%) |
Household Vehicle Usage in Nile
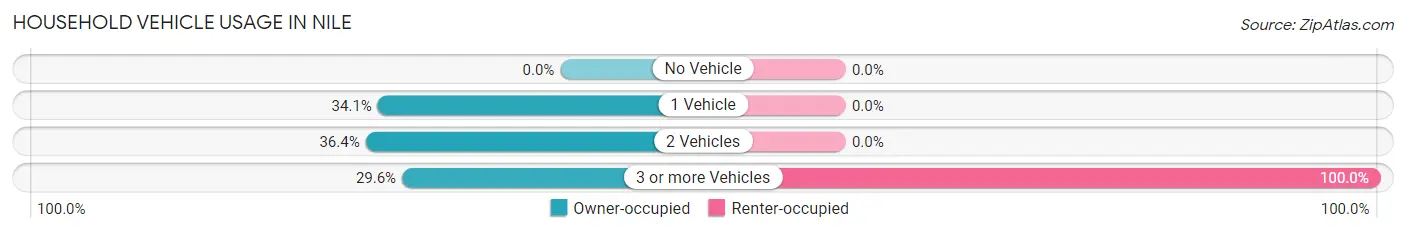
| Vehicles per Household | Owner-occupied | Renter-occupied |
| No Vehicle | 0 (0.0%) | 0 (0.0%) |
| 1 Vehicle | 15 (34.1%) | 0 (0.0%) |
| 2 Vehicles | 16 (36.4%) | 0 (0.0%) |
| 3 or more Vehicles | 13 (29.5%) | 24 (100.0%) |
| Total | 44 (100.0%) | 24 (100.0%) |
Real Estate & Mortgages in Nile
Real Estate and Mortgage Overview in Nile
| Characteristic | Without Mortgage | With Mortgage |
| Housing Units | 18 | 26 |
| Median Property Value | - | - |
| Median Household Income | - | - |
| Monthly Housing Costs | $1,200 | $0 |
| Real Estate Taxes | - | - |
Property Value by Mortgage Status in Nile
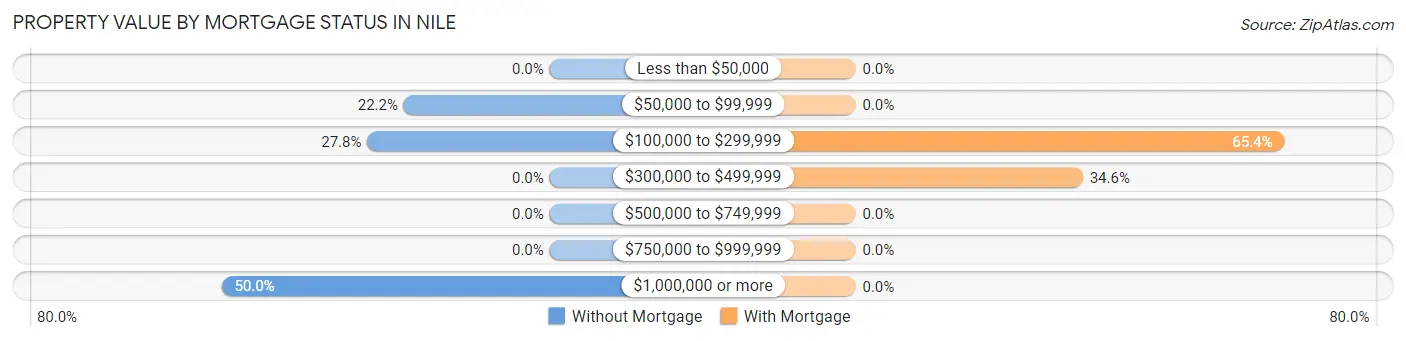
| Property Value | Without Mortgage | With Mortgage |
| Less than $50,000 | 0 (0.0%) | 0 (0.0%) |
| $50,000 to $99,999 | 4 (22.2%) | 0 (0.0%) |
| $100,000 to $299,999 | 5 (27.8%) | 17 (65.4%) |
| $300,000 to $499,999 | 0 (0.0%) | 9 (34.6%) |
| $500,000 to $749,999 | 0 (0.0%) | 0 (0.0%) |
| $750,000 to $999,999 | 0 (0.0%) | 0 (0.0%) |
| $1,000,000 or more | 9 (50.0%) | 0 (0.0%) |
| Total | 18 (100.0%) | 26 (100.0%) |
Household Income by Mortgage Status in Nile
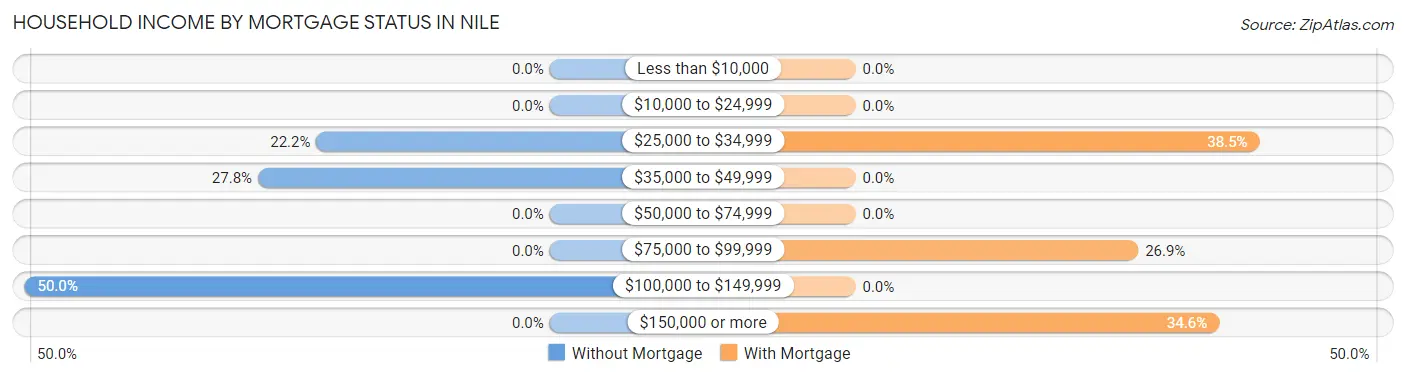
| Household Income | Without Mortgage | With Mortgage |
| Less than $10,000 | 0 (0.0%) | 0 (0.0%) |
| $10,000 to $24,999 | 0 (0.0%) | 0 (0.0%) |
| $25,000 to $34,999 | 4 (22.2%) | 10 (38.5%) |
| $35,000 to $49,999 | 5 (27.8%) | 0 (0.0%) |
| $50,000 to $74,999 | 0 (0.0%) | 0 (0.0%) |
| $75,000 to $99,999 | 0 (0.0%) | 7 (26.9%) |
| $100,000 to $149,999 | 9 (50.0%) | 0 (0.0%) |
| $150,000 or more | 0 (0.0%) | 9 (34.6%) |
| Total | 18 (100.0%) | 26 (100.0%) |
Property Value to Household Income Ratio in Nile
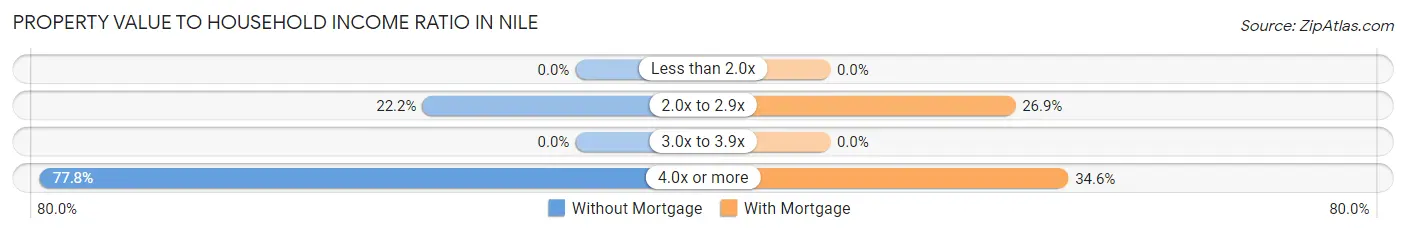
| Value-to-Income Ratio | Without Mortgage | With Mortgage |
| Less than 2.0x | 0 (0.0%) | 0 (0.0%) |
| 2.0x to 2.9x | 4 (22.2%) | 7 (26.9%) |
| 3.0x to 3.9x | 0 (0.0%) | 0 (0.0%) |
| 4.0x or more | 14 (77.8%) | 9 (34.6%) |
| Total | 18 (100.0%) | 26 (100.0%) |
Real Estate Taxes by Mortgage Status in Nile
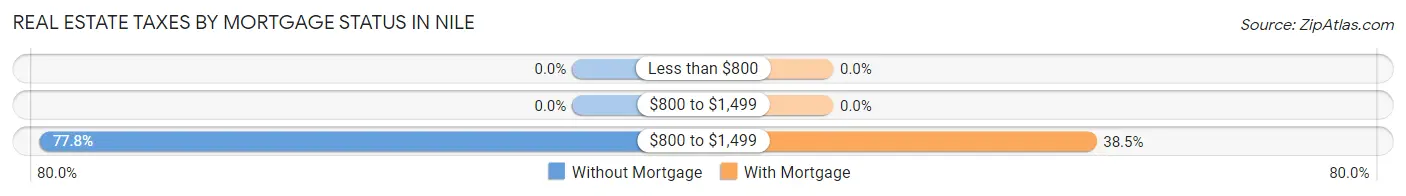
| Property Taxes | Without Mortgage | With Mortgage |
| Less than $800 | 0 (0.0%) | 0 (0.0%) |
| $800 to $1,499 | 0 (0.0%) | 0 (0.0%) |
| $800 to $1,499 | 14 (77.8%) | 10 (38.5%) |
| Total | 18 (100.0%) | 26 (100.0%) |
Health & Disability in Nile
Health Insurance Coverage by Age in Nile
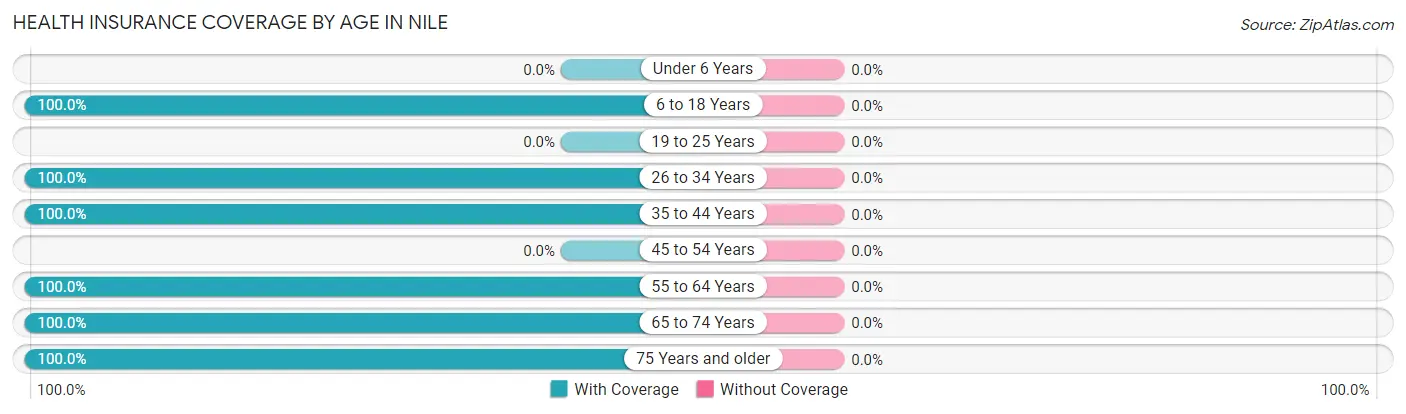
| Age Bracket | With Coverage | Without Coverage |
| Under 6 Years | 0 (0.0%) | 0 (0.0%) |
| 6 to 18 Years | 21 (100.0%) | 0 (0.0%) |
| 19 to 25 Years | 0 (0.0%) | 0 (0.0%) |
| 26 to 34 Years | 24 (100.0%) | 0 (0.0%) |
| 35 to 44 Years | 20 (100.0%) | 0 (0.0%) |
| 45 to 54 Years | 0 (0.0%) | 0 (0.0%) |
| 55 to 64 Years | 26 (100.0%) | 0 (0.0%) |
| 65 to 74 Years | 17 (100.0%) | 0 (0.0%) |
| 75 Years and older | 7 (100.0%) | 0 (0.0%) |
| Total | 115 (100.0%) | 0 (0.0%) |
Health Insurance Coverage by Citizenship Status in Nile
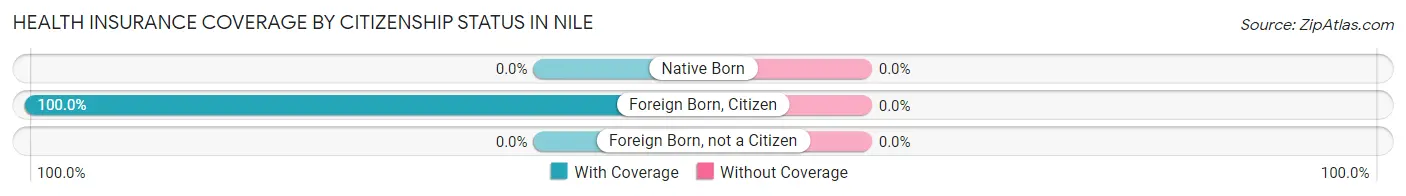
| Citizenship Status | With Coverage | Without Coverage |
| Native Born | 0 (0.0%) | 0 (0.0%) |
| Foreign Born, Citizen | 21 (100.0%) | 0 (0.0%) |
| Foreign Born, not a Citizen | 0 (0.0%) | 0 (0.0%) |
Health Insurance Coverage by Household Income in Nile
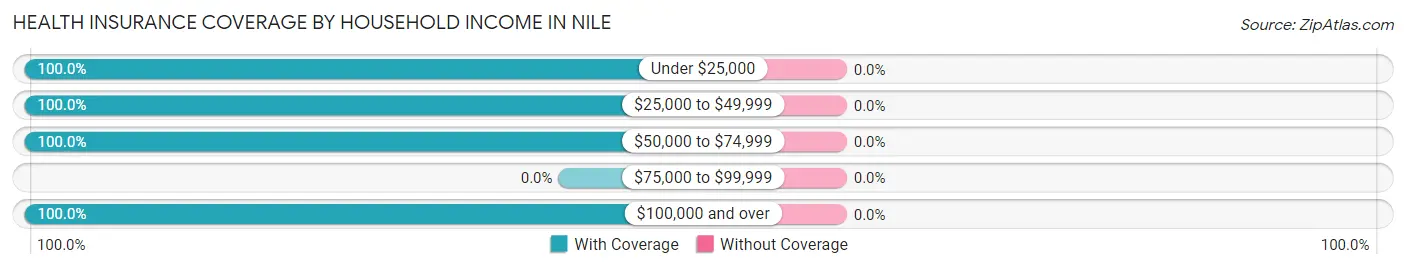
| Household Income | With Coverage | Without Coverage |
| Under $25,000 | 10 (100.0%) | 0 (0.0%) |
| $25,000 to $49,999 | 33 (100.0%) | 0 (0.0%) |
| $50,000 to $74,999 | 14 (100.0%) | 0 (0.0%) |
| $75,000 to $99,999 | 0 (0.0%) | 0 (0.0%) |
| $100,000 and over | 58 (100.0%) | 0 (0.0%) |
Public vs Private Health Insurance Coverage by Age in Nile
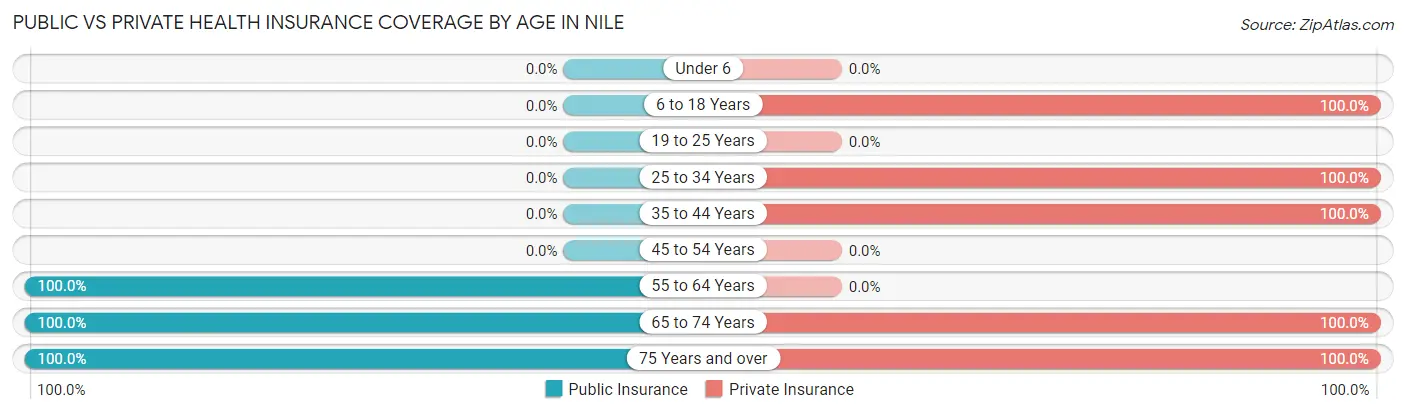
| Age Bracket | Public Insurance | Private Insurance |
| Under 6 | 0 (0.0%) | 0 (0.0%) |
| 6 to 18 Years | 0 (0.0%) | 21 (100.0%) |
| 19 to 25 Years | 0 (0.0%) | 0 (0.0%) |
| 25 to 34 Years | 0 (0.0%) | 24 (100.0%) |
| 35 to 44 Years | 0 (0.0%) | 20 (100.0%) |
| 45 to 54 Years | 0 (0.0%) | 0 (0.0%) |
| 55 to 64 Years | 26 (100.0%) | 0 (0.0%) |
| 65 to 74 Years | 17 (100.0%) | 17 (100.0%) |
| 75 Years and over | 7 (100.0%) | 7 (100.0%) |
| Total | 50 (43.5%) | 89 (77.4%) |
Disability Status by Sex by Age in Nile
| Age Bracket | Male | Female |
| Under 5 Years | 0 (0.0%) | 0 (0.0%) |
| 5 to 17 Years | 0 (0.0%) | 0 (0.0%) |
| 18 to 34 Years | 0 (0.0%) | 0 (0.0%) |
| 35 to 64 Years | 0 (0.0%) | 0 (0.0%) |
| 65 to 74 Years | 0 (0.0%) | 0 (0.0%) |
| 75 Years and over | 0 (0.0%) | 0 (0.0%) |
Disability Class by Sex by Age in Nile
Disability Class: Hearing Difficulty
| Age Bracket | Male | Female |
| Under 5 Years | 0 (0.0%) | 0 (0.0%) |
| 5 to 17 Years | 0 (0.0%) | 0 (0.0%) |
| 18 to 34 Years | 0 (0.0%) | 0 (0.0%) |
| 35 to 64 Years | 0 (0.0%) | 0 (0.0%) |
| 65 to 74 Years | 0 (0.0%) | 0 (0.0%) |
| 75 Years and over | 0 (0.0%) | 0 (0.0%) |
Disability Class: Vision Difficulty
| Age Bracket | Male | Female |
| Under 5 Years | 0 (0.0%) | 0 (0.0%) |
| 5 to 17 Years | 0 (0.0%) | 0 (0.0%) |
| 18 to 34 Years | 0 (0.0%) | 0 (0.0%) |
| 35 to 64 Years | 0 (0.0%) | 0 (0.0%) |
| 65 to 74 Years | 0 (0.0%) | 0 (0.0%) |
| 75 Years and over | 0 (0.0%) | 0 (0.0%) |
Disability Class: Cognitive Difficulty
| Age Bracket | Male | Female |
| 5 to 17 Years | 0 (0.0%) | 0 (0.0%) |
| 18 to 34 Years | 0 (0.0%) | 0 (0.0%) |
| 35 to 64 Years | 0 (0.0%) | 0 (0.0%) |
| 65 to 74 Years | 0 (0.0%) | 0 (0.0%) |
| 75 Years and over | 0 (0.0%) | 0 (0.0%) |
Disability Class: Ambulatory Difficulty
| Age Bracket | Male | Female |
| 5 to 17 Years | 0 (0.0%) | 0 (0.0%) |
| 18 to 34 Years | 0 (0.0%) | 0 (0.0%) |
| 35 to 64 Years | 0 (0.0%) | 0 (0.0%) |
| 65 to 74 Years | 0 (0.0%) | 0 (0.0%) |
| 75 Years and over | 0 (0.0%) | 0 (0.0%) |
Disability Class: Self-Care Difficulty
| Age Bracket | Male | Female |
| 5 to 17 Years | 0 (0.0%) | 0 (0.0%) |
| 18 to 34 Years | 0 (0.0%) | 0 (0.0%) |
| 35 to 64 Years | 0 (0.0%) | 0 (0.0%) |
| 65 to 74 Years | 0 (0.0%) | 0 (0.0%) |
| 75 Years and over | 0 (0.0%) | 0 (0.0%) |
Technology Access in Nile
Computing Device Access in Nile
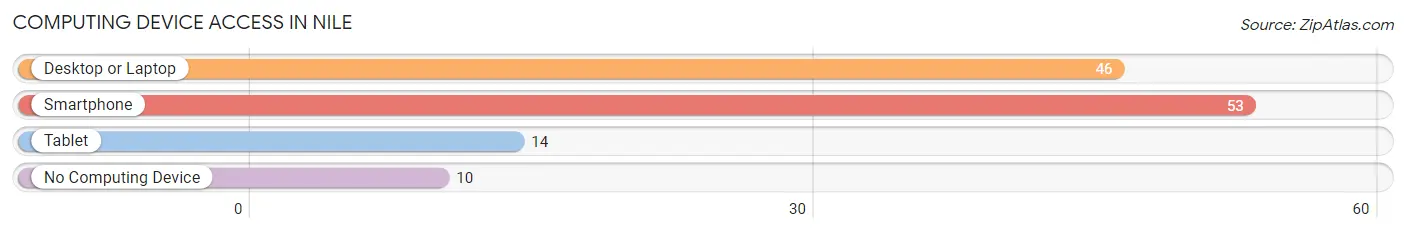
| Device Type | # Households | % Households |
| Desktop or Laptop | 46 | 67.6% |
| Smartphone | 53 | 77.9% |
| Tablet | 14 | 20.6% |
| No Computing Device | 10 | 14.7% |
| Total | 68 | 100.0% |
Internet Access in Nile
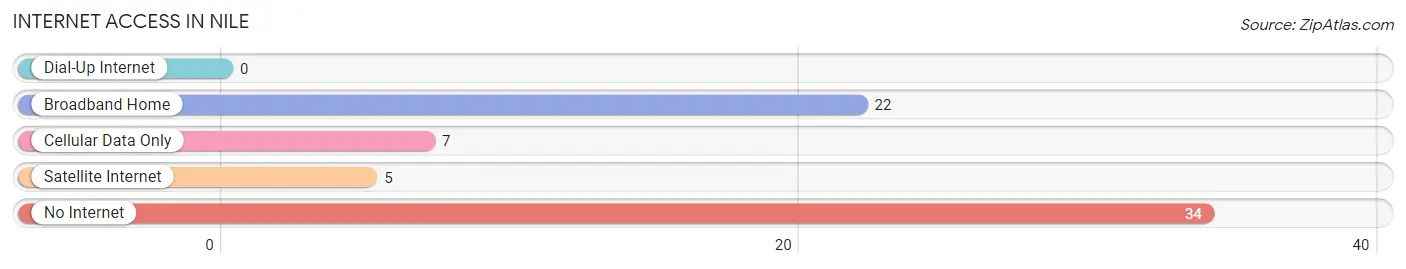
| Internet Type | # Households | % Households |
| Dial-Up Internet | 0 | 0.0% |
| Broadband Home | 22 | 32.4% |
| Cellular Data Only | 7 | 10.3% |
| Satellite Internet | 5 | 7.3% |
| No Internet | 34 | 50.0% |
| Total | 68 | 100.0% |
Nile Summary
Nile is a small unincorporated community located in Grant County, Washington, United States. It is situated in the foothills of the Cascade Mountains, approximately 10 miles (16 km) east of the city of Moses Lake. The population of Nile was estimated to be around 200 in 2020.
History
Nile was first settled in the late 1800s by homesteaders who were attracted to the area by its fertile soil and abundant water. The town was named after the nearby Nile Creek, which was named by early settlers who thought the creek resembled the Nile River in Egypt.
In the early 1900s, Nile was a thriving agricultural community, with many farms and ranches in the area. The town was also home to a number of businesses, including a general store, a blacksmith shop, a hotel, and a post office.
In the 1950s, Nile began to decline as many of the farms and ranches in the area were sold off or abandoned. The town’s population dwindled and the businesses closed.
Geography
Nile is located in the foothills of the Cascade Mountains, approximately 10 miles (16 km) east of the city of Moses Lake. The town is situated on the banks of Nile Creek, which flows through the area and eventually empties into Moses Lake.
The area around Nile is mostly flat, with rolling hills and open fields. The climate is semi-arid, with hot summers and cold winters.
Economy
Nile’s economy is largely based on agriculture. The area is home to several farms and ranches, which produce a variety of crops, including wheat, barley, alfalfa, and hay.
In addition to agriculture, Nile is also home to a number of small businesses, including a gas station, a convenience store, and a restaurant.
Demographics
As of the 2010 census, the population of Nile was estimated to be around 200. The racial makeup of the town was 94.5% White, 0.5% African American, 0.5% Native American, 0.5% Asian, and 4.0% from other races.
The median household income in Nile was $37,500, and the median family income was $41,250. The per capita income was $17,500.
Conclusion
Nile is a small unincorporated community located in Grant County, Washington, United States. It is situated in the foothills of the Cascade Mountains, approximately 10 miles (16 km) east of the city of Moses Lake. The population of Nile was estimated to be around 200 in 2020. The town’s economy is largely based on agriculture, with several farms and ranches in the area. The racial makeup of the town was 94.5% White, 0.5% African American, 0.5% Native American, 0.5% Asian, and 4.0% from other races. The median household income in Nile was $37,500, and the median family income was $41,250. The per capita income was $17,500.
Common Questions
What is Per Capita Income in Nile?
Per Capita income in Nile is $36,913.
What is the Median Family Income in Nile?
Median Family Income in Nile is $131,528.
What is Inequality or Gini Index in Nile?
Inequality or Gini Index in Nile is 0.38.
What is the Total Population of Nile?
Total Population of Nile is 115.
What is the Total Male Population of Nile?
Total Male Population of Nile is 57.
What is the Total Female Population of Nile?
Total Female Population of Nile is 58.
What is the Ratio of Males per 100 Females in Nile?
There are 98.28 Males per 100 Females in Nile.
What is the Ratio of Females per 100 Males in Nile?
There are 101.75 Females per 100 Males in Nile.
What is the Median Population Age in Nile?
Median Population Age in Nile is 35.6 Years.
What is the Average Family Size in Nile
Average Family Size in Nile is 2.9 People.
What is the Average Household Size in Nile
Average Household Size in Nile is 1.7 People.
How Large is the Labor Force in Nile?
There are 48 People in the Labor Forcein in Nile.
What is the Percentage of People in the Labor Force in Nile?
51.1% of People are in the Labor Force in Nile.
What is the Unemployment Rate in Nile?
Unemployment Rate in Nile is 50.0%.