Zip Codes with the Highest Percentage of Families with Income Above $100,000 in Washington
RELATED REPORTS & OPTIONS
Family Income | $100k+
Washington
Compare Zip Codes
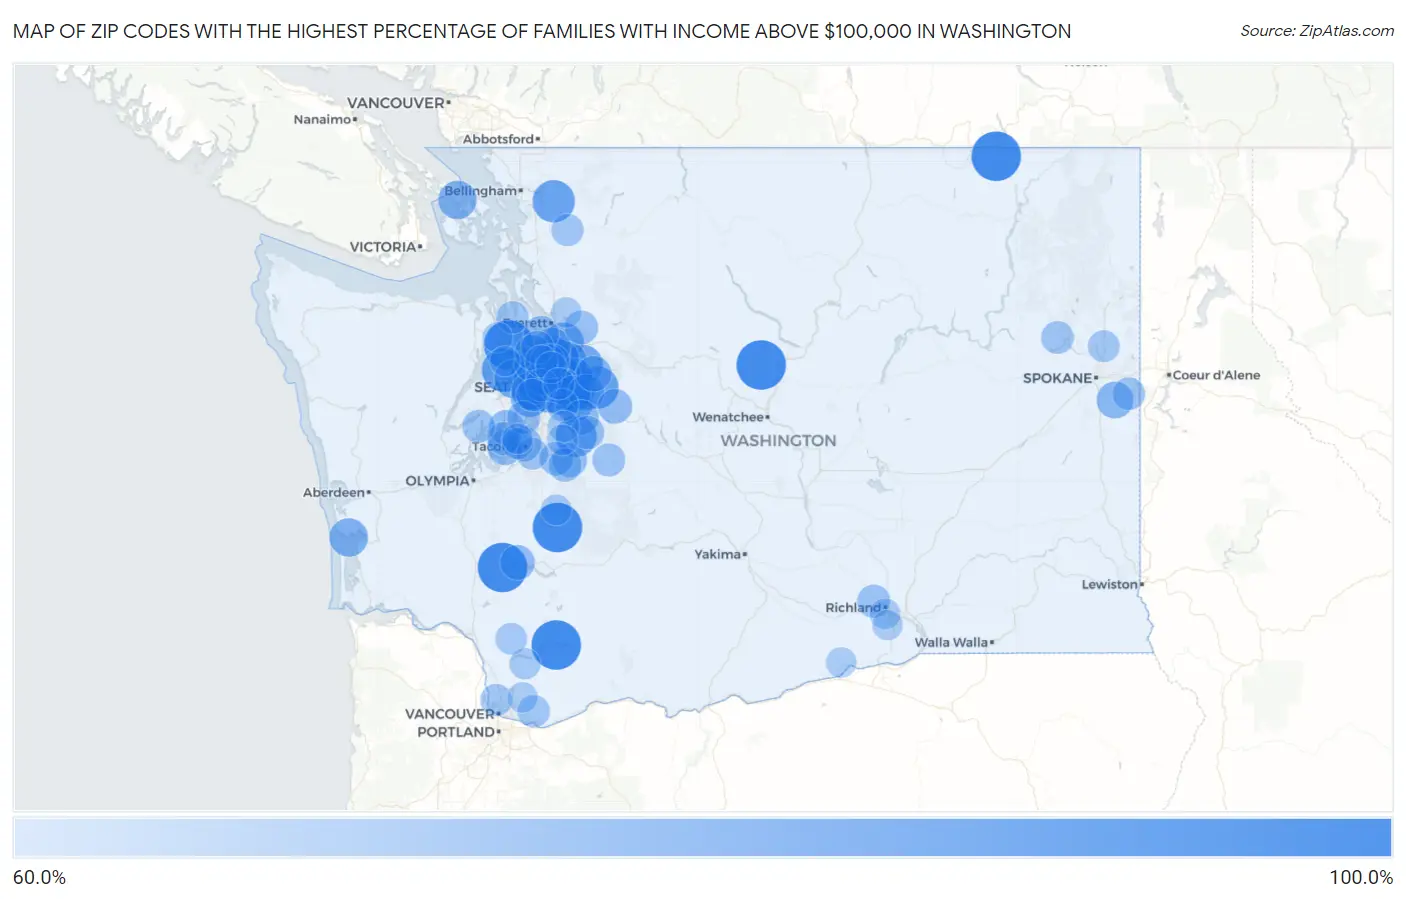
Map of Zip Codes with the Highest Percentage of Families with Income Above $100,000 in Washington
60.0%
100.0%
Zip Codes with the Highest Percentage of Families with Income Above $100,000 in Washington
| Zip Code | Families with Income > $100k | vs State | vs National | |
| 1. | 98616 | 100.0% | 54.2%(+45.8)#1 | 46.1%(+53.9)#2 |
| 2. | 98164 | 100.0% | 54.2%(+45.8)#2 | 46.1%(+53.9)#51 |
| 3. | 98582 | 100.0% | 54.2%(+45.8)#3 | 46.1%(+53.9)#52 |
| 4. | 98811 | 100.0% | 54.2%(+45.8)#4 | 46.1%(+53.9)#114 |
| 5. | 99146 | 100.0% | 54.2%(+45.8)#5 | 46.1%(+53.9)#175 |
| 6. | 98364 | 100.0% | 54.2%(+45.8)#6 | 46.1%(+53.9)#180 |
| 7. | 98330 | 100.0% | 54.2%(+45.8)#7 | 46.1%(+53.9)#239 |
| 8. | 98075 | 91.1% | 54.2%(+36.9)#8 | 46.1%(+45.0)#337 |
| 9. | 98345 | 88.9% | 54.2%(+34.7)#9 | 46.1%(+42.8)#397 |
| 10. | 98074 | 86.8% | 54.2%(+32.6)#10 | 46.1%(+40.7)#479 |
| 11. | 98039 | 86.3% | 54.2%(+32.1)#11 | 46.1%(+40.2)#512 |
| 12. | 98065 | 86.2% | 54.2%(+32.0)#12 | 46.1%(+40.1)#519 |
| 13. | 98220 | 86.2% | 54.2%(+32.0)#13 | 46.1%(+40.1)#520 |
| 14. | 98112 | 85.8% | 54.2%(+31.6)#14 | 46.1%(+39.7)#544 |
| 15. | 98010 | 83.9% | 54.2%(+29.7)#15 | 46.1%(+37.8)#679 |
| 16. | 98109 | 83.2% | 54.2%(+29.0)#16 | 46.1%(+37.1)#724 |
| 17. | 98019 | 83.1% | 54.2%(+28.9)#17 | 46.1%(+37.0)#732 |
| 18. | 98102 | 82.6% | 54.2%(+28.4)#18 | 46.1%(+36.5)#763 |
| 19. | 98033 | 82.5% | 54.2%(+28.3)#19 | 46.1%(+36.4)#772 |
| 20. | 98115 | 82.1% | 54.2%(+27.9)#20 | 46.1%(+36.0)#799 |
| 21. | 98107 | 82.0% | 54.2%(+27.8)#21 | 46.1%(+35.9)#803 |
| 22. | 98296 | 82.0% | 54.2%(+27.8)#22 | 46.1%(+35.9)#804 |
| 23. | 98040 | 81.9% | 54.2%(+27.7)#23 | 46.1%(+35.8)#813 |
| 24. | 98199 | 81.8% | 54.2%(+27.6)#24 | 46.1%(+35.7)#822 |
| 25. | 98103 | 80.2% | 54.2%(+26.0)#25 | 46.1%(+34.1)#998 |
| 26. | 98077 | 80.2% | 54.2%(+26.0)#26 | 46.1%(+34.1)#1,005 |
| 27. | 98117 | 80.1% | 54.2%(+25.9)#27 | 46.1%(+34.0)#1,017 |
| 28. | 98004 | 80.0% | 54.2%(+25.8)#28 | 46.1%(+33.9)#1,022 |
| 29. | 98053 | 80.0% | 54.2%(+25.8)#29 | 46.1%(+33.9)#1,024 |
| 30. | 98110 | 79.9% | 54.2%(+25.7)#30 | 46.1%(+33.8)#1,043 |
| 31. | 98006 | 79.6% | 54.2%(+25.4)#31 | 46.1%(+33.5)#1,064 |
| 32. | 98136 | 79.6% | 54.2%(+25.4)#32 | 46.1%(+33.5)#1,068 |
| 33. | 98119 | 79.3% | 54.2%(+25.1)#33 | 46.1%(+33.2)#1,103 |
| 34. | 98052 | 79.2% | 54.2%(+25.0)#34 | 46.1%(+33.1)#1,114 |
| 35. | 98590 | 79.0% | 54.2%(+24.8)#35 | 46.1%(+32.9)#1,147 |
| 36. | 98072 | 78.9% | 54.2%(+24.7)#36 | 46.1%(+32.8)#1,153 |
| 37. | 98297 | 78.5% | 54.2%(+24.3)#37 | 46.1%(+32.4)#1,216 |
| 38. | 98021 | 77.7% | 54.2%(+23.5)#38 | 46.1%(+31.6)#1,300 |
| 39. | 98121 | 77.4% | 54.2%(+23.2)#39 | 46.1%(+31.3)#1,352 |
| 40. | 98101 | 77.4% | 54.2%(+23.2)#40 | 46.1%(+31.3)#1,354 |
| 41. | 98116 | 77.1% | 54.2%(+22.9)#41 | 46.1%(+31.0)#1,388 |
| 42. | 98005 | 77.1% | 54.2%(+22.9)#42 | 46.1%(+31.0)#1,389 |
| 43. | 98027 | 76.8% | 54.2%(+22.6)#43 | 46.1%(+30.7)#1,428 |
| 44. | 98012 | 75.5% | 54.2%(+21.3)#44 | 46.1%(+29.4)#1,616 |
| 45. | 98177 | 75.5% | 54.2%(+21.3)#45 | 46.1%(+29.4)#1,622 |
| 46. | 99036 | 75.5% | 54.2%(+21.3)#46 | 46.1%(+29.4)#1,634 |
| 47. | 98008 | 75.4% | 54.2%(+21.2)#47 | 46.1%(+29.3)#1,639 |
| 48. | 98029 | 75.3% | 54.2%(+21.1)#48 | 46.1%(+29.2)#1,655 |
| 49. | 98024 | 74.8% | 54.2%(+20.6)#49 | 46.1%(+28.7)#1,742 |
| 50. | 98105 | 74.4% | 54.2%(+20.2)#50 | 46.1%(+28.3)#1,793 |
| 51. | 98014 | 73.5% | 54.2%(+19.3)#51 | 46.1%(+27.4)#1,953 |
| 52. | 98275 | 73.3% | 54.2%(+19.1)#52 | 46.1%(+27.2)#1,982 |
| 53. | 98020 | 73.3% | 54.2%(+19.1)#53 | 46.1%(+27.2)#1,983 |
| 54. | 98333 | 72.6% | 54.2%(+18.4)#54 | 46.1%(+26.5)#2,125 |
| 55. | 98038 | 72.5% | 54.2%(+18.3)#55 | 46.1%(+26.4)#2,131 |
| 56. | 98332 | 72.5% | 54.2%(+18.3)#56 | 46.1%(+26.4)#2,137 |
| 57. | 98403 | 72.3% | 54.2%(+18.1)#57 | 46.1%(+26.2)#2,175 |
| 58. | 98585 | 72.0% | 54.2%(+17.8)#58 | 46.1%(+25.9)#2,228 |
| 59. | 98045 | 71.7% | 54.2%(+17.5)#59 | 46.1%(+25.6)#2,280 |
| 60. | 98028 | 71.4% | 54.2%(+17.2)#60 | 46.1%(+25.3)#2,322 |
| 61. | 98011 | 71.0% | 54.2%(+16.8)#61 | 46.1%(+24.9)#2,401 |
| 62. | 98321 | 70.8% | 54.2%(+16.6)#62 | 46.1%(+24.7)#2,442 |
| 63. | 98290 | 70.0% | 54.2%(+15.8)#63 | 46.1%(+23.9)#2,591 |
| 64. | 98391 | 69.5% | 54.2%(+15.3)#64 | 46.1%(+23.4)#2,707 |
| 65. | 98051 | 69.4% | 54.2%(+15.2)#65 | 46.1%(+23.3)#2,745 |
| 66. | 98385 | 69.3% | 54.2%(+15.1)#66 | 46.1%(+23.2)#2,760 |
| 67. | 98335 | 69.2% | 54.2%(+15.0)#67 | 46.1%(+23.1)#2,770 |
| 68. | 98070 | 69.0% | 54.2%(+14.8)#68 | 46.1%(+22.9)#2,819 |
| 69. | 99353 | 68.9% | 54.2%(+14.7)#69 | 46.1%(+22.8)#2,838 |
| 70. | 98026 | 68.7% | 54.2%(+14.5)#70 | 46.1%(+22.6)#2,878 |
| 71. | 98022 | 68.6% | 54.2%(+14.4)#71 | 46.1%(+22.5)#2,898 |
| 72. | 98524 | 68.5% | 54.2%(+14.3)#72 | 46.1%(+22.4)#2,928 |
| 73. | 99034 | 68.1% | 54.2%(+13.9)#73 | 46.1%(+22.0)#3,006 |
| 74. | 99023 | 67.9% | 54.2%(+13.7)#74 | 46.1%(+21.8)#3,046 |
| 75. | 98122 | 67.8% | 54.2%(+13.6)#75 | 46.1%(+21.7)#3,051 |
| 76. | 98126 | 67.8% | 54.2%(+13.6)#76 | 46.1%(+21.7)#3,062 |
| 77. | 98155 | 67.4% | 54.2%(+13.2)#77 | 46.1%(+21.3)#3,159 |
| 78. | 98249 | 67.4% | 54.2%(+13.2)#78 | 46.1%(+21.3)#3,174 |
| 79. | 98263 | 67.3% | 54.2%(+13.1)#79 | 46.1%(+21.2)#3,191 |
| 80. | 98059 | 67.2% | 54.2%(+13.0)#80 | 46.1%(+21.1)#3,195 |
| 81. | 98607 | 67.1% | 54.2%(+12.9)#81 | 46.1%(+21.0)#3,218 |
| 82. | 98685 | 66.7% | 54.2%(+12.5)#82 | 46.1%(+20.6)#3,297 |
| 83. | 99005 | 66.3% | 54.2%(+12.1)#83 | 46.1%(+20.2)#3,419 |
| 84. | 98443 | 66.3% | 54.2%(+12.1)#84 | 46.1%(+20.2)#3,424 |
| 85. | 98034 | 66.2% | 54.2%(+12.0)#85 | 46.1%(+20.1)#3,431 |
| 86. | 98007 | 66.1% | 54.2%(+11.9)#86 | 46.1%(+20.0)#3,466 |
| 87. | 98625 | 65.9% | 54.2%(+11.7)#87 | 46.1%(+19.8)#3,520 |
| 88. | 98406 | 65.8% | 54.2%(+11.6)#88 | 46.1%(+19.7)#3,534 |
| 89. | 98042 | 65.7% | 54.2%(+11.5)#89 | 46.1%(+19.6)#3,551 |
| 90. | 98601 | 64.9% | 54.2%(+10.7)#90 | 46.1%(+18.8)#3,777 |
| 91. | 98092 | 64.6% | 54.2%(+10.4)#91 | 46.1%(+18.5)#3,844 |
| 92. | 98407 | 64.4% | 54.2%(+10.2)#92 | 46.1%(+18.3)#3,901 |
| 93. | 98328 | 64.3% | 54.2%(+10.1)#93 | 46.1%(+18.2)#3,923 |
| 94. | 98258 | 64.0% | 54.2%(+9.80)#94 | 46.1%(+17.9)#3,996 |
| 95. | 99345 | 64.0% | 54.2%(+9.80)#95 | 46.1%(+17.9)#4,022 |
| 96. | 98365 | 63.8% | 54.2%(+9.60)#96 | 46.1%(+17.7)#4,075 |
| 97. | 99352 | 63.7% | 54.2%(+9.50)#97 | 46.1%(+17.6)#4,090 |
| 98. | 98370 | 63.7% | 54.2%(+9.50)#98 | 46.1%(+17.6)#4,091 |
| 99. | 99338 | 63.7% | 54.2%(+9.50)#99 | 46.1%(+17.6)#4,094 |
| 100. | 98606 | 63.7% | 54.2%(+9.50)#100 | 46.1%(+17.6)#4,100 |
Common Questions
What are the Top 10 Zip Codes with the Highest Percentage of Families with Income Above $100,000 in Washington?
Top 10 Zip Codes with the Highest Percentage of Families with Income Above $100,000 in Washington are:
What zip code has the Highest Percentage of Families with Income Above $100,000 in Washington?
98616 has the Highest Percentage of Families with Income Above $100,000 in Washington with 100.0%.
What is the Percentage of Families with Income Above $100,000 in the State of Washington?
Percentage of Families with Income Above $100,000 in Washington is 54.2%.
What is the Percentage of Families with Income Above $100,000 in the United States?
Percentage of Families with Income Above $100,000 in the United States is 46.1%.