Zip Codes with the Highest Percentage of Families with Income Above $100,000 in Edmonds, WA
RELATED REPORTS & OPTIONS
Family Income | $100k+
Edmonds
Compare Zip Codes
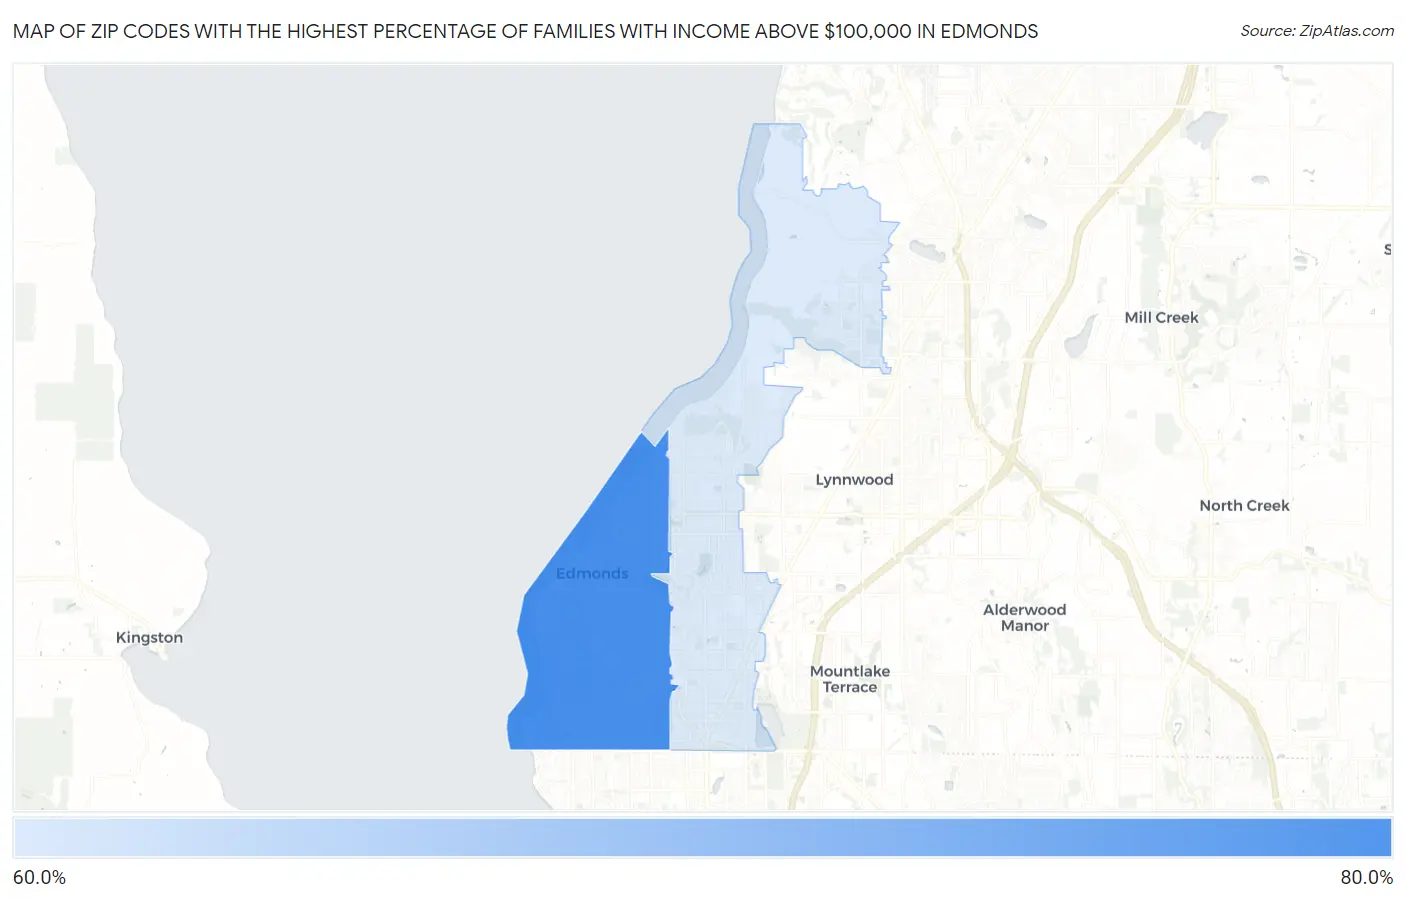
Map of Zip Codes with the Highest Percentage of Families with Income Above $100,000 in Edmonds
68.7%
73.3%
Zip Codes with the Highest Percentage of Families with Income Above $100,000 in Edmonds, WA
| Zip Code | Families with Income > $100k | vs State | vs National | |
| 1. | 98020 | 73.3% | 54.2%(+19.1)#53 | 46.1%(+27.2)#1,983 |
| 2. | 98026 | 68.7% | 54.2%(+14.5)#70 | 46.1%(+22.6)#2,878 |
1
Common Questions
What are the Top Zip Codes with the Highest Percentage of Families with Income Above $100,000 in Edmonds, WA?
Top Zip Codes with the Highest Percentage of Families with Income Above $100,000 in Edmonds, WA are:
What zip code has the Highest Percentage of Families with Income Above $100,000 in Edmonds, WA?
98020 has the Highest Percentage of Families with Income Above $100,000 in Edmonds, WA with 73.3%.
What is the Percentage of Families with Income Above $100,000 in Edmonds, WA?
Percentage of Families with Income Above $100,000 in Edmonds is 68.2%.
What is the Percentage of Families with Income Above $100,000 in Washington?
Percentage of Families with Income Above $100,000 in Washington is 54.2%.
What is the Percentage of Families with Income Above $100,000 in the United States?
Percentage of Families with Income Above $100,000 in the United States is 46.1%.