Zip Codes with the Highest Percentage of Families with Income Above $100,000 in Richland, WA
RELATED REPORTS & OPTIONS
Family Income | $100k+
Richland
Compare Zip Codes
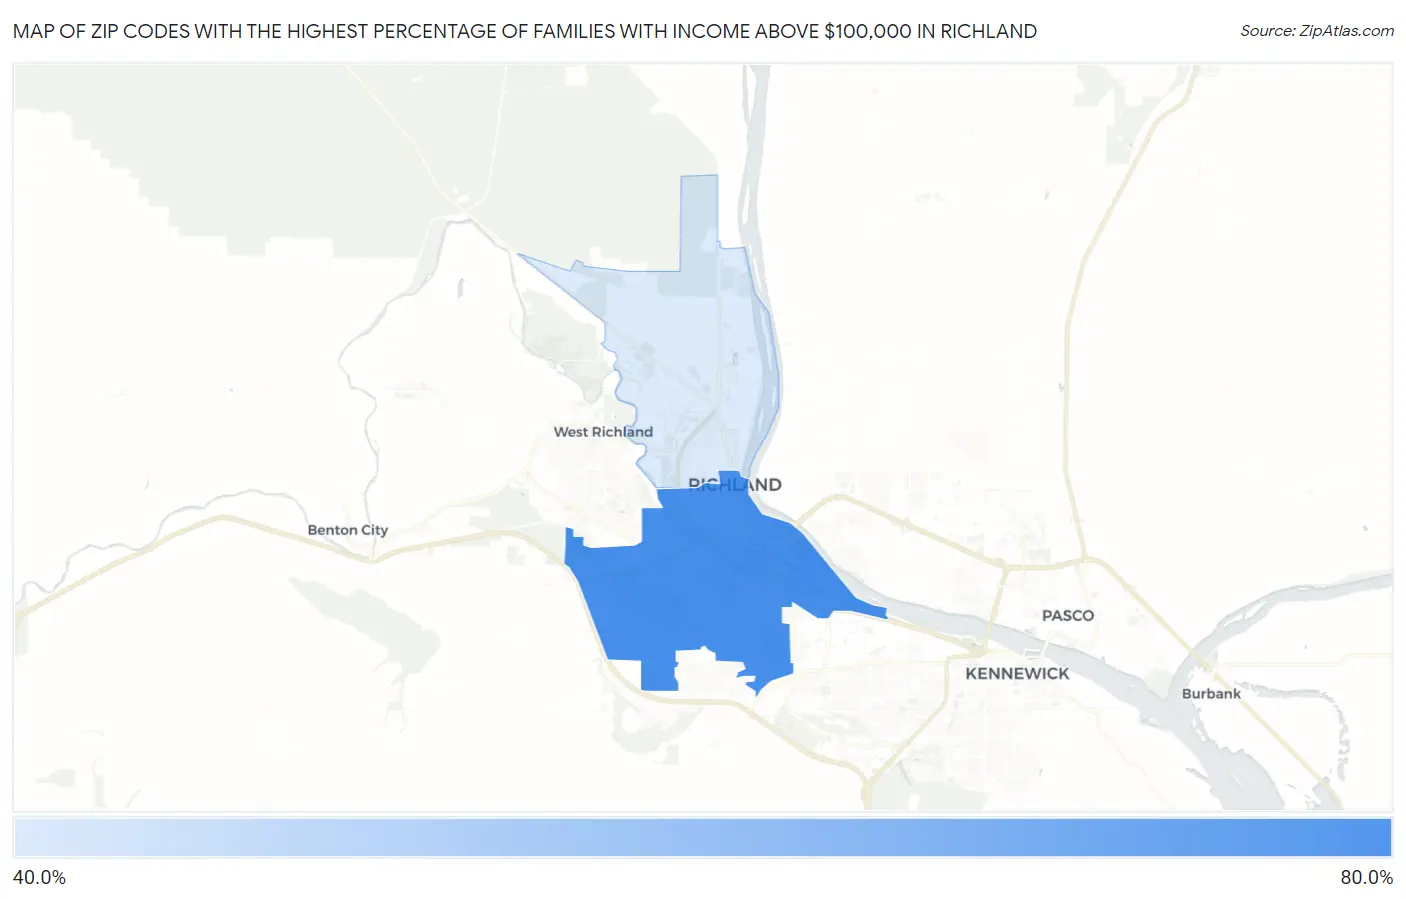
Map of Zip Codes with the Highest Percentage of Families with Income Above $100,000 in Richland
47.9%
63.7%
Zip Codes with the Highest Percentage of Families with Income Above $100,000 in Richland, WA
| Zip Code | Families with Income > $100k | vs State | vs National | |
| 1. | 99352 | 63.7% | 54.2%(+9.50)#97 | 46.1%(+17.6)#4,090 |
| 2. | 99354 | 47.9% | 54.2%(-6.30)#249 | 46.1%(+1.80)#9,806 |
1
Common Questions
What are the Top Zip Codes with the Highest Percentage of Families with Income Above $100,000 in Richland, WA?
Top Zip Codes with the Highest Percentage of Families with Income Above $100,000 in Richland, WA are:
What zip code has the Highest Percentage of Families with Income Above $100,000 in Richland, WA?
99352 has the Highest Percentage of Families with Income Above $100,000 in Richland, WA with 63.7%.
What is the Percentage of Families with Income Above $100,000 in Richland, WA?
Percentage of Families with Income Above $100,000 in Richland is 57.2%.
What is the Percentage of Families with Income Above $100,000 in Washington?
Percentage of Families with Income Above $100,000 in Washington is 54.2%.
What is the Percentage of Families with Income Above $100,000 in the United States?
Percentage of Families with Income Above $100,000 in the United States is 46.1%.