Hopewell borough, NJ Map & Demographics
Hopewell borough Overview
$73,207
PER CAPITA INCOME
$168,333
AVG FAMILY INCOME
$137,138
AVG HOUSEHOLD INCOME
31.4%
WAGE / INCOME GAP [ % ]
68.6¢/ $1
WAGE / INCOME GAP [ $ ]
0.45
INEQUALITY / GINI INDEX
1,825
TOTAL POPULATION
932
MALE POPULATION
893
FEMALE POPULATION
104.37
MALES / 100 FEMALES
95.82
FEMALES / 100 MALES
45.3
MEDIAN AGE
3.0
AVG FAMILY SIZE
2.4
AVG HOUSEHOLD SIZE
1,019
LABOR FORCE [ PEOPLE ]
74.3%
PERCENT IN LABOR FORCE
1.9%
UNEMPLOYMENT RATE
Income in Hopewell borough
Income Overview in Hopewell borough
Per Capita Income in Hopewell borough is $73,207, while median incomes of families and households are $168,333 and $137,138 respectively.
| Characteristic | Number | Measure |
| Per Capita Income | 1,825 | $73,207 |
| Median Family Income | 492 | $168,333 |
| Mean Family Income | 492 | $212,353 |
| Median Household Income | 755 | $137,138 |
| Mean Household Income | 755 | $177,920 |
| Income Deficit | 492 | $0 |
| Wage / Income Gap (%) | 1,825 | 31.44% |
| Wage / Income Gap ($) | 1,825 | 68.56¢ per $1 |
| Gini / Inequality Index | 1,825 | 0.45 |
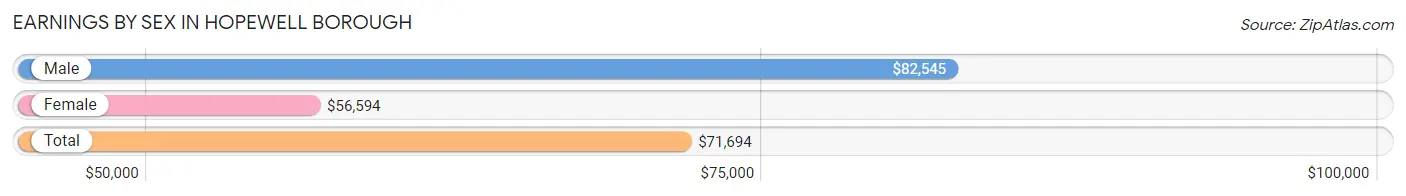
Earnings by Sex in Hopewell borough
Average Earnings in Hopewell borough are $71,694, $82,545 for men and $56,594 for women, a difference of 31.4%.
| Sex | Number | Average Earnings |
| Male | 559 (53.0%) | $82,545 |
| Female | 495 (47.0%) | $56,594 |
| Total | 1,054 (100.0%) | $71,694 |
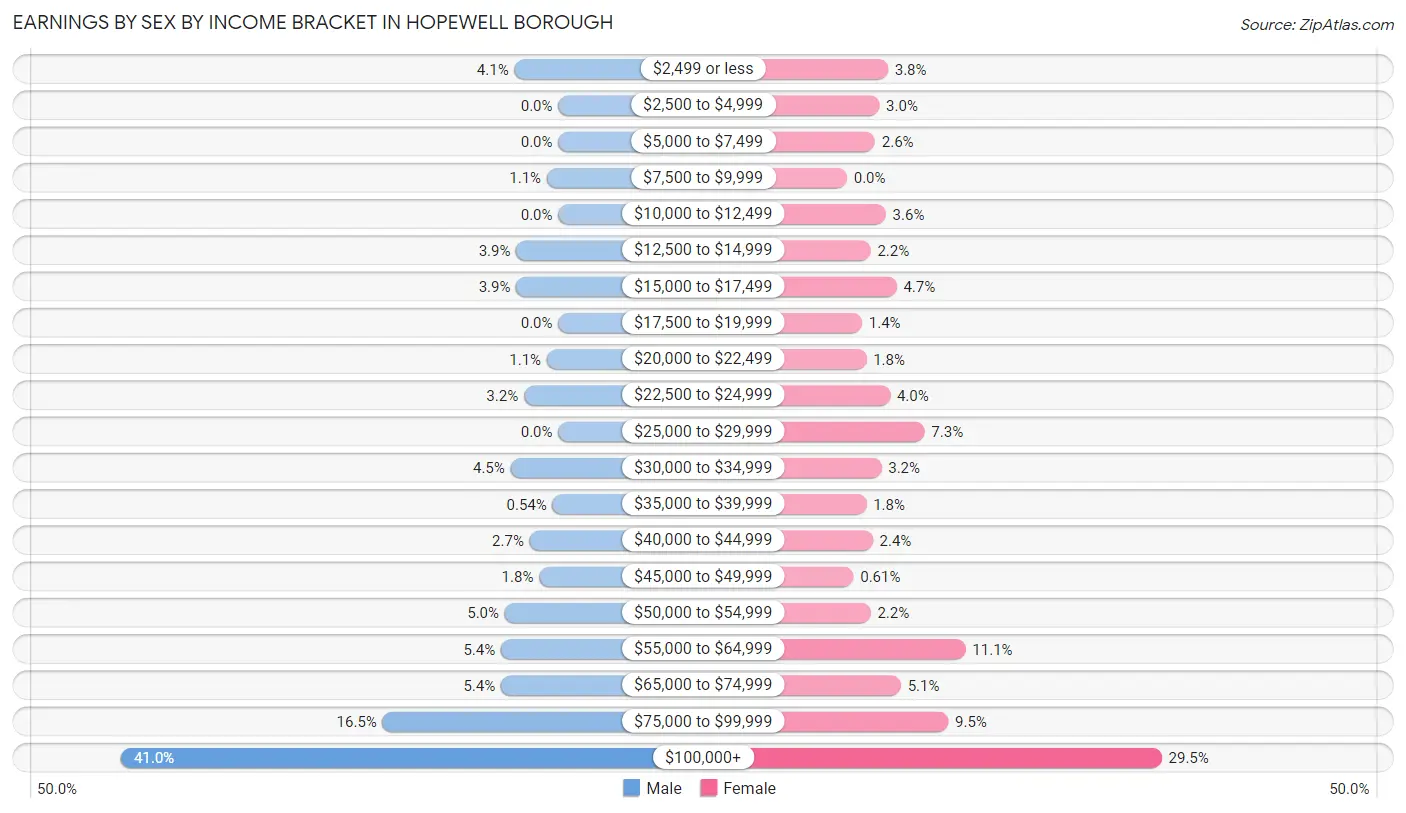
Earnings by Sex by Income Bracket in Hopewell borough
The most common earnings brackets in Hopewell borough are $100,000+ for men (229 | 41.0%) and $100,000+ for women (146 | 29.5%).
| Income | Male | Female |
| $2,499 or less | 23 (4.1%) | 19 (3.8%) |
| $2,500 to $4,999 | 0 (0.0%) | 15 (3.0%) |
| $5,000 to $7,499 | 0 (0.0%) | 13 (2.6%) |
| $7,500 to $9,999 | 6 (1.1%) | 0 (0.0%) |
| $10,000 to $12,499 | 0 (0.0%) | 18 (3.6%) |
| $12,500 to $14,999 | 22 (3.9%) | 11 (2.2%) |
| $15,000 to $17,499 | 22 (3.9%) | 23 (4.6%) |
| $17,500 to $19,999 | 0 (0.0%) | 7 (1.4%) |
| $20,000 to $22,499 | 6 (1.1%) | 9 (1.8%) |
| $22,500 to $24,999 | 18 (3.2%) | 20 (4.0%) |
| $25,000 to $29,999 | 0 (0.0%) | 36 (7.3%) |
| $30,000 to $34,999 | 25 (4.5%) | 16 (3.2%) |
| $35,000 to $39,999 | 3 (0.5%) | 9 (1.8%) |
| $40,000 to $44,999 | 15 (2.7%) | 12 (2.4%) |
| $45,000 to $49,999 | 10 (1.8%) | 3 (0.6%) |
| $50,000 to $54,999 | 28 (5.0%) | 11 (2.2%) |
| $55,000 to $64,999 | 30 (5.4%) | 55 (11.1%) |
| $65,000 to $74,999 | 30 (5.4%) | 25 (5.1%) |
| $75,000 to $99,999 | 92 (16.5%) | 47 (9.5%) |
| $100,000+ | 229 (41.0%) | 146 (29.5%) |
| Total | 559 (100.0%) | 495 (100.0%) |
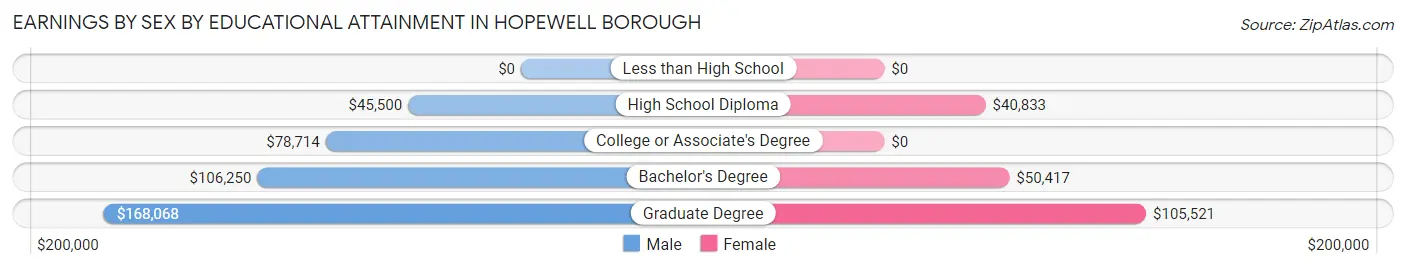
Earnings by Sex by Educational Attainment in Hopewell borough
Average earnings in Hopewell borough are $87,692 for men and $56,844 for women, a difference of 35.2%. Men with an educational attainment of graduate degree enjoy the highest average annual earnings of $168,068, while those with high school diploma education earn the least with $45,500. Women with an educational attainment of graduate degree earn the most with the average annual earnings of $105,521, while those with high school diploma education have the smallest earnings of $40,833.
| Educational Attainment | Male Income | Female Income |
| Less than High School | - | - |
| High School Diploma | $45,500 | $40,833 |
| College or Associate's Degree | $78,714 | $0 |
| Bachelor's Degree | $106,250 | $50,417 |
| Graduate Degree | $168,068 | $105,521 |
| Total | $87,692 | $56,844 |
Family Income in Hopewell borough
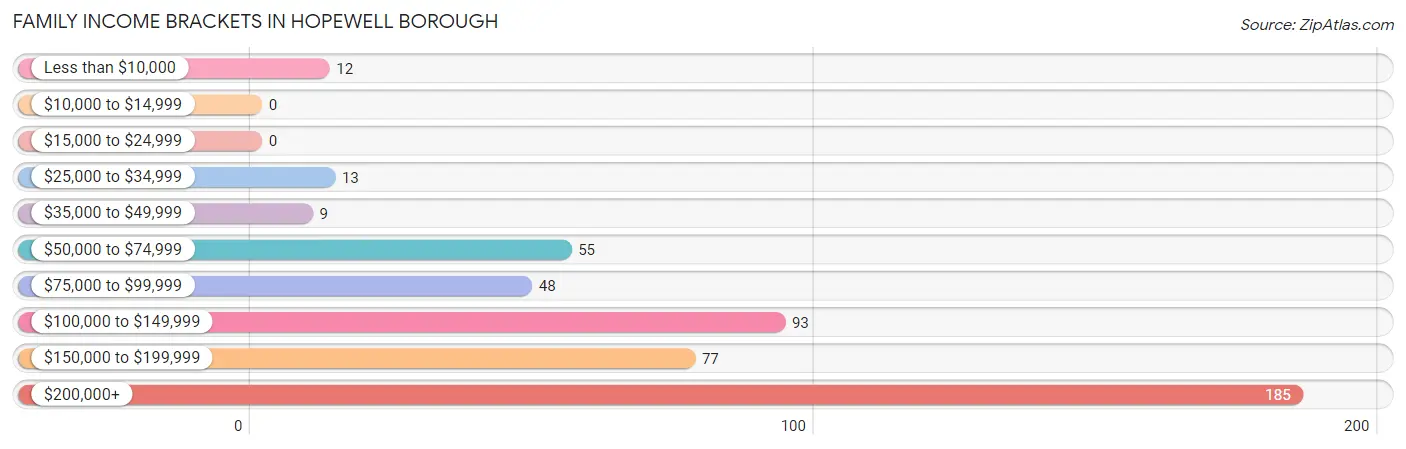
Family Income Brackets in Hopewell borough
According to the Hopewell borough family income data, there are 185 families falling into the $200,000+ income range, which is the most common income bracket and makes up 37.6% of all families.
| Income Bracket | # Families | % Families |
| Less than $10,000 | 12 | 2.4% |
| $10,000 to $14,999 | 0 | 0.0% |
| $15,000 to $24,999 | 0 | 0.0% |
| $25,000 to $34,999 | 13 | 2.6% |
| $35,000 to $49,999 | 9 | 1.8% |
| $50,000 to $74,999 | 55 | 11.2% |
| $75,000 to $99,999 | 48 | 9.8% |
| $100,000 to $149,999 | 93 | 18.9% |
| $150,000 to $199,999 | 77 | 15.7% |
| $200,000+ | 185 | 37.6% |
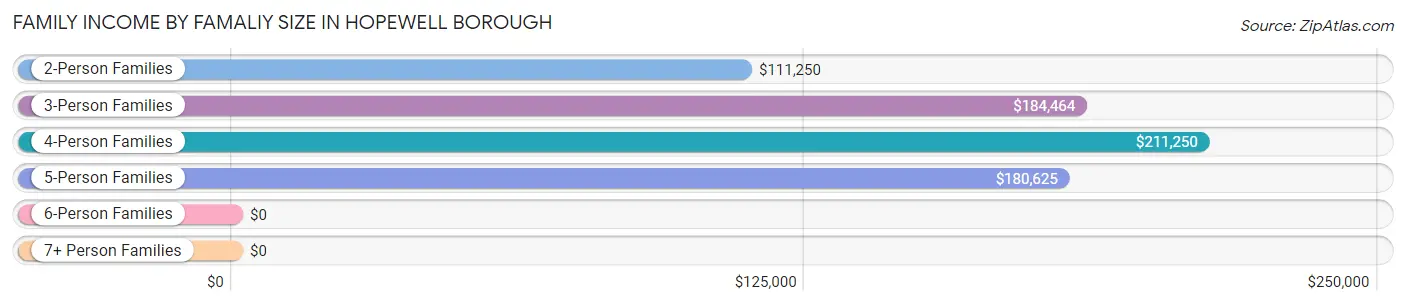
Family Income by Famaliy Size in Hopewell borough
4-person families (122 | 24.8%) account for the highest median family income in Hopewell borough with $211,250 per family, while 3-person families (117 | 23.8%) have the highest median income of $61,488 per family member.
| Income Bracket | # Families | Median Income |
| 2-Person Families | 208 (42.3%) | $111,250 |
| 3-Person Families | 117 (23.8%) | $184,464 |
| 4-Person Families | 122 (24.8%) | $211,250 |
| 5-Person Families | 38 (7.7%) | $180,625 |
| 6-Person Families | 7 (1.4%) | $0 |
| 7+ Person Families | 0 (0.0%) | $0 |
| Total | 492 (100.0%) | $168,333 |
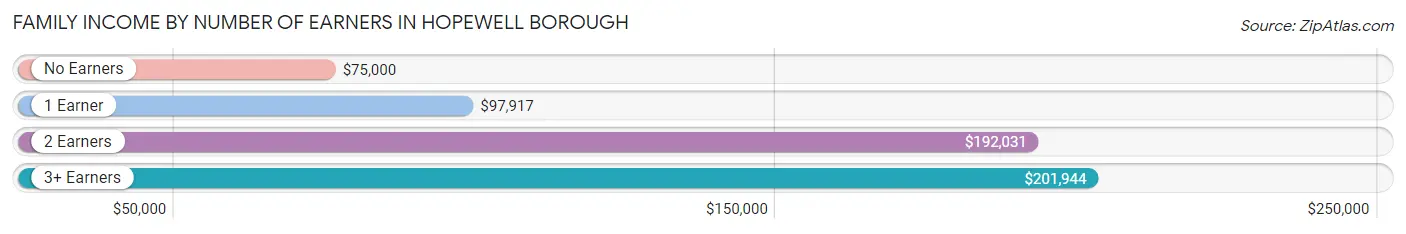
Family Income by Number of Earners in Hopewell borough
The median family income in Hopewell borough is $168,333, with families comprising 3+ earners (28) having the highest median family income of $201,944, while families with no earners (36) have the lowest median family income of $75,000, accounting for 5.7% and 7.3% of families, respectively.
| Number of Earners | # Families | Median Income |
| No Earners | 36 (7.3%) | $75,000 |
| 1 Earner | 131 (26.6%) | $97,917 |
| 2 Earners | 297 (60.4%) | $192,031 |
| 3+ Earners | 28 (5.7%) | $201,944 |
| Total | 492 (100.0%) | $168,333 |
Household Income in Hopewell borough
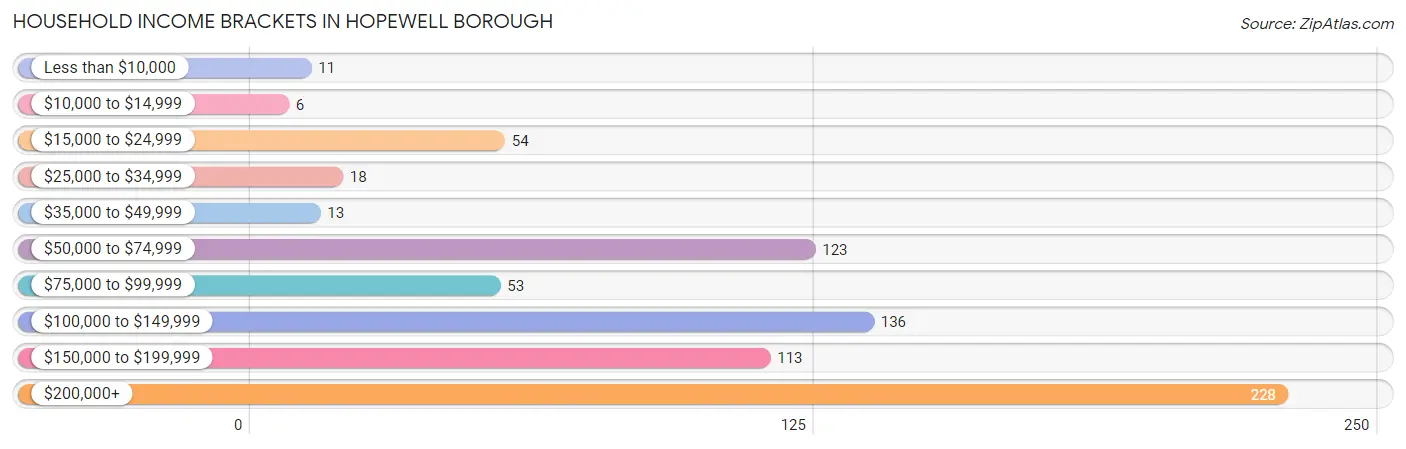
Household Income Brackets in Hopewell borough
With 228 households falling in the category, the $200,000+ income range is the most frequent in Hopewell borough, accounting for 30.2% of all households. In contrast, only 6 households (0.8%) fall into the $10,000 to $14,999 income bracket, making it the least populous group.
| Income Bracket | # Households | % Households |
| Less than $10,000 | 11 | 1.5% |
| $10,000 to $14,999 | 6 | 0.8% |
| $15,000 to $24,999 | 54 | 7.2% |
| $25,000 to $34,999 | 18 | 2.4% |
| $35,000 to $49,999 | 13 | 1.7% |
| $50,000 to $74,999 | 123 | 16.3% |
| $75,000 to $99,999 | 53 | 7.0% |
| $100,000 to $149,999 | 136 | 18.0% |
| $150,000 to $199,999 | 113 | 15.0% |
| $200,000+ | 228 | 30.2% |
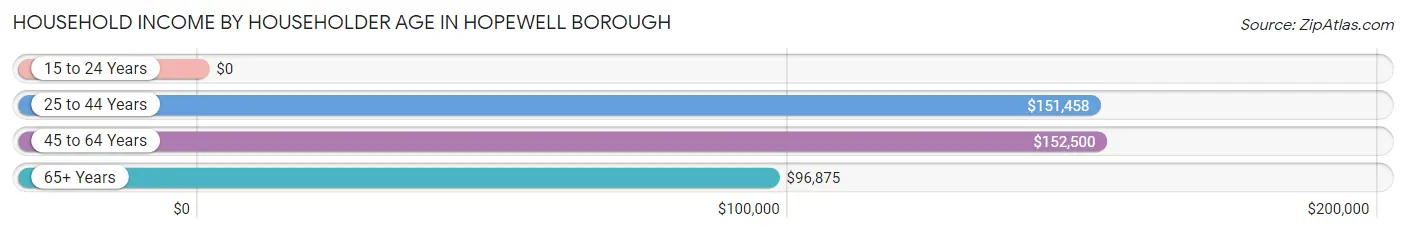
Household Income by Householder Age in Hopewell borough
The median household income in Hopewell borough is $137,138, with the highest median household income of $152,500 found in the 45 to 64 years age bracket for the primary householder. A total of 394 households (52.2%) fall into this category.
| Income Bracket | # Households | Median Income |
| 15 to 24 Years | 0 (0.0%) | $0 |
| 25 to 44 Years | 169 (22.4%) | $151,458 |
| 45 to 64 Years | 394 (52.2%) | $152,500 |
| 65+ Years | 192 (25.4%) | $96,875 |
| Total | 755 (100.0%) | $137,138 |
Poverty in Hopewell borough
Income Below Poverty by Sex and Age in Hopewell borough
With 2.9% poverty level for males and 1.6% for females among the residents of Hopewell borough, 18 to 24 year old males and 25 to 34 year old females are the most vulnerable to poverty, with 10 males (14.5%) and 8 females (11.6%) in their respective age groups living below the poverty level.
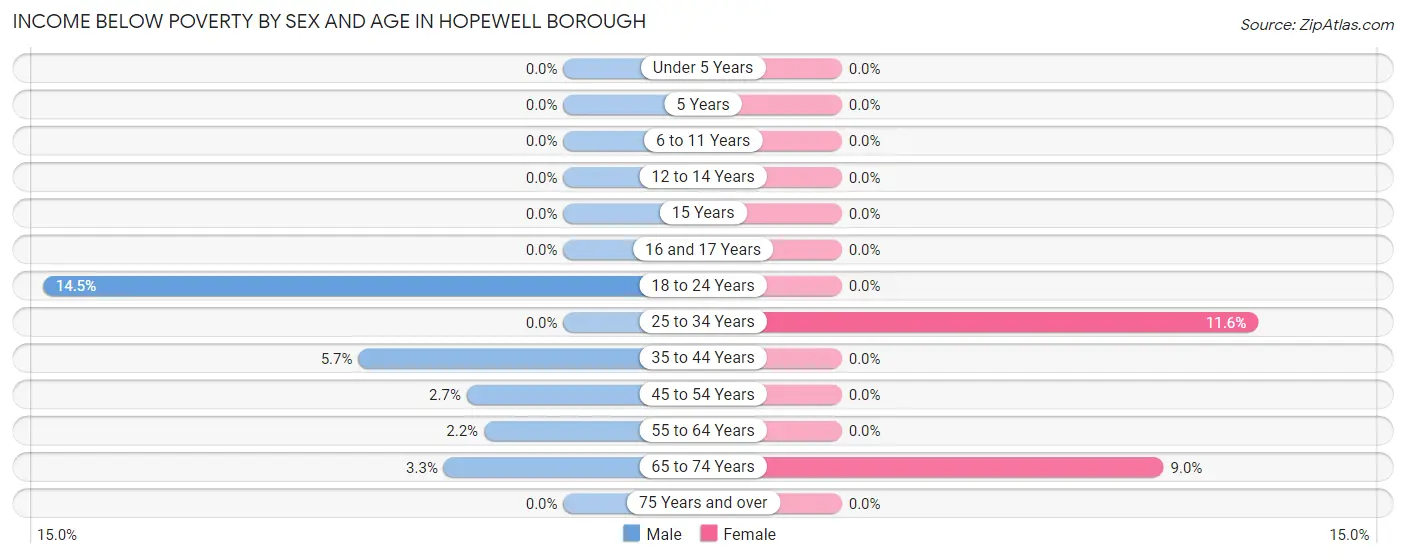
| Age Bracket | Male | Female |
| Under 5 Years | 0 (0.0%) | 0 (0.0%) |
| 5 Years | 0 (0.0%) | 0 (0.0%) |
| 6 to 11 Years | 0 (0.0%) | 0 (0.0%) |
| 12 to 14 Years | 0 (0.0%) | 0 (0.0%) |
| 15 Years | 0 (0.0%) | 0 (0.0%) |
| 16 and 17 Years | 0 (0.0%) | 0 (0.0%) |
| 18 to 24 Years | 10 (14.5%) | 0 (0.0%) |
| 25 to 34 Years | 0 (0.0%) | 8 (11.6%) |
| 35 to 44 Years | 6 (5.7%) | 0 (0.0%) |
| 45 to 54 Years | 5 (2.7%) | 0 (0.0%) |
| 55 to 64 Years | 3 (2.2%) | 0 (0.0%) |
| 65 to 74 Years | 3 (3.3%) | 6 (9.0%) |
| 75 Years and over | 0 (0.0%) | 0 (0.0%) |
| Total | 27 (2.9%) | 14 (1.6%) |
Income Above Poverty by Sex and Age in Hopewell borough
According to the poverty statistics in Hopewell borough, males aged under 5 years and females aged under 5 years are the age groups that are most secure financially, with 100.0% of males and 100.0% of females in these age groups living above the poverty line.
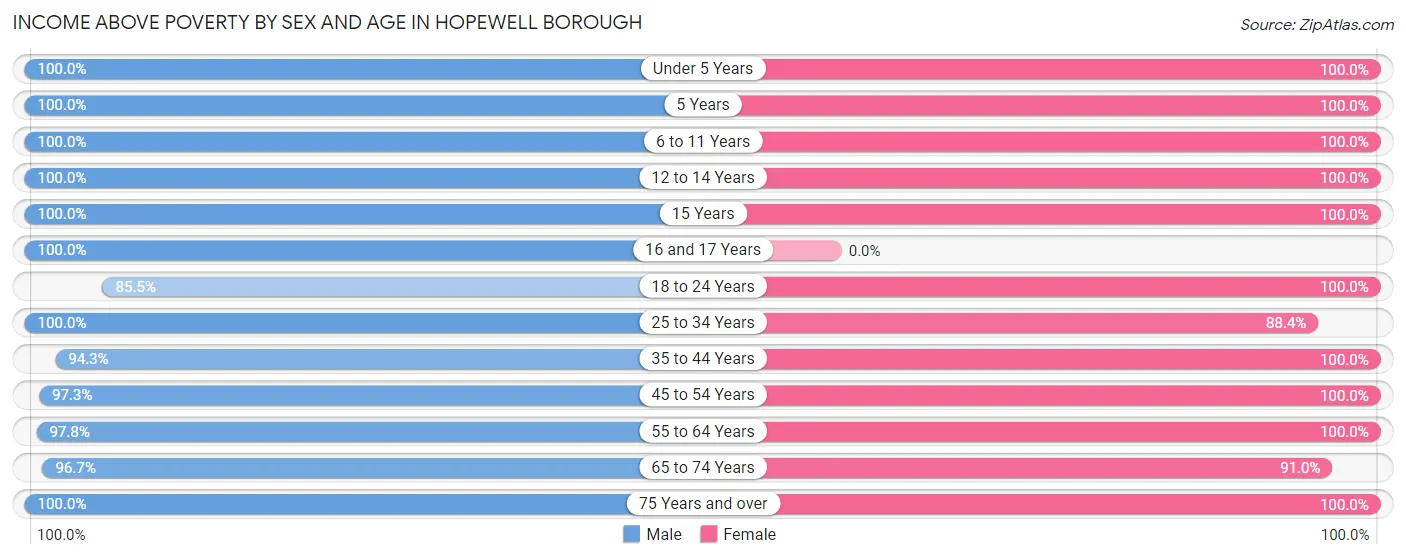
| Age Bracket | Male | Female |
| Under 5 Years | 69 (100.0%) | 57 (100.0%) |
| 5 Years | 27 (100.0%) | 23 (100.0%) |
| 6 to 11 Years | 39 (100.0%) | 99 (100.0%) |
| 12 to 14 Years | 81 (100.0%) | 28 (100.0%) |
| 15 Years | 21 (100.0%) | 9 (100.0%) |
| 16 and 17 Years | 23 (100.0%) | 0 (0.0%) |
| 18 to 24 Years | 59 (85.5%) | 14 (100.0%) |
| 25 to 34 Years | 32 (100.0%) | 61 (88.4%) |
| 35 to 44 Years | 99 (94.3%) | 135 (100.0%) |
| 45 to 54 Years | 181 (97.3%) | 147 (100.0%) |
| 55 to 64 Years | 133 (97.8%) | 175 (100.0%) |
| 65 to 74 Years | 87 (96.7%) | 61 (91.0%) |
| 75 Years and over | 54 (100.0%) | 70 (100.0%) |
| Total | 905 (97.1%) | 879 (98.4%) |
Income Below Poverty Among Married-Couple Families in Hopewell borough
The poverty statistics for married-couple families in Hopewell borough show that 1.5% or 6 of the total 403 families live below the poverty line. Families with no children have the highest poverty rate of 3.5%, comprising of 6 families. On the other hand, families with 1 or 2 children have the lowest poverty rate of 0.0%, which includes 0 families.
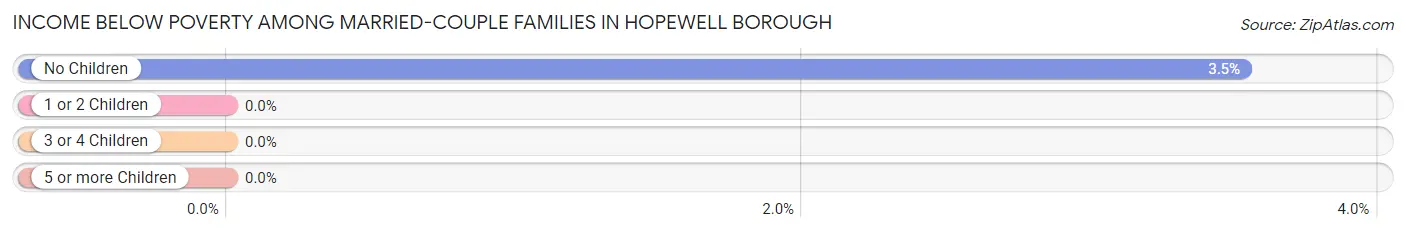
| Children | Above Poverty | Below Poverty |
| No Children | 164 (96.5%) | 6 (3.5%) |
| 1 or 2 Children | 206 (100.0%) | 0 (0.0%) |
| 3 or 4 Children | 27 (100.0%) | 0 (0.0%) |
| 5 or more Children | 0 (0.0%) | 0 (0.0%) |
| Total | 397 (98.5%) | 6 (1.5%) |
Income Below Poverty Among Single-Parent Households in Hopewell borough
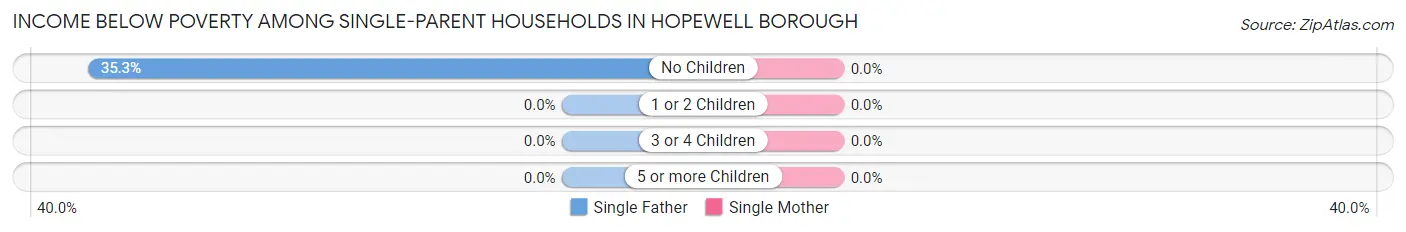
| Children | Single Father | Single Mother |
| No Children | 6 (35.3%) | 0 (0.0%) |
| 1 or 2 Children | 0 (0.0%) | 0 (0.0%) |
| 3 or 4 Children | 0 (0.0%) | 0 (0.0%) |
| 5 or more Children | 0 (0.0%) | 0 (0.0%) |
| Total | 6 (24.0%) | 0 (0.0%) |
Income Below Poverty Among Married-Couple vs Single-Parent Households in Hopewell borough
The poverty data for Hopewell borough shows that 6 of the married-couple family households (1.5%) and 6 of the single-parent households (6.7%) are living below the poverty level. Within the married-couple family households, those with no children have the highest poverty rate, with 6 households (3.5%) falling below the poverty line. Among the single-parent households, those with no children have the highest poverty rate, with 6 household (14.3%) living below poverty.
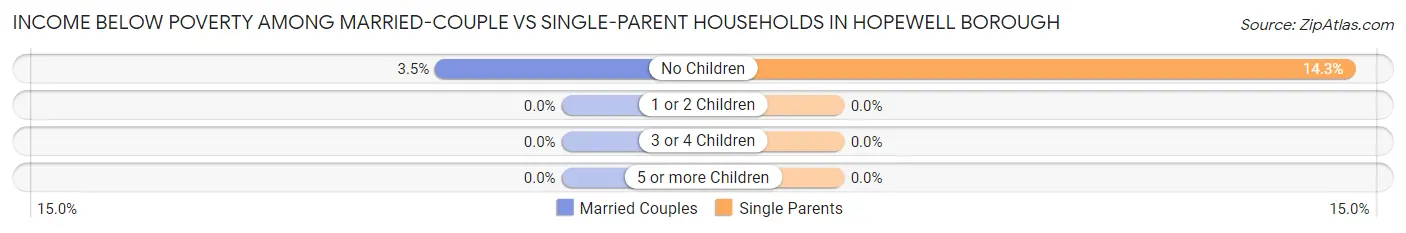
| Children | Married-Couple Families | Single-Parent Households |
| No Children | 6 (3.5%) | 6 (14.3%) |
| 1 or 2 Children | 0 (0.0%) | 0 (0.0%) |
| 3 or 4 Children | 0 (0.0%) | 0 (0.0%) |
| 5 or more Children | 0 (0.0%) | 0 (0.0%) |
| Total | 6 (1.5%) | 6 (6.7%) |
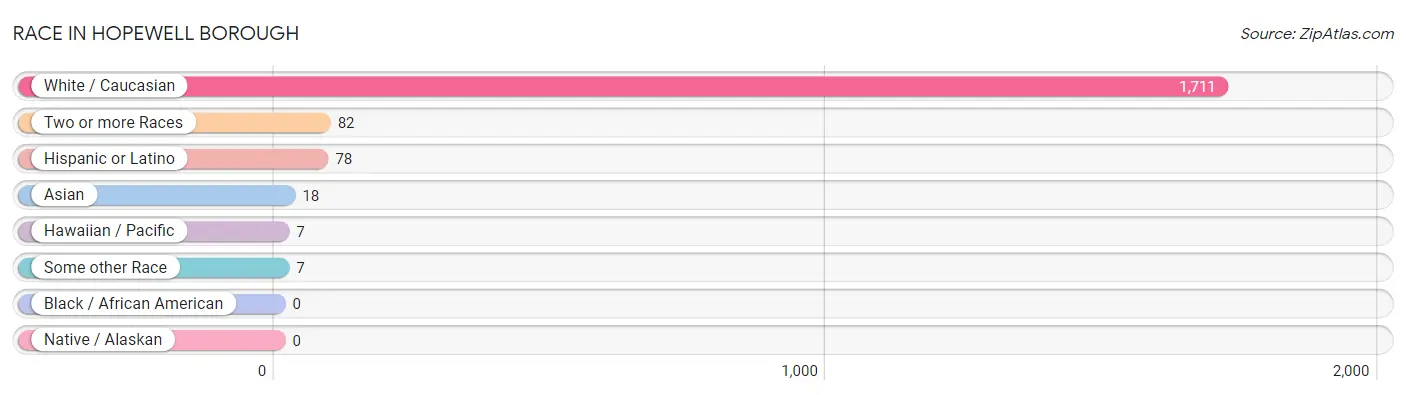
Race in Hopewell borough
The most populous races in Hopewell borough are White / Caucasian (1,711 | 93.8%), Two or more Races (82 | 4.5%), and Hispanic or Latino (78 | 4.3%).
| Race | # Population | % Population |
| Asian | 18 | 1.0% |
| Black / African American | 0 | 0.0% |
| Hawaiian / Pacific | 7 | 0.4% |
| Hispanic or Latino | 78 | 4.3% |
| Native / Alaskan | 0 | 0.0% |
| White / Caucasian | 1,711 | 93.8% |
| Two or more Races | 82 | 4.5% |
| Some other Race | 7 | 0.4% |
| Total | 1,825 | 100.0% |
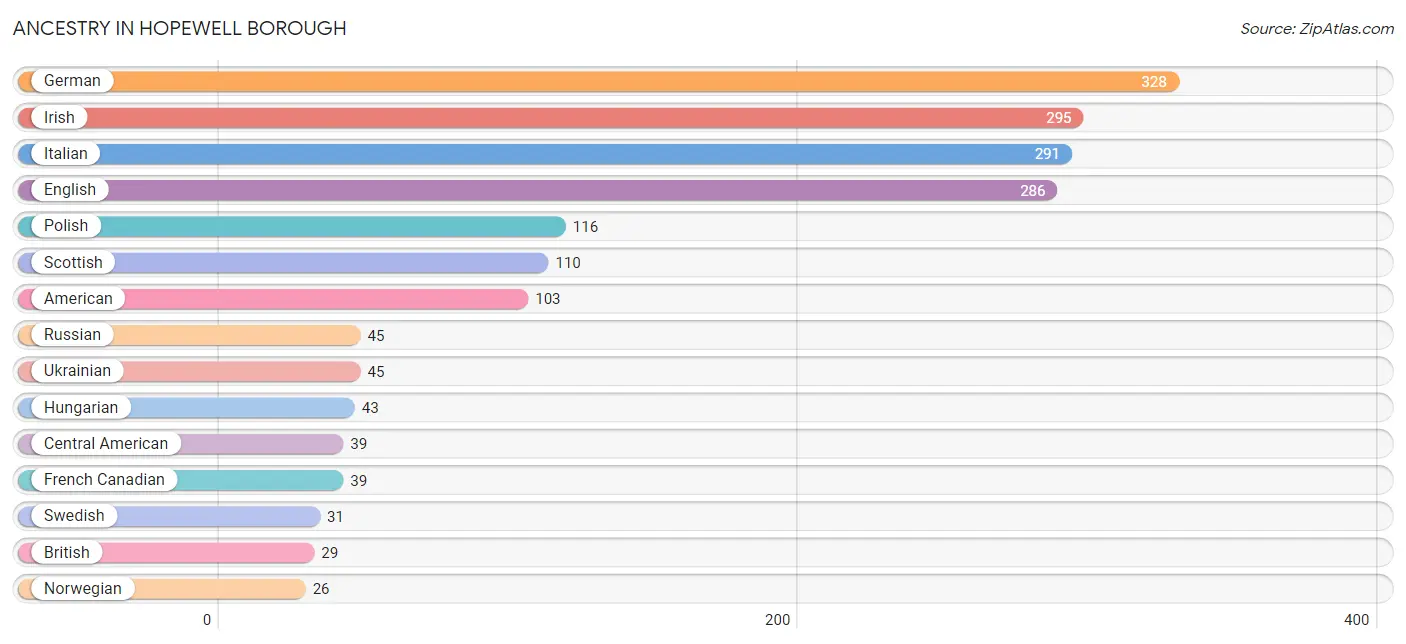
Ancestry in Hopewell borough
The most populous ancestries reported in Hopewell borough are German (328 | 18.0%), Irish (295 | 16.2%), Italian (291 | 16.0%), English (286 | 15.7%), and Polish (116 | 6.4%), together accounting for 72.1% of all Hopewell borough residents.
| Ancestry | # Population | % Population |
| American | 103 | 5.6% |
| Arab | 21 | 1.1% |
| Austrian | 4 | 0.2% |
| Belgian | 3 | 0.2% |
| Bhutanese | 16 | 0.9% |
| British | 29 | 1.6% |
| Burmese | 4 | 0.2% |
| Canadian | 8 | 0.4% |
| Celtic | 11 | 0.6% |
| Central American | 39 | 2.1% |
| Central American Indian | 20 | 1.1% |
| Colombian | 4 | 0.2% |
| Croatian | 14 | 0.8% |
| Dutch | 10 | 0.5% |
| Eastern European | 6 | 0.3% |
| Ecuadorian | 7 | 0.4% |
| English | 286 | 15.7% |
| European | 22 | 1.2% |
| French | 7 | 0.4% |
| French Canadian | 39 | 2.1% |
| German | 328 | 18.0% |
| Greek | 23 | 1.3% |
| Guamanian / Chamorro | 7 | 0.4% |
| Guatemalan | 20 | 1.1% |
| Honduran | 19 | 1.0% |
| Hungarian | 43 | 2.4% |
| Indian (Asian) | 13 | 0.7% |
| Iranian | 6 | 0.3% |
| Irish | 295 | 16.2% |
| Italian | 291 | 16.0% |
| Lebanese | 6 | 0.3% |
| Lithuanian | 3 | 0.2% |
| Mexican | 5 | 0.3% |
| Northern European | 7 | 0.4% |
| Norwegian | 26 | 1.4% |
| Peruvian | 13 | 0.7% |
| Polish | 116 | 6.4% |
| Portuguese | 6 | 0.3% |
| Puerto Rican | 6 | 0.3% |
| Romanian | 14 | 0.8% |
| Russian | 45 | 2.5% |
| Scandinavian | 11 | 0.6% |
| Scotch-Irish | 12 | 0.7% |
| Scottish | 110 | 6.0% |
| Serbian | 3 | 0.2% |
| Slovak | 23 | 1.3% |
| South American | 24 | 1.3% |
| Spanish | 4 | 0.2% |
| Swedish | 31 | 1.7% |
| Swiss | 6 | 0.3% |
| Ukrainian | 45 | 2.5% |
| Welsh | 9 | 0.5% | View All 52 Rows |
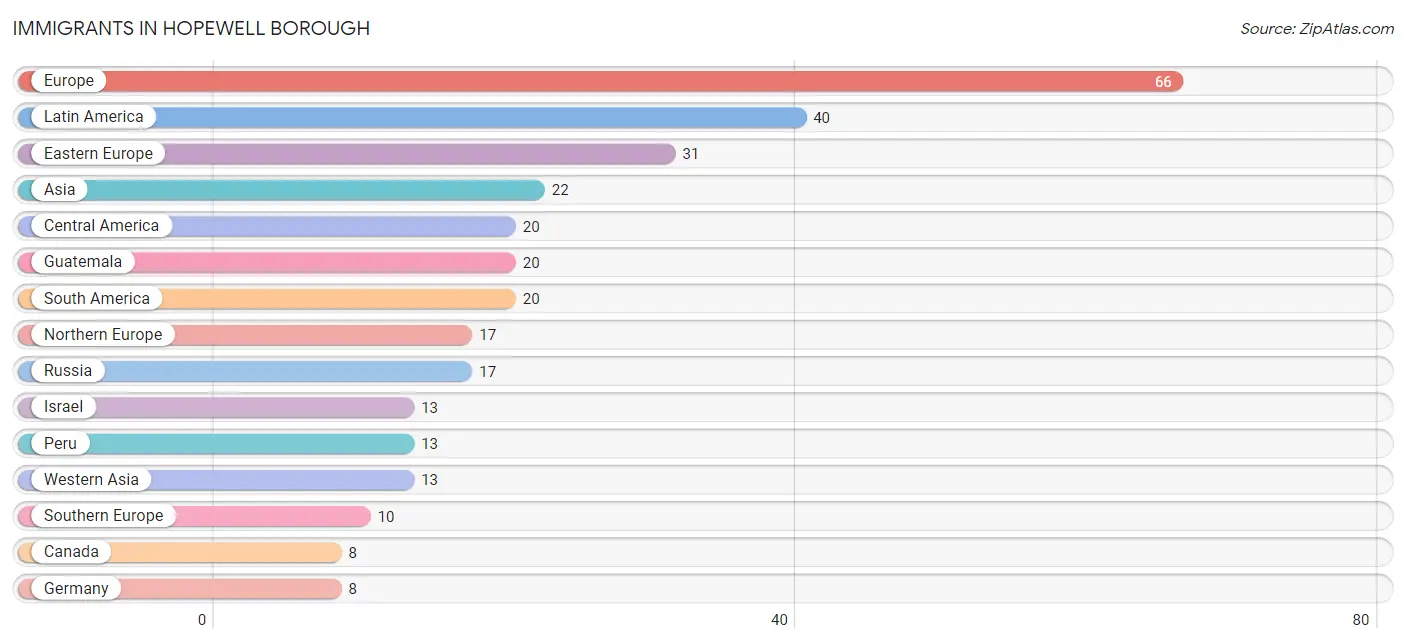
Immigrants in Hopewell borough
The most numerous immigrant groups reported in Hopewell borough came from Europe (66 | 3.6%), Latin America (40 | 2.2%), Eastern Europe (31 | 1.7%), Asia (22 | 1.2%), and Central America (20 | 1.1%), together accounting for 9.8% of all Hopewell borough residents.
| Immigration Origin | # Population | % Population |
| Asia | 22 | 1.2% |
| Bosnia and Herzegovina | 3 | 0.2% |
| Canada | 8 | 0.4% |
| Central America | 20 | 1.1% |
| China | 5 | 0.3% |
| Czechoslovakia | 4 | 0.2% |
| Eastern Asia | 5 | 0.3% |
| Eastern Europe | 31 | 1.7% |
| Ecuador | 7 | 0.4% |
| England | 4 | 0.2% |
| Europe | 66 | 3.6% |
| Germany | 8 | 0.4% |
| Guatemala | 20 | 1.1% |
| Israel | 13 | 0.7% |
| Italy | 3 | 0.2% |
| Latin America | 40 | 2.2% |
| Northern Europe | 17 | 0.9% |
| Pakistan | 4 | 0.2% |
| Peru | 13 | 0.7% |
| Romania | 7 | 0.4% |
| Russia | 17 | 0.9% |
| South America | 20 | 1.1% |
| South Central Asia | 4 | 0.2% |
| Southern Europe | 10 | 0.5% |
| Spain | 7 | 0.4% |
| Western Asia | 13 | 0.7% |
| Western Europe | 8 | 0.4% | View All 27 Rows |
Sex and Age in Hopewell borough
Sex and Age in Hopewell borough
The most populous age groups in Hopewell borough are 50 to 54 Years (115 | 12.3%) for men and 55 to 59 Years (101 | 11.3%) for women.
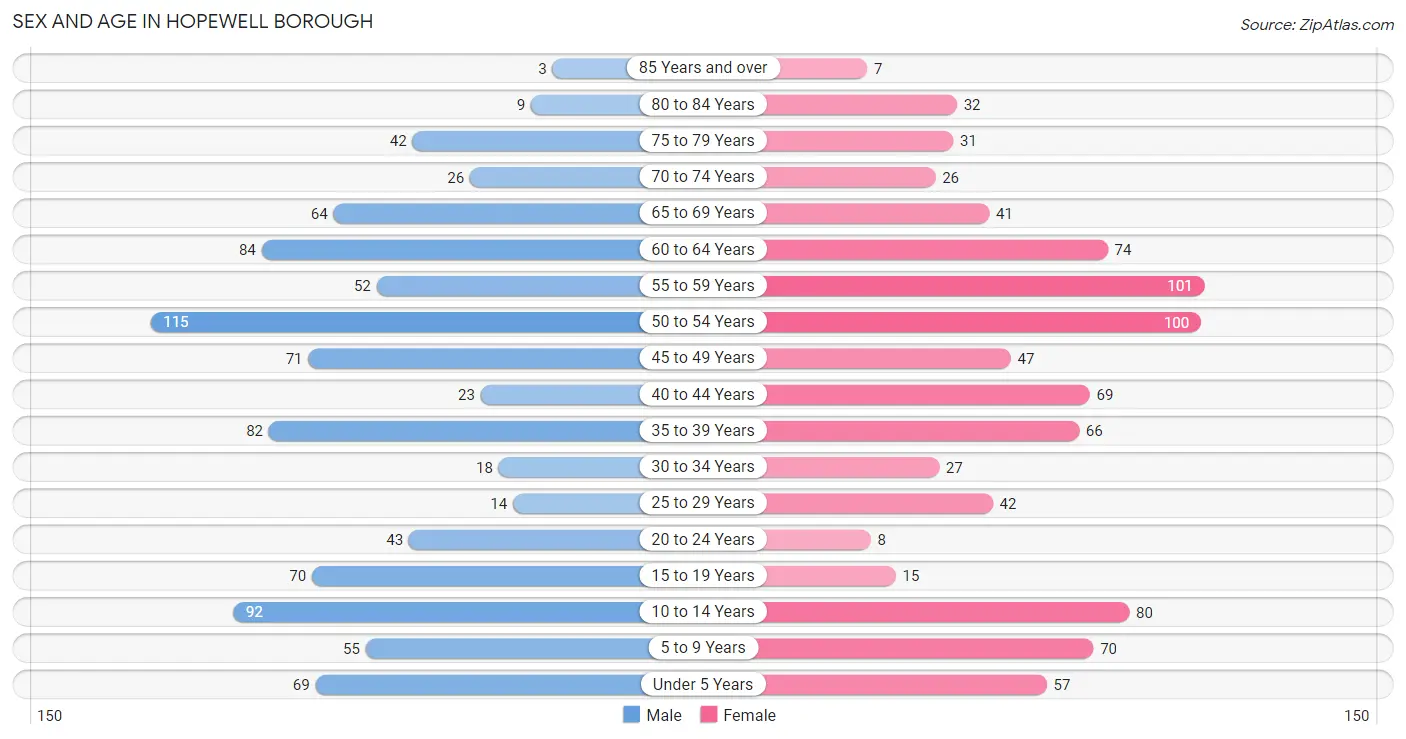
| Age Bracket | Male | Female |
| Under 5 Years | 69 (7.4%) | 57 (6.4%) |
| 5 to 9 Years | 55 (5.9%) | 70 (7.8%) |
| 10 to 14 Years | 92 (9.9%) | 80 (9.0%) |
| 15 to 19 Years | 70 (7.5%) | 15 (1.7%) |
| 20 to 24 Years | 43 (4.6%) | 8 (0.9%) |
| 25 to 29 Years | 14 (1.5%) | 42 (4.7%) |
| 30 to 34 Years | 18 (1.9%) | 27 (3.0%) |
| 35 to 39 Years | 82 (8.8%) | 66 (7.4%) |
| 40 to 44 Years | 23 (2.5%) | 69 (7.7%) |
| 45 to 49 Years | 71 (7.6%) | 47 (5.3%) |
| 50 to 54 Years | 115 (12.3%) | 100 (11.2%) |
| 55 to 59 Years | 52 (5.6%) | 101 (11.3%) |
| 60 to 64 Years | 84 (9.0%) | 74 (8.3%) |
| 65 to 69 Years | 64 (6.9%) | 41 (4.6%) |
| 70 to 74 Years | 26 (2.8%) | 26 (2.9%) |
| 75 to 79 Years | 42 (4.5%) | 31 (3.5%) |
| 80 to 84 Years | 9 (1.0%) | 32 (3.6%) |
| 85 Years and over | 3 (0.3%) | 7 (0.8%) |
| Total | 932 (100.0%) | 893 (100.0%) |
Families and Households in Hopewell borough
Median Family Size in Hopewell borough
The median family size in Hopewell borough is 3.03 persons per family, with married-couple families (403 | 81.9%) accounting for the largest median family size of 3.17 persons per family. On the other hand, single male/father families (25 | 5.1%) represent the smallest median family size with 2.24 persons per family.
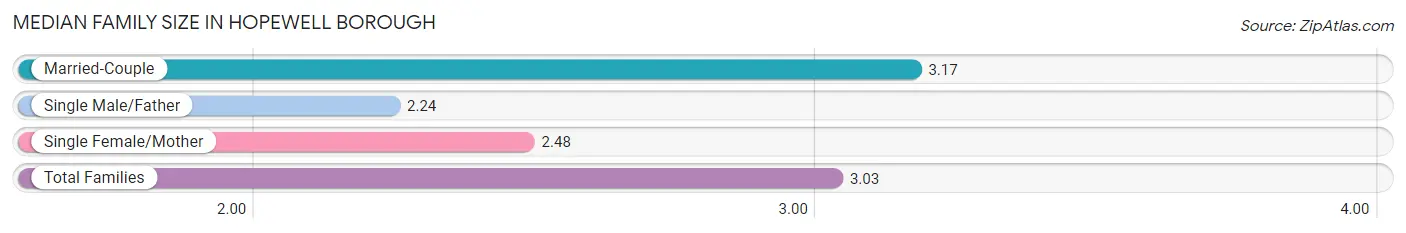
| Family Type | # Families | Family Size |
| Married-Couple | 403 (81.9%) | 3.17 |
| Single Male/Father | 25 (5.1%) | 2.24 |
| Single Female/Mother | 64 (13.0%) | 2.48 |
| Total Families | 492 (100.0%) | 3.03 |
Median Household Size in Hopewell borough
The median household size in Hopewell borough is 2.42 persons per household, with married-couple households (403 | 53.4%) accounting for the largest median household size of 3.17 persons per household. non-family households (263 | 34.8%) represent the smallest median household size with 1.20 persons per household.
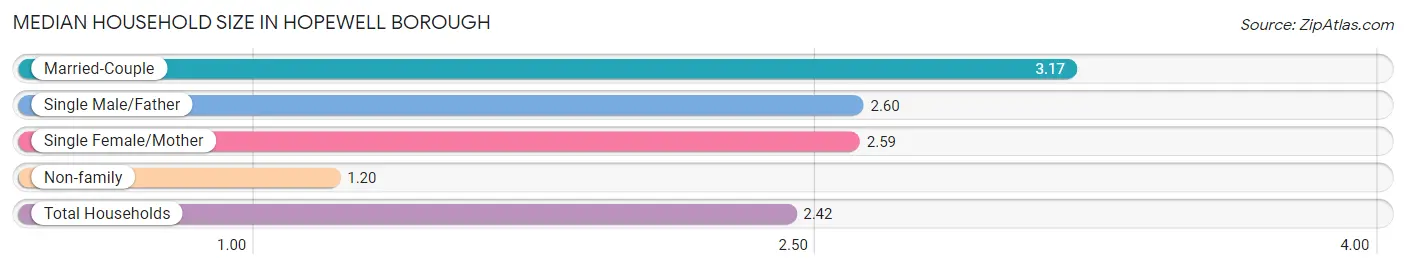
| Household Type | # Households | Household Size |
| Married-Couple | 403 (53.4%) | 3.17 |
| Single Male/Father | 25 (3.3%) | 2.60 |
| Single Female/Mother | 64 (8.5%) | 2.59 |
| Non-family | 263 (34.8%) | 1.20 |
| Total Households | 755 (100.0%) | 2.42 |
Household Size by Marriage Status in Hopewell borough
Out of a total of 755 households in Hopewell borough, 492 (65.2%) are family households, while 263 (34.8%) are nonfamily households. The most numerous type of family households are 2-person households, comprising 204, and the most common type of nonfamily households are 1-person households, comprising 215.
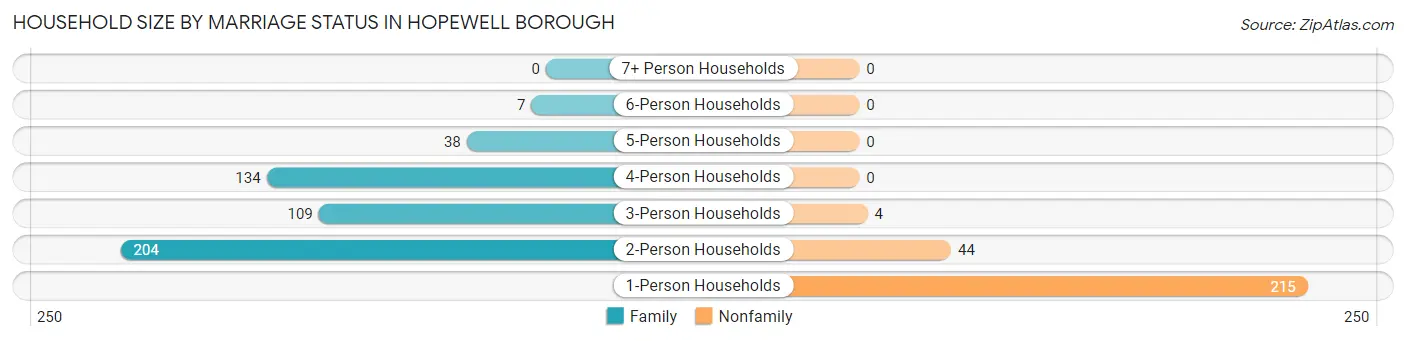
| Household Size | Family Households | Nonfamily Households |
| 1-Person Households | - | 215 (28.5%) |
| 2-Person Households | 204 (27.0%) | 44 (5.8%) |
| 3-Person Households | 109 (14.4%) | 4 (0.5%) |
| 4-Person Households | 134 (17.7%) | 0 (0.0%) |
| 5-Person Households | 38 (5.0%) | 0 (0.0%) |
| 6-Person Households | 7 (0.9%) | 0 (0.0%) |
| 7+ Person Households | 0 (0.0%) | 0 (0.0%) |
| Total | 492 (65.2%) | 263 (34.8%) |
Female Fertility in Hopewell borough
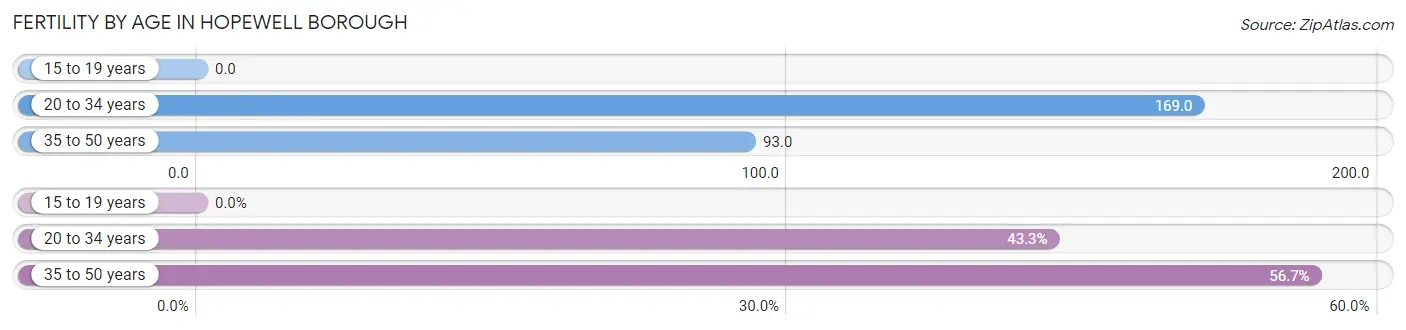
Fertility by Age in Hopewell borough
Average fertility rate in Hopewell borough is 109.0 births per 1,000 women. Women in the age bracket of 20 to 34 years have the highest fertility rate with 169.0 births per 1,000 women. Women in the age bracket of 35 to 50 years acount for 56.7% of all women with births.
| Age Bracket | Women with Births | Births / 1,000 Women |
| 15 to 19 years | 0 (0.0%) | 0.0 |
| 20 to 34 years | 13 (43.3%) | 169.0 |
| 35 to 50 years | 17 (56.7%) | 93.0 |
| Total | 30 (100.0%) | 109.0 |
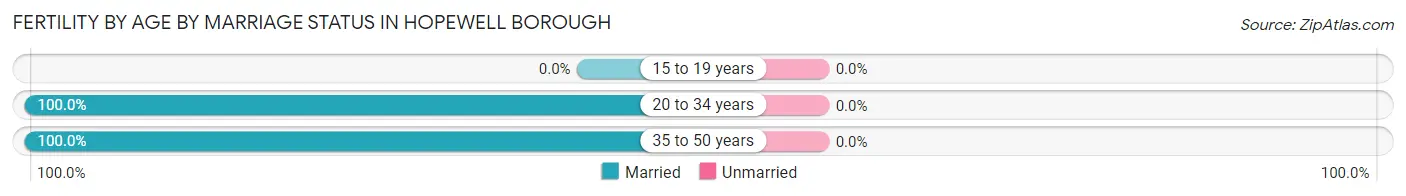
Fertility by Age by Marriage Status in Hopewell borough
| Age Bracket | Married | Unmarried |
| 15 to 19 years | 0 (0.0%) | 0 (0.0%) |
| 20 to 34 years | 13 (100.0%) | 0 (0.0%) |
| 35 to 50 years | 17 (100.0%) | 0 (0.0%) |
| Total | 30 (100.0%) | 0 (0.0%) |
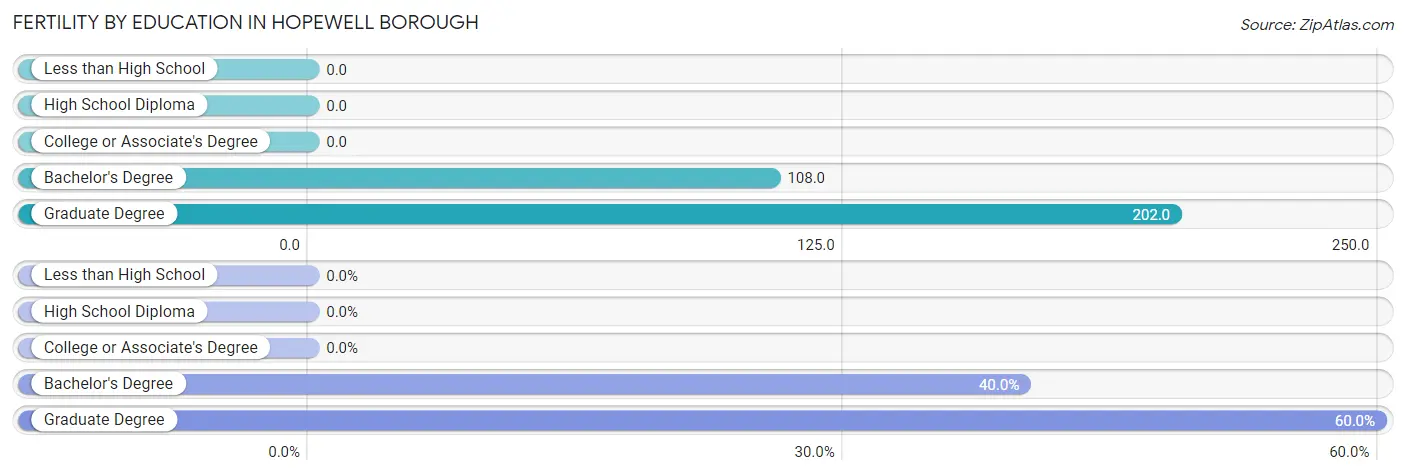
Fertility by Education in Hopewell borough
| Educational Attainment | Women with Births | Births / 1,000 Women |
| Less than High School | 0 (0.0%) | 0.0 |
| High School Diploma | 0 (0.0%) | 0.0 |
| College or Associate's Degree | 0 (0.0%) | 0.0 |
| Bachelor's Degree | 12 (40.0%) | 108.0 |
| Graduate Degree | 18 (60.0%) | 202.0 |
| Total | 30 (100.0%) | 109.0 |
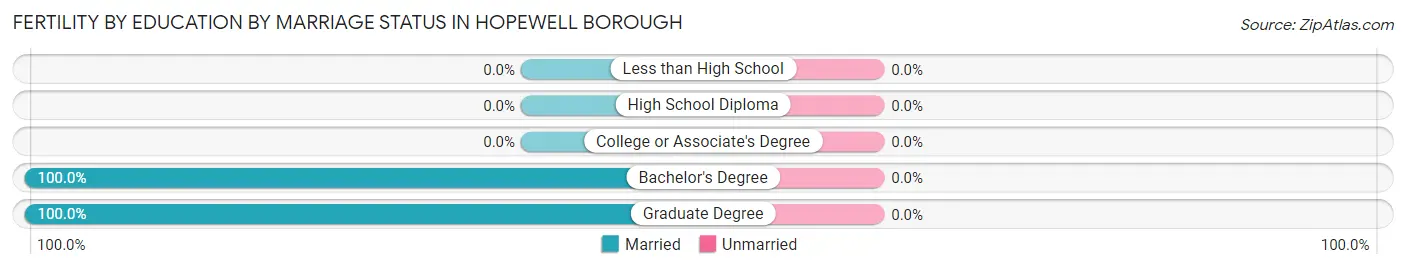
Fertility by Education by Marriage Status in Hopewell borough
| Educational Attainment | Married | Unmarried |
| Less than High School | 0 (0.0%) | 0 (0.0%) |
| High School Diploma | 0 (0.0%) | 0 (0.0%) |
| College or Associate's Degree | 0 (0.0%) | 0 (0.0%) |
| Bachelor's Degree | 12 (100.0%) | 0 (0.0%) |
| Graduate Degree | 18 (100.0%) | 0 (0.0%) |
| Total | 30 (100.0%) | 0 (0.0%) |
Employment Characteristics in Hopewell borough
Employment by Class of Employer in Hopewell borough
Among the 971 employed individuals in Hopewell borough, private company employees (489 | 50.4%), not-for-profit organizations (174 | 17.9%), and local government employees (131 | 13.5%) make up the most common classes of employment.
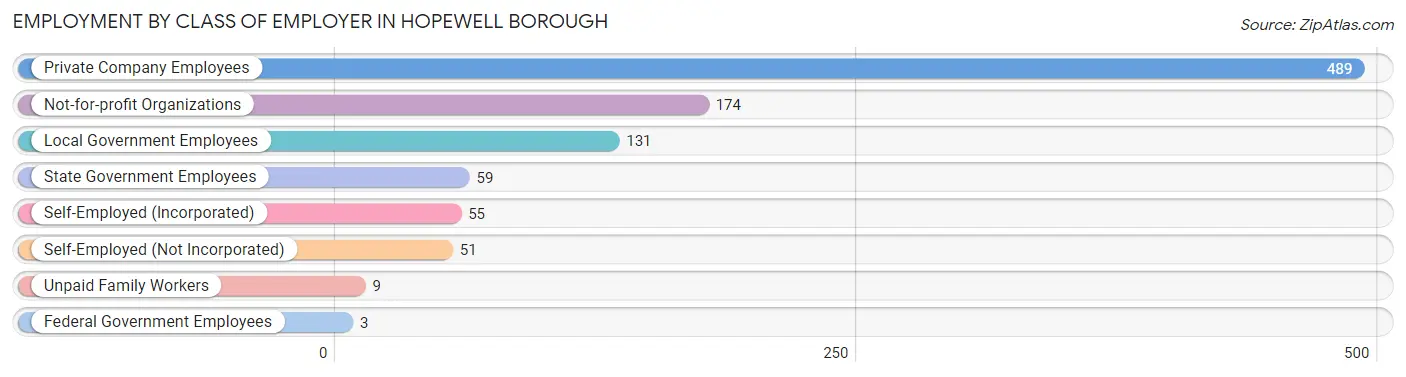
| Employer Class | # Employees | % Employees |
| Private Company Employees | 489 | 50.4% |
| Self-Employed (Incorporated) | 55 | 5.7% |
| Self-Employed (Not Incorporated) | 51 | 5.2% |
| Not-for-profit Organizations | 174 | 17.9% |
| Local Government Employees | 131 | 13.5% |
| State Government Employees | 59 | 6.1% |
| Federal Government Employees | 3 | 0.3% |
| Unpaid Family Workers | 9 | 0.9% |
| Total | 971 | 100.0% |
Employment Status by Age in Hopewell borough
According to the labor force statistics for Hopewell borough, out of the total population over 16 years of age (1,372), 74.3% or 1,019 individuals are in the labor force, with 1.9% or 19 of them unemployed. The age group with the highest labor force participation rate is 25 to 29 years, with 100.0% or 56 individuals in the labor force. Within the labor force, the 55 to 59 years age range has the highest percentage of unemployed individuals, with 12.1% or 15 of them being unemployed.
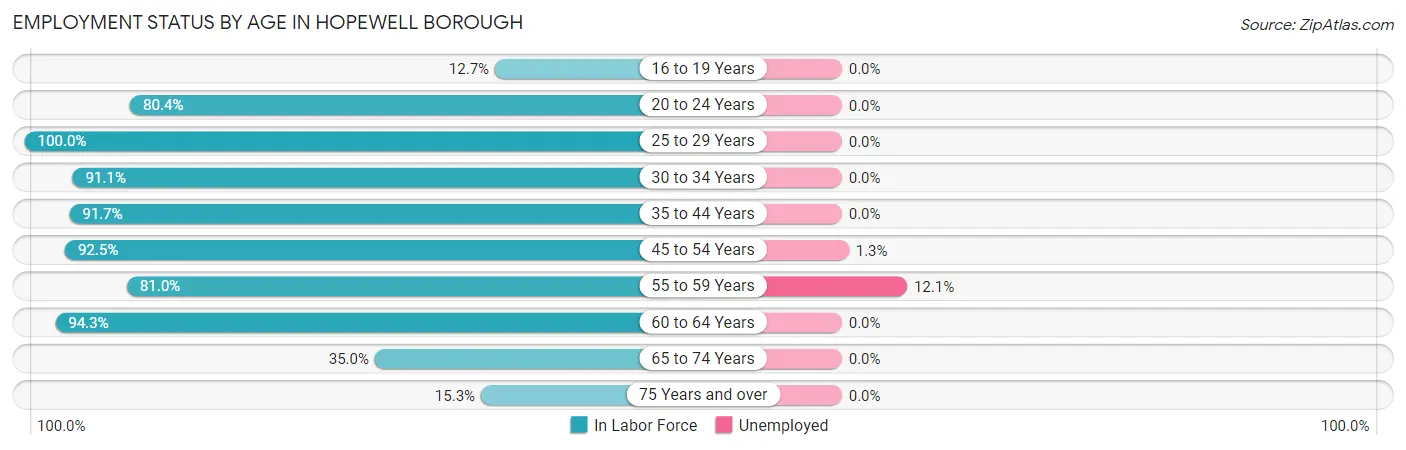
| Age Bracket | In Labor Force | Unemployed |
| 16 to 19 Years | 7 (12.7%) | 0 (0.0%) |
| 20 to 24 Years | 41 (80.4%) | 0 (0.0%) |
| 25 to 29 Years | 56 (100.0%) | 0 (0.0%) |
| 30 to 34 Years | 41 (91.1%) | 0 (0.0%) |
| 35 to 44 Years | 220 (91.7%) | 0 (0.0%) |
| 45 to 54 Years | 308 (92.5%) | 4 (1.3%) |
| 55 to 59 Years | 124 (81.0%) | 15 (12.1%) |
| 60 to 64 Years | 149 (94.3%) | 0 (0.0%) |
| 65 to 74 Years | 55 (35.0%) | 0 (0.0%) |
| 75 Years and over | 19 (15.3%) | 0 (0.0%) |
| Total | 1,019 (74.3%) | 19 (1.9%) |
Employment Status by Educational Attainment in Hopewell borough
According to labor force statistics for Hopewell borough, 91.2% of individuals (898) out of the total population between 25 and 64 years of age (985) are in the labor force, with 2.1% or 19 of them being unemployed. The group with the highest labor force participation rate are those with the educational attainment of college / associate degree, with 94.8% or 164 individuals in the labor force. Within the labor force, individuals with bachelor's degree or higher education have the highest percentage of unemployment, with 3.0% or 19 of them being unemployed.
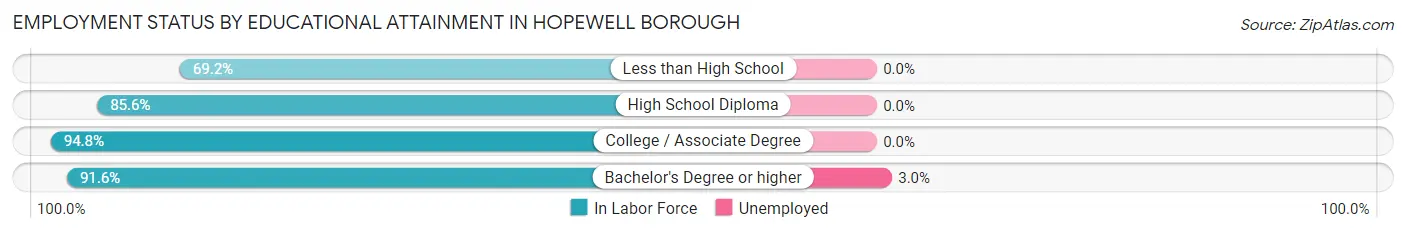
| Educational Attainment | In Labor Force | Unemployed |
| Less than High School | 9 (69.2%) | 0 (0.0%) |
| High School Diploma | 95 (85.6%) | 0 (0.0%) |
| College / Associate Degree | 164 (94.8%) | 0 (0.0%) |
| Bachelor's Degree or higher | 630 (91.6%) | 21 (3.0%) |
| Total | 898 (91.2%) | 21 (2.1%) |
Employment Occupations by Sex in Hopewell borough
Management, Business, Science and Arts Occupations
The most common Management, Business, Science and Arts occupations in Hopewell borough are Community & Social Service (291 | 29.1%), Management (182 | 18.2%), Education Instruction & Library (162 | 16.2%), Computers, Engineering & Science (90 | 9.0%), and Arts, Media & Entertainment (75 | 7.5%).
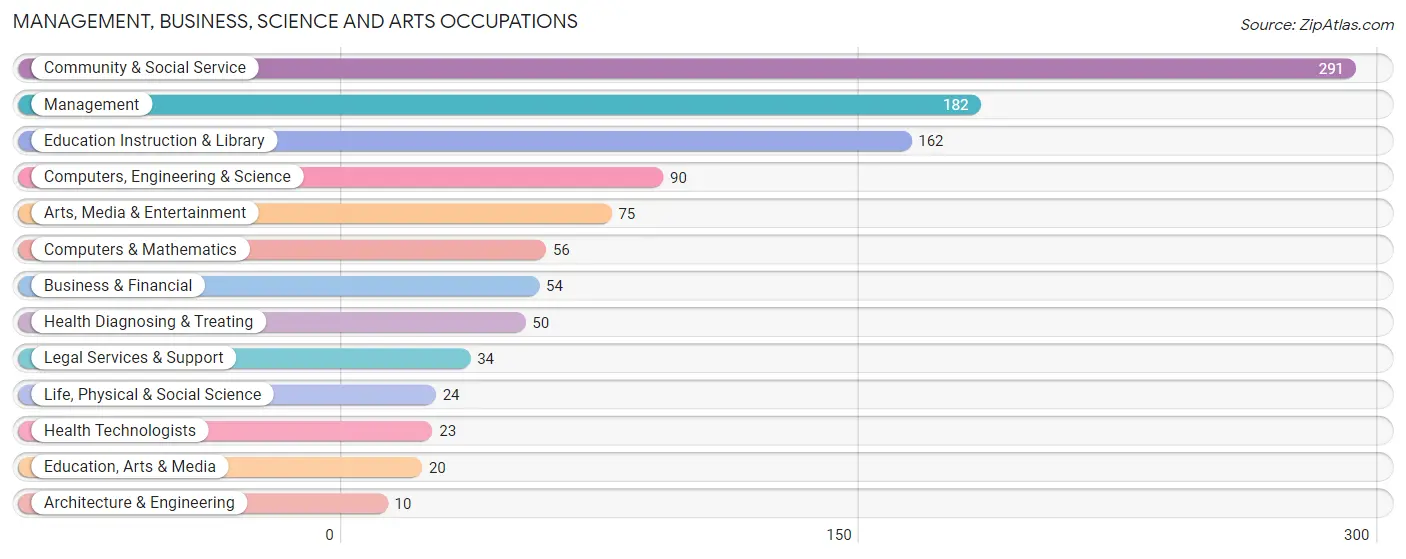
Management, Business, Science and Arts Occupations by Sex
Within the Management, Business, Science and Arts occupations in Hopewell borough, the most male-oriented occupations are Architecture & Engineering (100.0%), Life, Physical & Social Science (100.0%), and Computers, Engineering & Science (83.3%), while the most female-oriented occupations are Health Technologists (100.0%), Health Diagnosing & Treating (84.0%), and Education Instruction & Library (77.8%).
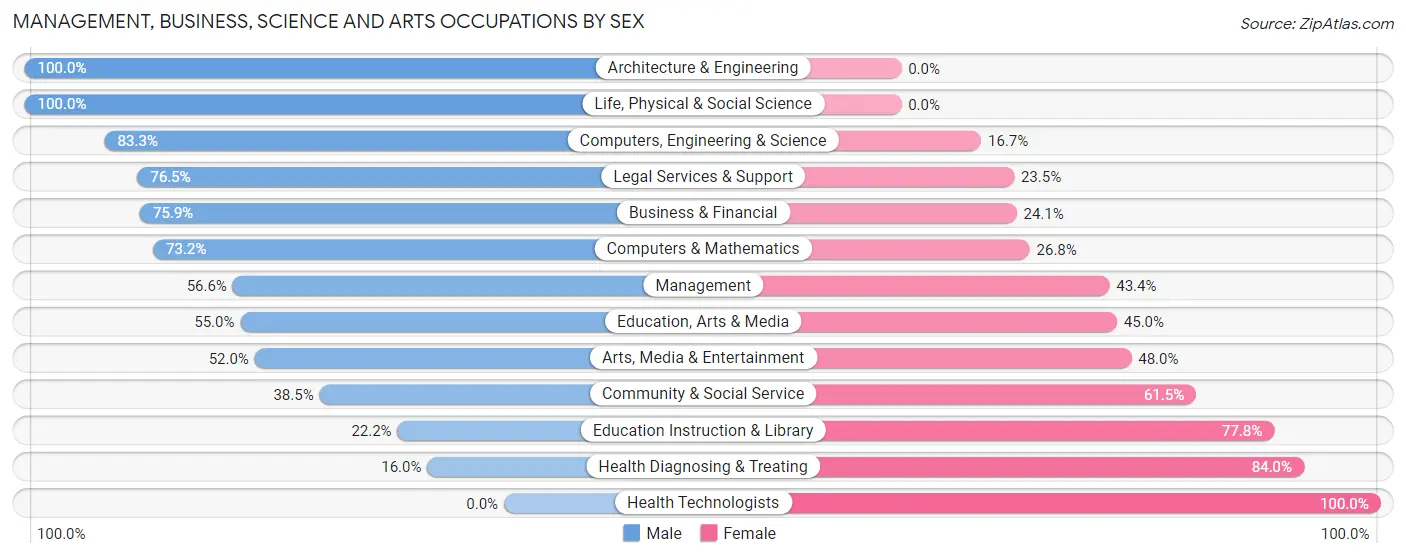
| Occupation | Male | Female |
| Management | 103 (56.6%) | 79 (43.4%) |
| Business & Financial | 41 (75.9%) | 13 (24.1%) |
| Computers, Engineering & Science | 75 (83.3%) | 15 (16.7%) |
| Computers & Mathematics | 41 (73.2%) | 15 (26.8%) |
| Architecture & Engineering | 10 (100.0%) | 0 (0.0%) |
| Life, Physical & Social Science | 24 (100.0%) | 0 (0.0%) |
| Community & Social Service | 112 (38.5%) | 179 (61.5%) |
| Education, Arts & Media | 11 (55.0%) | 9 (45.0%) |
| Legal Services & Support | 26 (76.5%) | 8 (23.5%) |
| Education Instruction & Library | 36 (22.2%) | 126 (77.8%) |
| Arts, Media & Entertainment | 39 (52.0%) | 36 (48.0%) |
| Health Diagnosing & Treating | 8 (16.0%) | 42 (84.0%) |
| Health Technologists | 0 (0.0%) | 23 (100.0%) |
| Total (Category) | 339 (50.8%) | 328 (49.2%) |
| Total (Overall) | 542 (54.1%) | 459 (45.9%) |
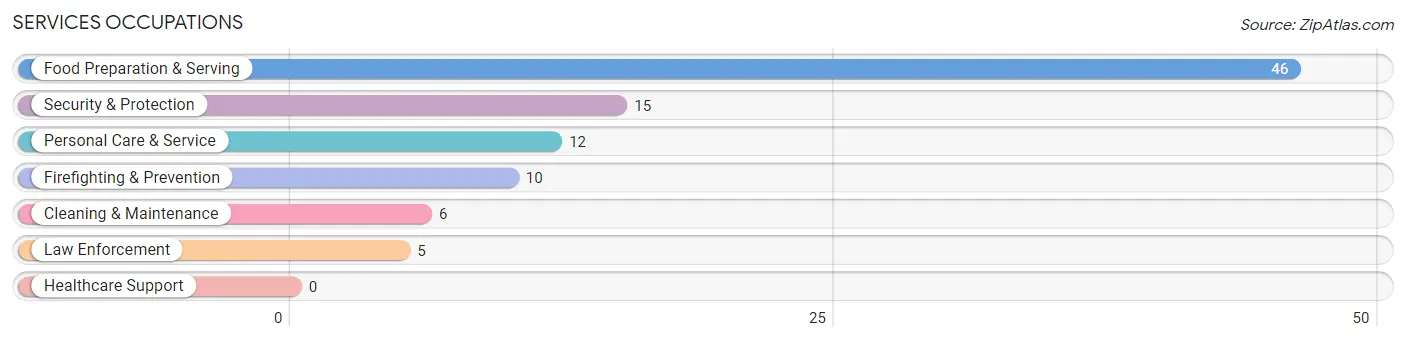
Services Occupations
The most common Services occupations in Hopewell borough are Food Preparation & Serving (46 | 4.6%), Security & Protection (15 | 1.5%), Personal Care & Service (12 | 1.2%), Firefighting & Prevention (10 | 1.0%), and Cleaning & Maintenance (6 | 0.6%).
Services Occupations by Sex
Within the Services occupations in Hopewell borough, the most male-oriented occupations are Cleaning & Maintenance (100.0%), Food Preparation & Serving (91.3%), and Firefighting & Prevention (70.0%), while the most female-oriented occupations are Law Enforcement (100.0%), Personal Care & Service (58.3%), and Security & Protection (53.3%).
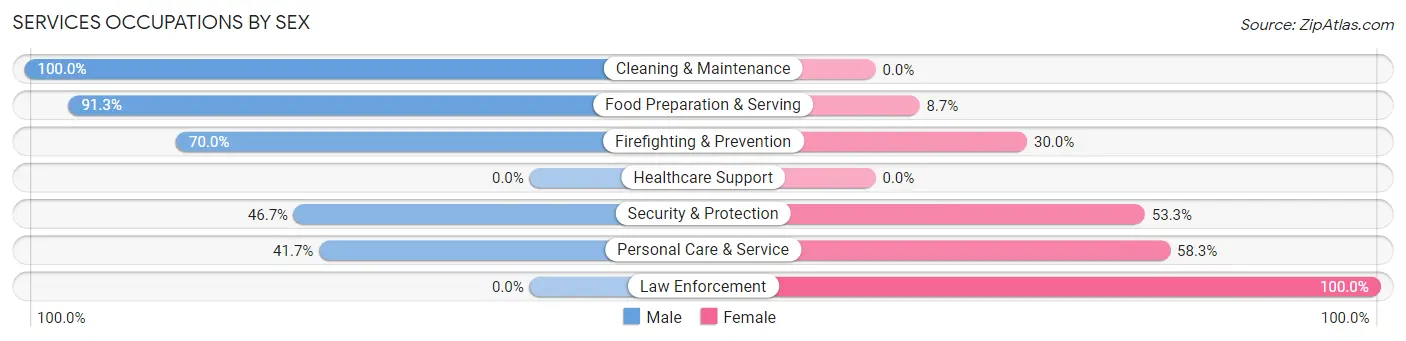
| Occupation | Male | Female |
| Healthcare Support | 0 (0.0%) | 0 (0.0%) |
| Security & Protection | 7 (46.7%) | 8 (53.3%) |
| Firefighting & Prevention | 7 (70.0%) | 3 (30.0%) |
| Law Enforcement | 0 (0.0%) | 5 (100.0%) |
| Food Preparation & Serving | 42 (91.3%) | 4 (8.7%) |
| Cleaning & Maintenance | 6 (100.0%) | 0 (0.0%) |
| Personal Care & Service | 5 (41.7%) | 7 (58.3%) |
| Total (Category) | 60 (75.9%) | 19 (24.0%) |
| Total (Overall) | 542 (54.1%) | 459 (45.9%) |
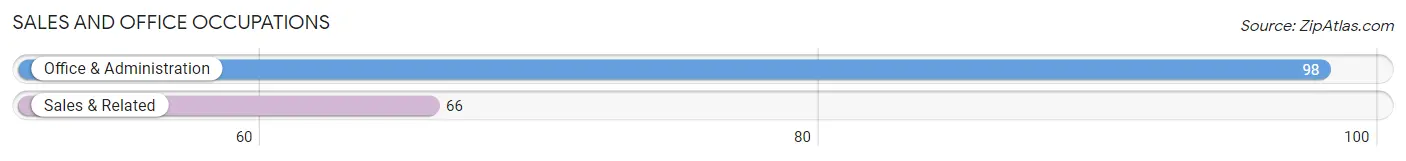
Sales and Office Occupations
The most common Sales and Office occupations in Hopewell borough are Office & Administration (98 | 9.8%), and Sales & Related (66 | 6.6%).
Sales and Office Occupations by Sex
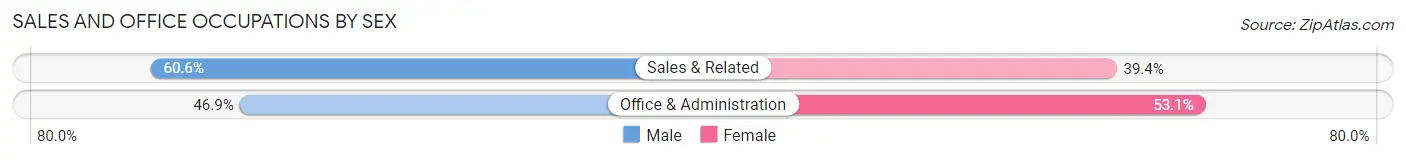
| Occupation | Male | Female |
| Sales & Related | 40 (60.6%) | 26 (39.4%) |
| Office & Administration | 46 (46.9%) | 52 (53.1%) |
| Total (Category) | 86 (52.4%) | 78 (47.6%) |
| Total (Overall) | 542 (54.1%) | 459 (45.9%) |
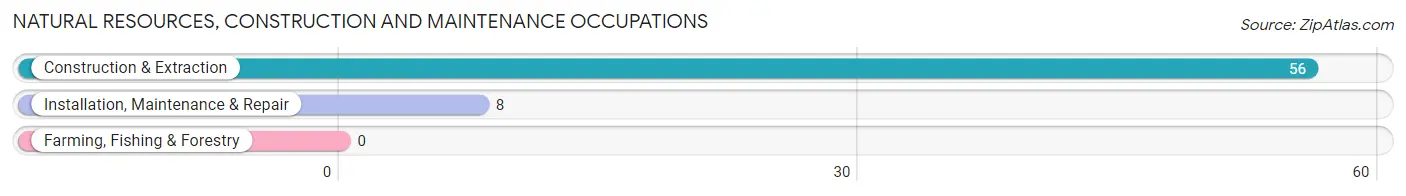
Natural Resources, Construction and Maintenance Occupations
The most common Natural Resources, Construction and Maintenance occupations in Hopewell borough are Construction & Extraction (56 | 5.6%), and Installation, Maintenance & Repair (8 | 0.8%).
Natural Resources, Construction and Maintenance Occupations by Sex
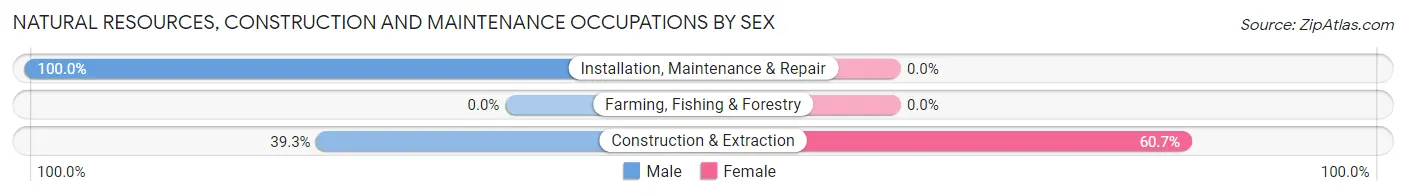
| Occupation | Male | Female |
| Farming, Fishing & Forestry | 0 (0.0%) | 0 (0.0%) |
| Construction & Extraction | 22 (39.3%) | 34 (60.7%) |
| Installation, Maintenance & Repair | 8 (100.0%) | 0 (0.0%) |
| Total (Category) | 30 (46.9%) | 34 (53.1%) |
| Total (Overall) | 542 (54.1%) | 459 (45.9%) |
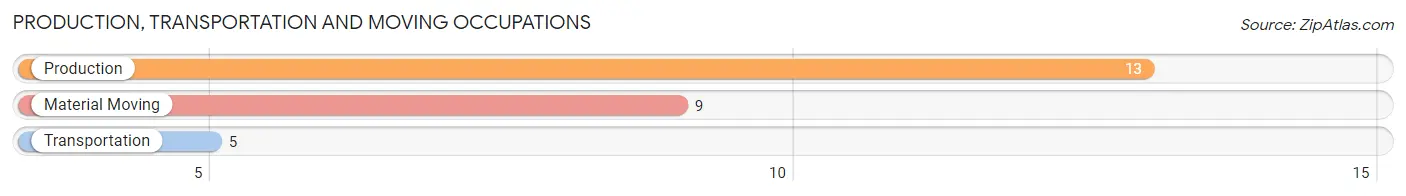
Production, Transportation and Moving Occupations
The most common Production, Transportation and Moving occupations in Hopewell borough are Production (13 | 1.3%), Material Moving (9 | 0.9%), and Transportation (5 | 0.5%).
Production, Transportation and Moving Occupations by Sex
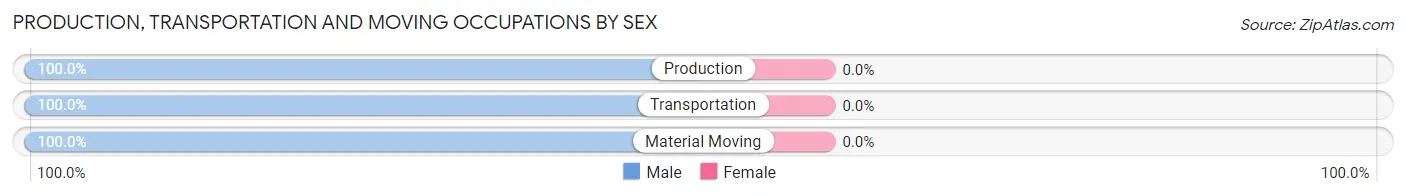
| Occupation | Male | Female |
| Production | 13 (100.0%) | 0 (0.0%) |
| Transportation | 5 (100.0%) | 0 (0.0%) |
| Material Moving | 9 (100.0%) | 0 (0.0%) |
| Total (Category) | 27 (100.0%) | 0 (0.0%) |
| Total (Overall) | 542 (54.1%) | 459 (45.9%) |
Employment Industries by Sex in Hopewell borough
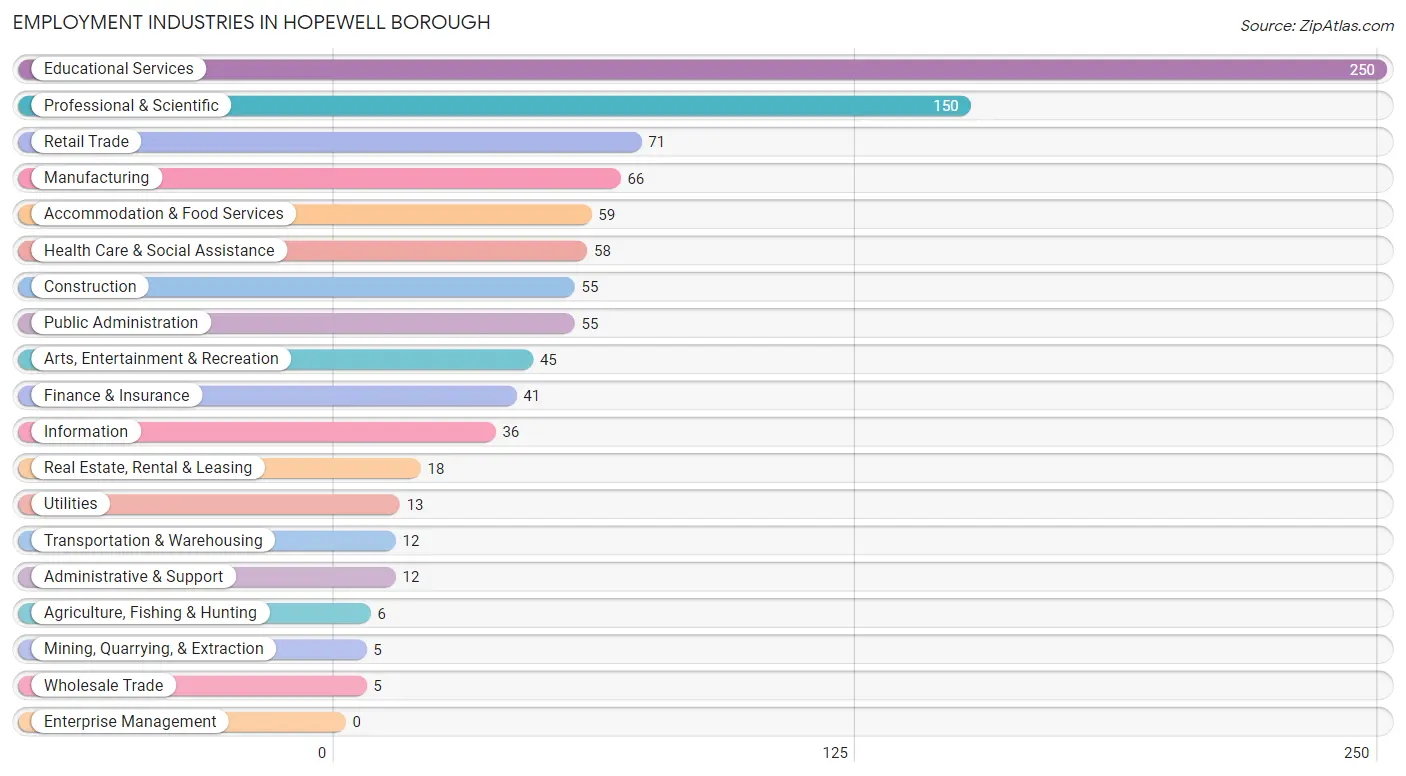
Employment Industries in Hopewell borough
The major employment industries in Hopewell borough include Educational Services (250 | 25.0%), Professional & Scientific (150 | 15.0%), Retail Trade (71 | 7.1%), Manufacturing (66 | 6.6%), and Accommodation & Food Services (59 | 5.9%).
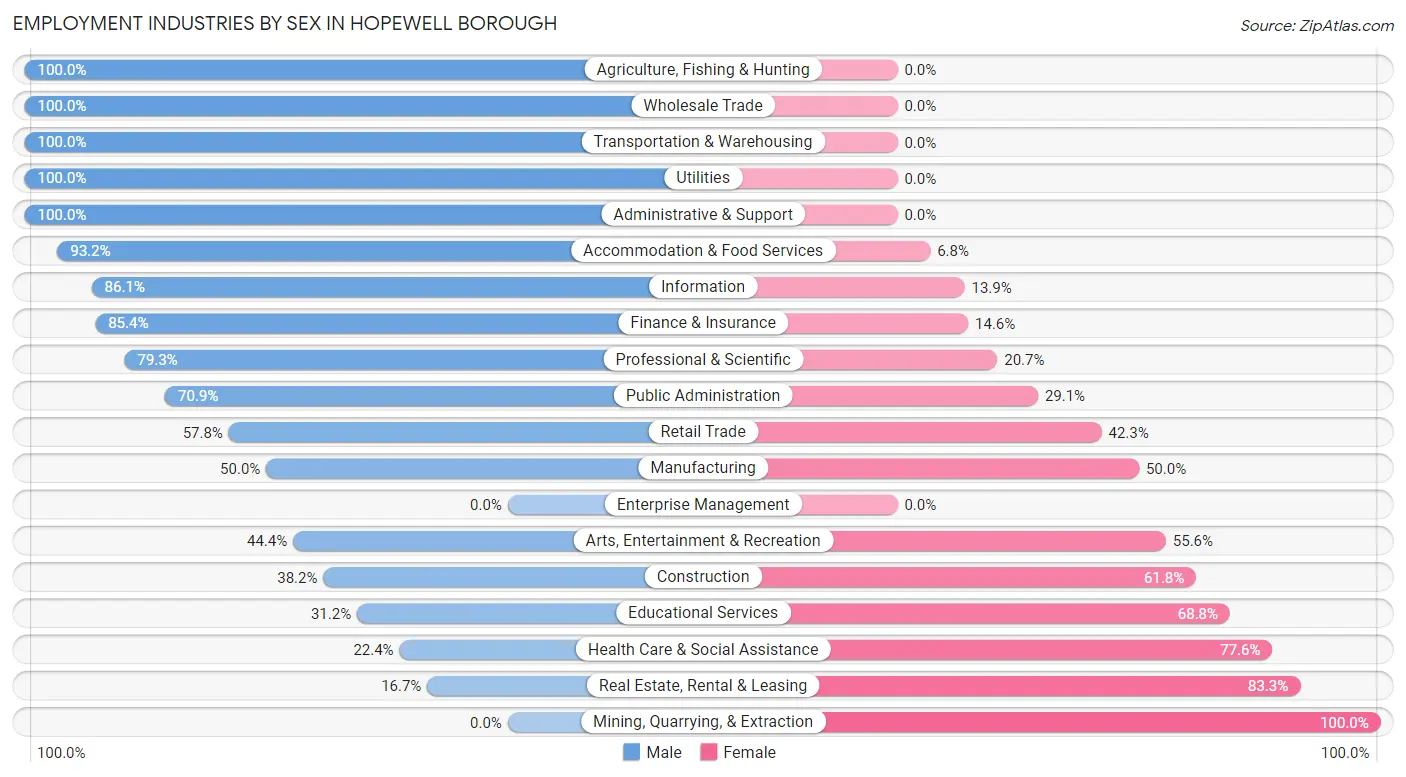
Employment Industries by Sex in Hopewell borough
The Hopewell borough industries that see more men than women are Agriculture, Fishing & Hunting (100.0%), Wholesale Trade (100.0%), and Transportation & Warehousing (100.0%), whereas the industries that tend to have a higher number of women are Mining, Quarrying, & Extraction (100.0%), Real Estate, Rental & Leasing (83.3%), and Health Care & Social Assistance (77.6%).
| Industry | Male | Female |
| Agriculture, Fishing & Hunting | 6 (100.0%) | 0 (0.0%) |
| Mining, Quarrying, & Extraction | 0 (0.0%) | 5 (100.0%) |
| Construction | 21 (38.2%) | 34 (61.8%) |
| Manufacturing | 33 (50.0%) | 33 (50.0%) |
| Wholesale Trade | 5 (100.0%) | 0 (0.0%) |
| Retail Trade | 41 (57.8%) | 30 (42.2%) |
| Transportation & Warehousing | 12 (100.0%) | 0 (0.0%) |
| Utilities | 13 (100.0%) | 0 (0.0%) |
| Information | 31 (86.1%) | 5 (13.9%) |
| Finance & Insurance | 35 (85.4%) | 6 (14.6%) |
| Real Estate, Rental & Leasing | 3 (16.7%) | 15 (83.3%) |
| Professional & Scientific | 119 (79.3%) | 31 (20.7%) |
| Enterprise Management | 0 (0.0%) | 0 (0.0%) |
| Administrative & Support | 12 (100.0%) | 0 (0.0%) |
| Educational Services | 78 (31.2%) | 172 (68.8%) |
| Health Care & Social Assistance | 13 (22.4%) | 45 (77.6%) |
| Arts, Entertainment & Recreation | 20 (44.4%) | 25 (55.6%) |
| Accommodation & Food Services | 55 (93.2%) | 4 (6.8%) |
| Public Administration | 39 (70.9%) | 16 (29.1%) |
| Total | 542 (54.1%) | 459 (45.9%) |
Education in Hopewell borough
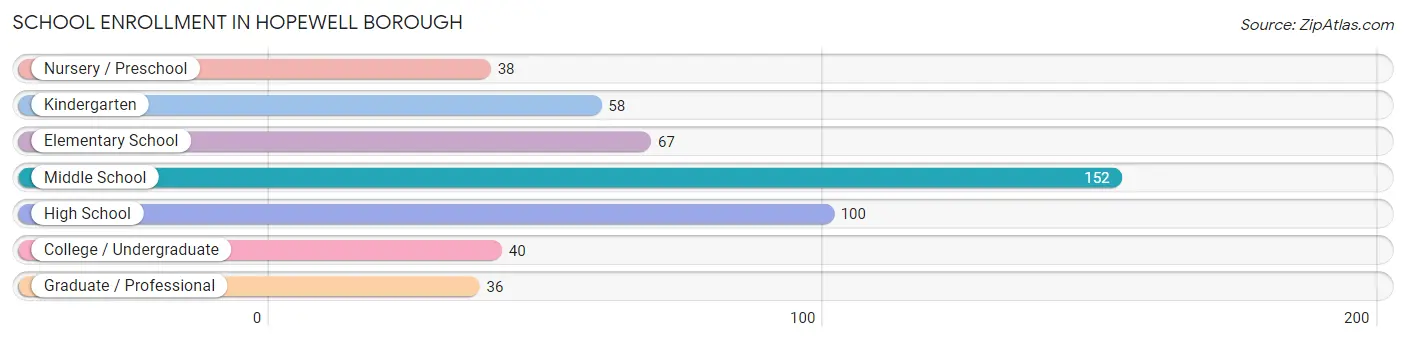
School Enrollment in Hopewell borough
The most common levels of schooling among the 491 students in Hopewell borough are middle school (152 | 31.0%), high school (100 | 20.4%), and elementary school (67 | 13.7%).
| School Level | # Students | % Students |
| Nursery / Preschool | 38 | 7.7% |
| Kindergarten | 58 | 11.8% |
| Elementary School | 67 | 13.7% |
| Middle School | 152 | 31.0% |
| High School | 100 | 20.4% |
| College / Undergraduate | 40 | 8.2% |
| Graduate / Professional | 36 | 7.3% |
| Total | 491 | 100.0% |
School Enrollment by Age by Funding Source in Hopewell borough
Out of a total of 491 students who are enrolled in schools in Hopewell borough, 128 (26.1%) attend a private institution, while the remaining 363 (73.9%) are enrolled in public schools. The age group of 3 to 4 year olds has the highest likelihood of being enrolled in private schools, with 30 (100.0% in the age bracket) enrolled. Conversely, the age group of 18 to 19 year olds has the lowest likelihood of being enrolled in a private school, with 29 (100.0% in the age bracket) attending a public institution.
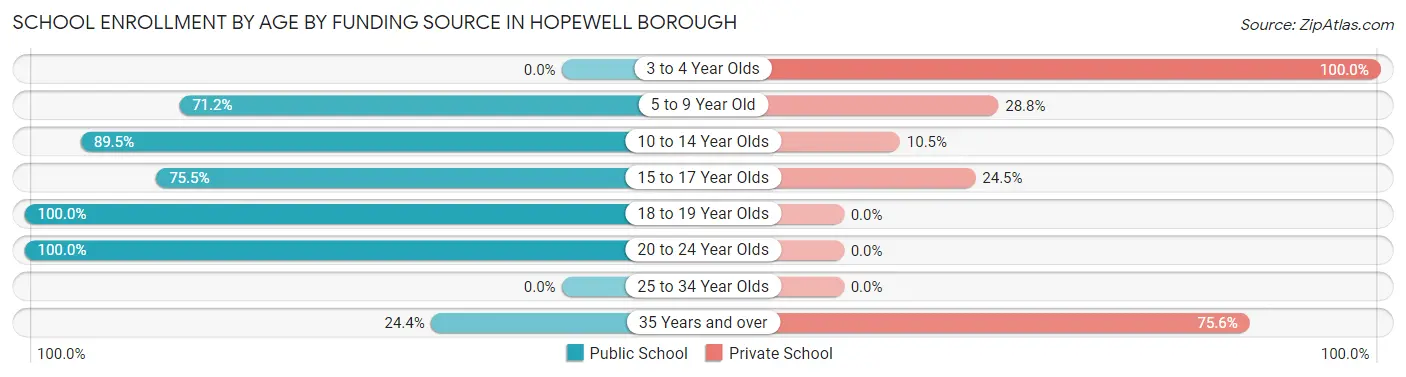
| Age Bracket | Public School | Private School |
| 3 to 4 Year Olds | 0 (0.0%) | 30 (100.0%) |
| 5 to 9 Year Old | 89 (71.2%) | 36 (28.8%) |
| 10 to 14 Year Olds | 154 (89.5%) | 18 (10.5%) |
| 15 to 17 Year Olds | 40 (75.5%) | 13 (24.5%) |
| 18 to 19 Year Olds | 29 (100.0%) | 0 (0.0%) |
| 20 to 24 Year Olds | 41 (100.0%) | 0 (0.0%) |
| 25 to 34 Year Olds | 0 (0.0%) | 0 (0.0%) |
| 35 Years and over | 10 (24.4%) | 31 (75.6%) |
| Total | 363 (73.9%) | 128 (26.1%) |
Educational Attainment by Field of Study in Hopewell borough
Literature & languages (124 | 12.9%), liberal arts & history (104 | 10.8%), visual & performing arts (97 | 10.1%), social sciences (93 | 9.7%), and communications (74 | 7.7%) are the most common fields of study among 960 individuals in Hopewell borough who have obtained a bachelor's degree or higher.
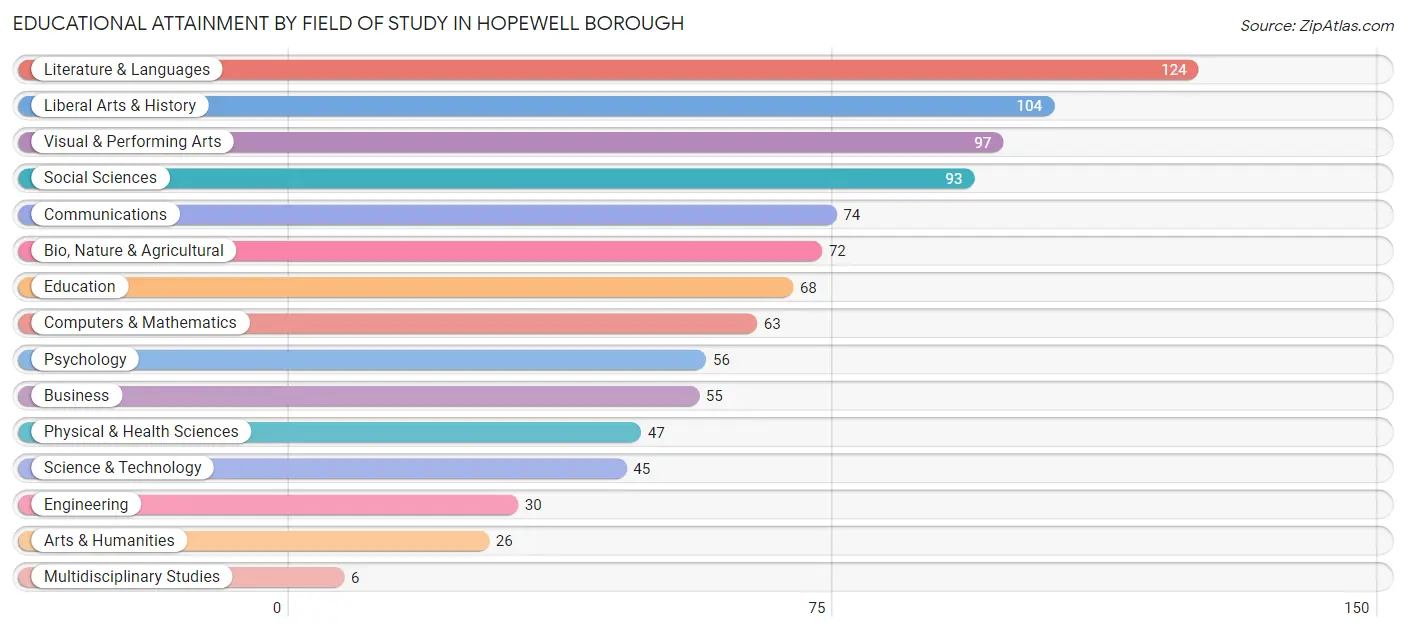
| Field of Study | # Graduates | % Graduates |
| Computers & Mathematics | 63 | 6.6% |
| Bio, Nature & Agricultural | 72 | 7.5% |
| Physical & Health Sciences | 47 | 4.9% |
| Psychology | 56 | 5.8% |
| Social Sciences | 93 | 9.7% |
| Engineering | 30 | 3.1% |
| Multidisciplinary Studies | 6 | 0.6% |
| Science & Technology | 45 | 4.7% |
| Business | 55 | 5.7% |
| Education | 68 | 7.1% |
| Literature & Languages | 124 | 12.9% |
| Liberal Arts & History | 104 | 10.8% |
| Visual & Performing Arts | 97 | 10.1% |
| Communications | 74 | 7.7% |
| Arts & Humanities | 26 | 2.7% |
| Total | 960 | 100.0% |
Transportation & Commute in Hopewell borough
Vehicle Availability by Sex in Hopewell borough
The most prevalent vehicle ownership categories in Hopewell borough are males with 2 vehicles (329, accounting for 61.5%) and females with 2 vehicles (313, making up 75.5%).
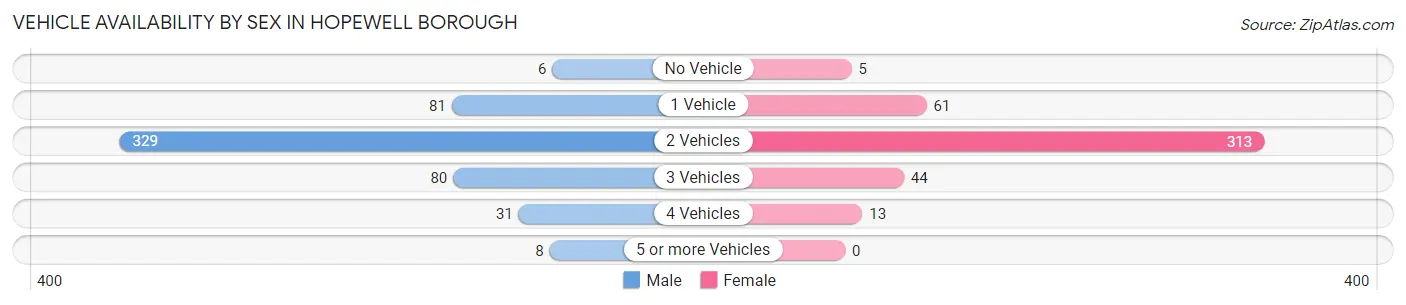
| Vehicles Available | Male | Female |
| No Vehicle | 6 (1.1%) | 5 (1.1%) |
| 1 Vehicle | 81 (15.1%) | 61 (14.0%) |
| 2 Vehicles | 329 (61.5%) | 313 (71.8%) |
| 3 Vehicles | 80 (14.9%) | 44 (10.1%) |
| 4 Vehicles | 31 (5.8%) | 13 (3.0%) |
| 5 or more Vehicles | 8 (1.5%) | 0 (0.0%) |
| Total | 535 (100.0%) | 436 (100.0%) |
Commute Time in Hopewell borough
The most frequently occuring commute durations in Hopewell borough are 30 to 34 minutes (114 commuters, 15.0%), 15 to 19 minutes (112 commuters, 14.7%), and 20 to 24 minutes (96 commuters, 12.6%).
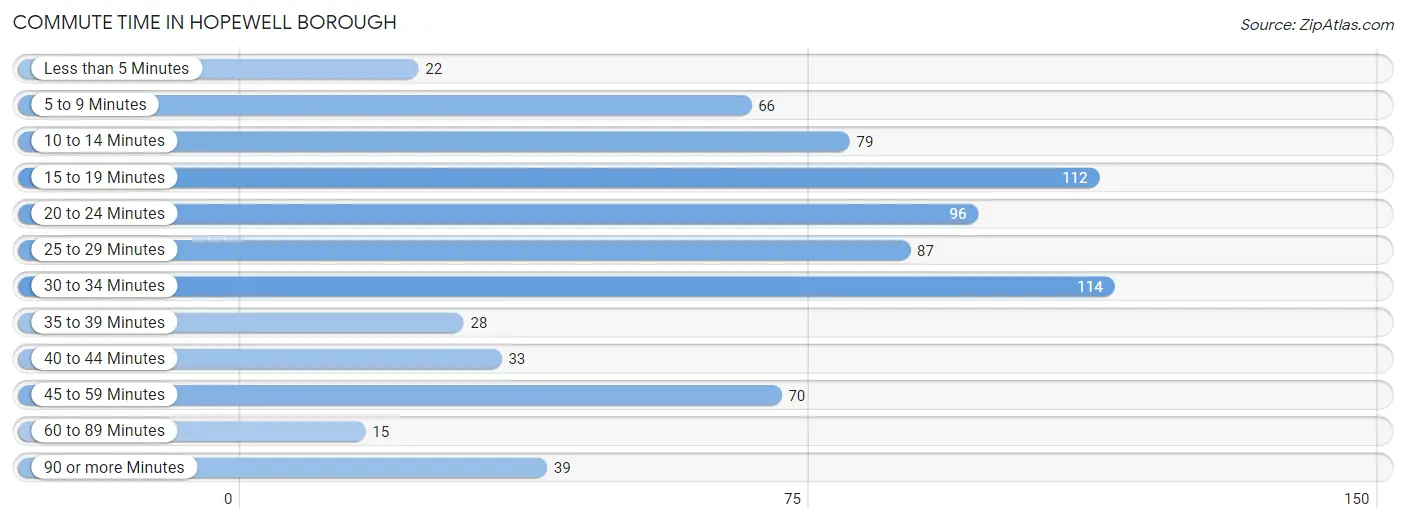
| Commute Time | # Commuters | % Commuters |
| Less than 5 Minutes | 22 | 2.9% |
| 5 to 9 Minutes | 66 | 8.7% |
| 10 to 14 Minutes | 79 | 10.4% |
| 15 to 19 Minutes | 112 | 14.7% |
| 20 to 24 Minutes | 96 | 12.6% |
| 25 to 29 Minutes | 87 | 11.4% |
| 30 to 34 Minutes | 114 | 15.0% |
| 35 to 39 Minutes | 28 | 3.7% |
| 40 to 44 Minutes | 33 | 4.3% |
| 45 to 59 Minutes | 70 | 9.2% |
| 60 to 89 Minutes | 15 | 2.0% |
| 90 or more Minutes | 39 | 5.1% |
Commute Time by Sex in Hopewell borough
The most common commute times in Hopewell borough are 30 to 34 minutes (63 commuters, 15.2%) for males and 15 to 19 minutes (60 commuters, 17.3%) for females.
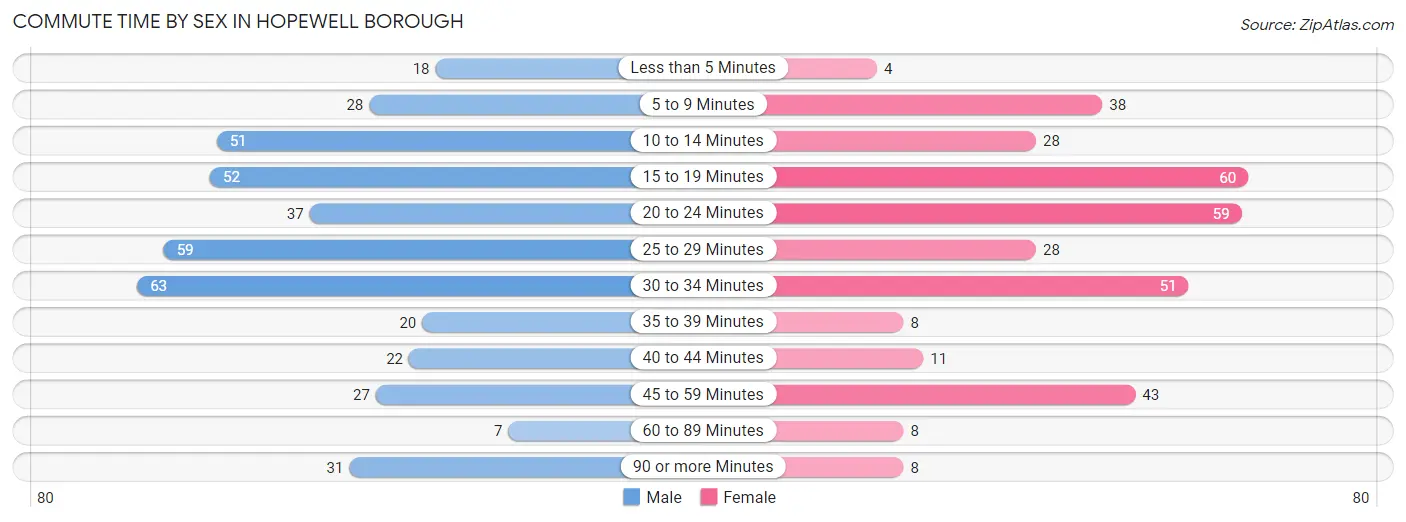
| Commute Time | Male | Female |
| Less than 5 Minutes | 18 (4.3%) | 4 (1.2%) |
| 5 to 9 Minutes | 28 (6.8%) | 38 (11.0%) |
| 10 to 14 Minutes | 51 (12.3%) | 28 (8.1%) |
| 15 to 19 Minutes | 52 (12.5%) | 60 (17.3%) |
| 20 to 24 Minutes | 37 (8.9%) | 59 (17.1%) |
| 25 to 29 Minutes | 59 (14.2%) | 28 (8.1%) |
| 30 to 34 Minutes | 63 (15.2%) | 51 (14.7%) |
| 35 to 39 Minutes | 20 (4.8%) | 8 (2.3%) |
| 40 to 44 Minutes | 22 (5.3%) | 11 (3.2%) |
| 45 to 59 Minutes | 27 (6.5%) | 43 (12.4%) |
| 60 to 89 Minutes | 7 (1.7%) | 8 (2.3%) |
| 90 or more Minutes | 31 (7.5%) | 8 (2.3%) |
Time of Departure to Work by Sex in Hopewell borough
The most frequent times of departure to work in Hopewell borough are 7:00 AM to 7:29 AM (73, 17.6%) for males and 8:00 AM to 8:29 AM (86, 24.9%) for females.
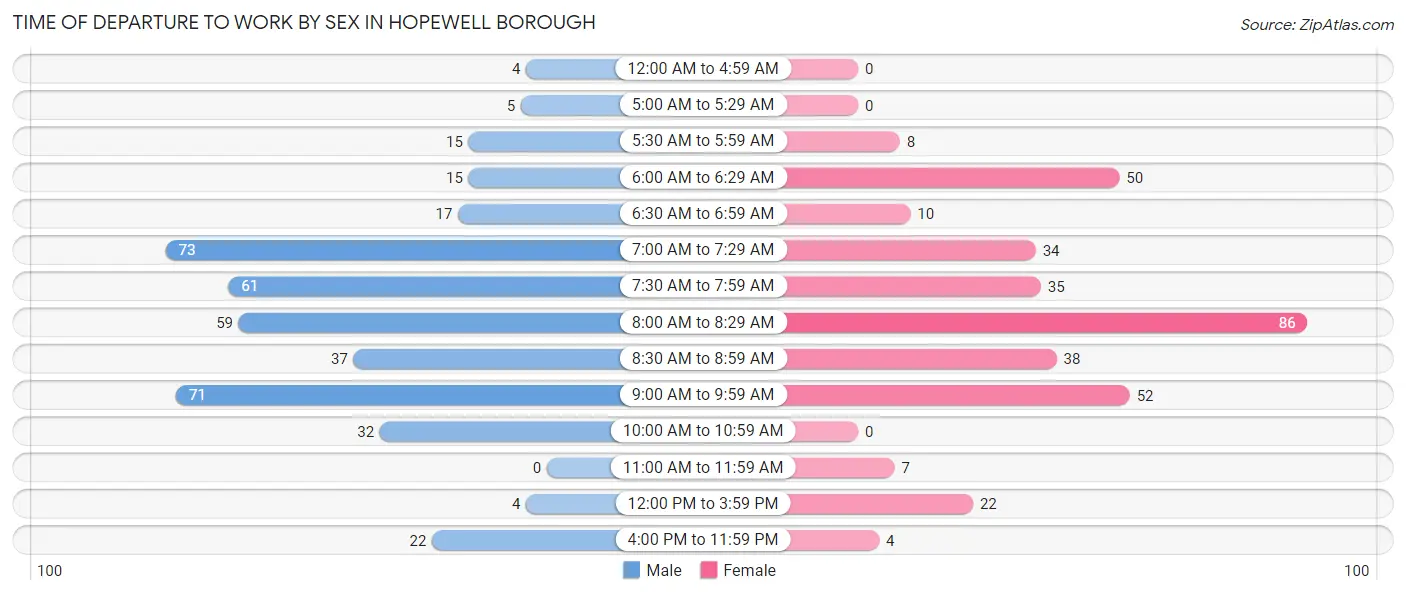
| Time of Departure | Male | Female |
| 12:00 AM to 4:59 AM | 4 (1.0%) | 0 (0.0%) |
| 5:00 AM to 5:29 AM | 5 (1.2%) | 0 (0.0%) |
| 5:30 AM to 5:59 AM | 15 (3.6%) | 8 (2.3%) |
| 6:00 AM to 6:29 AM | 15 (3.6%) | 50 (14.4%) |
| 6:30 AM to 6:59 AM | 17 (4.1%) | 10 (2.9%) |
| 7:00 AM to 7:29 AM | 73 (17.6%) | 34 (9.8%) |
| 7:30 AM to 7:59 AM | 61 (14.7%) | 35 (10.1%) |
| 8:00 AM to 8:29 AM | 59 (14.2%) | 86 (24.9%) |
| 8:30 AM to 8:59 AM | 37 (8.9%) | 38 (11.0%) |
| 9:00 AM to 9:59 AM | 71 (17.1%) | 52 (15.0%) |
| 10:00 AM to 10:59 AM | 32 (7.7%) | 0 (0.0%) |
| 11:00 AM to 11:59 AM | 0 (0.0%) | 7 (2.0%) |
| 12:00 PM to 3:59 PM | 4 (1.0%) | 22 (6.4%) |
| 4:00 PM to 11:59 PM | 22 (5.3%) | 4 (1.2%) |
| Total | 415 (100.0%) | 346 (100.0%) |
Housing Occupancy in Hopewell borough
Occupancy by Ownership in Hopewell borough
Of the total 755 dwellings in Hopewell borough, owner-occupied units account for 581 (76.9%), while renter-occupied units make up 174 (23.1%).
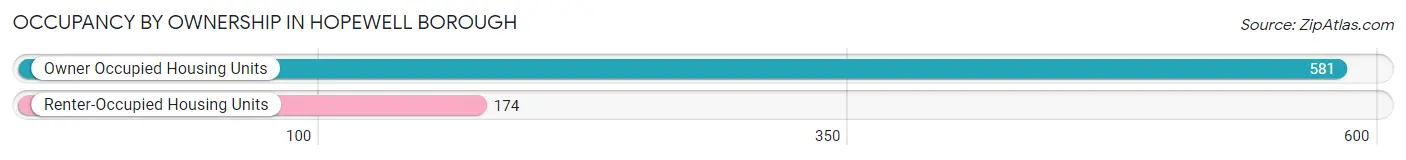
| Occupancy | # Housing Units | % Housing Units |
| Owner Occupied Housing Units | 581 | 76.9% |
| Renter-Occupied Housing Units | 174 | 23.1% |
| Total Occupied Housing Units | 755 | 100.0% |
Occupancy by Household Size in Hopewell borough
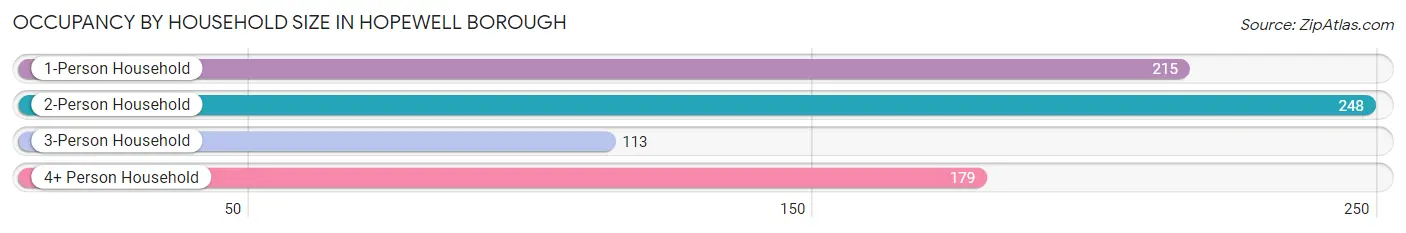
| Household Size | # Housing Units | % Housing Units |
| 1-Person Household | 215 | 28.5% |
| 2-Person Household | 248 | 32.9% |
| 3-Person Household | 113 | 15.0% |
| 4+ Person Household | 179 | 23.7% |
| Total Housing Units | 755 | 100.0% |
Occupancy by Ownership by Household Size in Hopewell borough
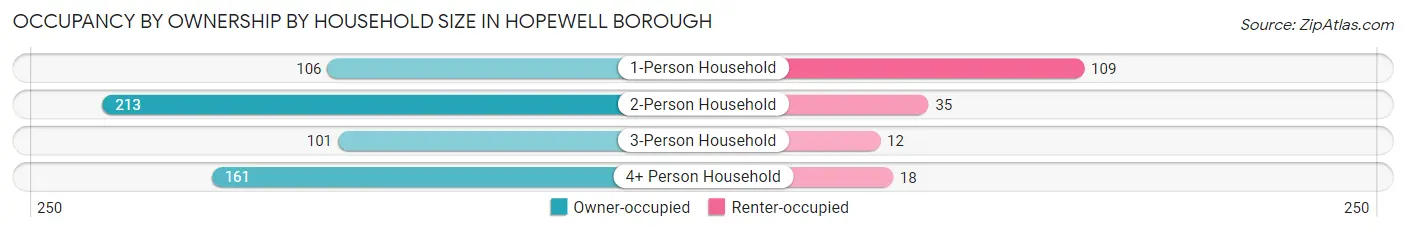
| Household Size | Owner-occupied | Renter-occupied |
| 1-Person Household | 106 (49.3%) | 109 (50.7%) |
| 2-Person Household | 213 (85.9%) | 35 (14.1%) |
| 3-Person Household | 101 (89.4%) | 12 (10.6%) |
| 4+ Person Household | 161 (89.9%) | 18 (10.1%) |
| Total Housing Units | 581 (76.9%) | 174 (23.1%) |
Occupancy by Educational Attainment in Hopewell borough
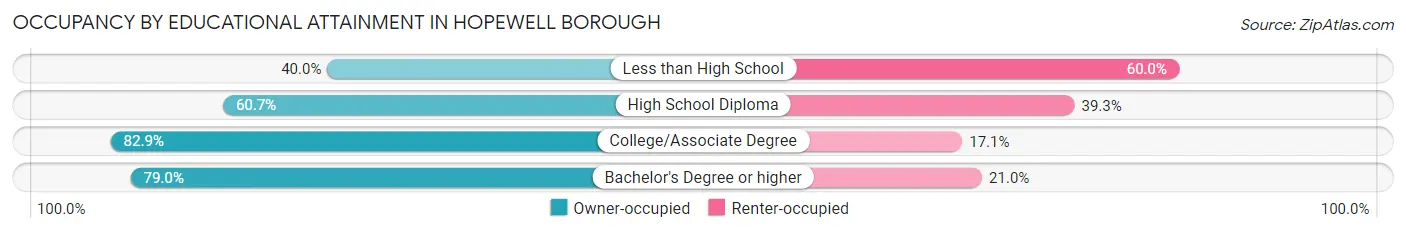
| Household Size | Owner-occupied | Renter-occupied |
| Less than High School | 4 (40.0%) | 6 (60.0%) |
| High School Diploma | 54 (60.7%) | 35 (39.3%) |
| College/Associate Degree | 102 (82.9%) | 21 (17.1%) |
| Bachelor's Degree or higher | 421 (79.0%) | 112 (21.0%) |
Occupancy by Age of Householder in Hopewell borough
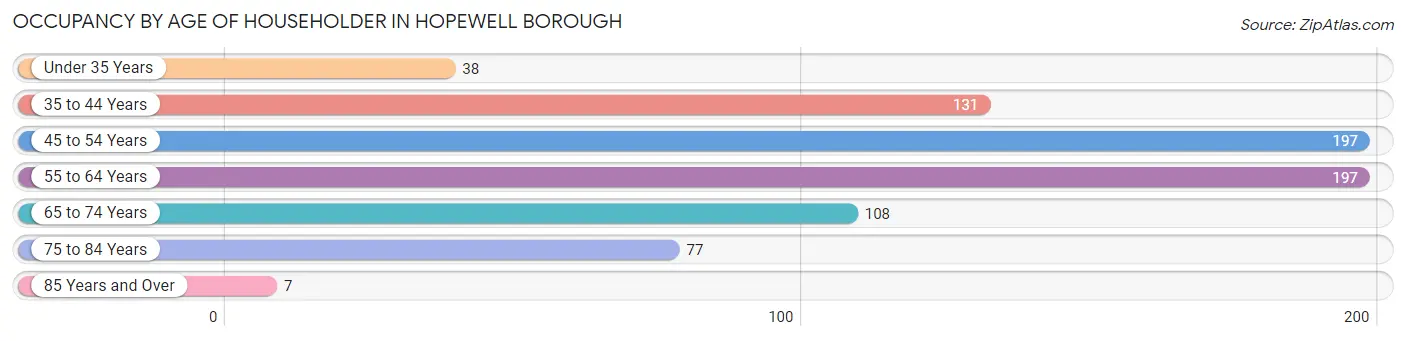
| Age Bracket | # Households | % Households |
| Under 35 Years | 38 | 5.0% |
| 35 to 44 Years | 131 | 17.3% |
| 45 to 54 Years | 197 | 26.1% |
| 55 to 64 Years | 197 | 26.1% |
| 65 to 74 Years | 108 | 14.3% |
| 75 to 84 Years | 77 | 10.2% |
| 85 Years and Over | 7 | 0.9% |
| Total | 755 | 100.0% |
Housing Finances in Hopewell borough
Median Income by Occupancy in Hopewell borough
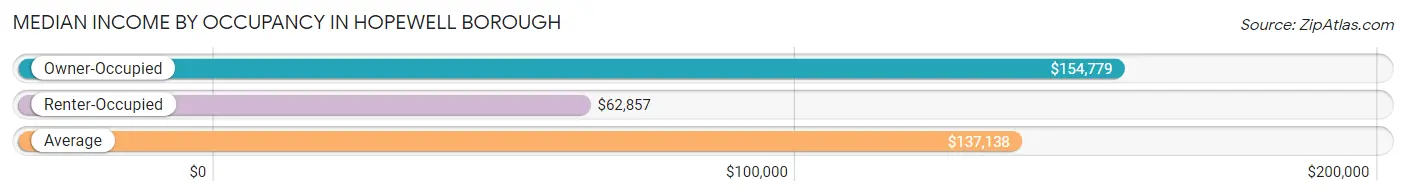
| Occupancy Type | # Households | Median Income |
| Owner-Occupied | 581 (76.9%) | $154,779 |
| Renter-Occupied | 174 (23.1%) | $62,857 |
| Average | 755 (100.0%) | $137,138 |
Occupancy by Householder Income Bracket in Hopewell borough
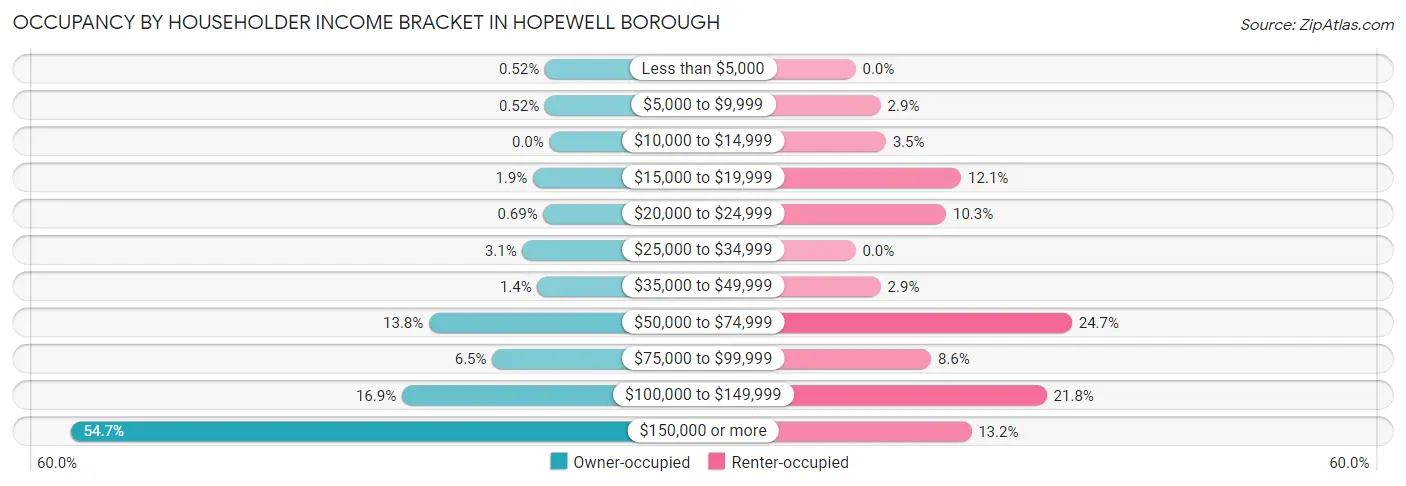
| Income Bracket | Owner-occupied | Renter-occupied |
| Less than $5,000 | 3 (0.5%) | 0 (0.0%) |
| $5,000 to $9,999 | 3 (0.5%) | 5 (2.9%) |
| $10,000 to $14,999 | 0 (0.0%) | 6 (3.5%) |
| $15,000 to $19,999 | 11 (1.9%) | 21 (12.1%) |
| $20,000 to $24,999 | 4 (0.7%) | 18 (10.3%) |
| $25,000 to $34,999 | 18 (3.1%) | 0 (0.0%) |
| $35,000 to $49,999 | 8 (1.4%) | 5 (2.9%) |
| $50,000 to $74,999 | 80 (13.8%) | 43 (24.7%) |
| $75,000 to $99,999 | 38 (6.5%) | 15 (8.6%) |
| $100,000 to $149,999 | 98 (16.9%) | 38 (21.8%) |
| $150,000 or more | 318 (54.7%) | 23 (13.2%) |
| Total | 581 (100.0%) | 174 (100.0%) |
Monthly Housing Cost Tiers in Hopewell borough
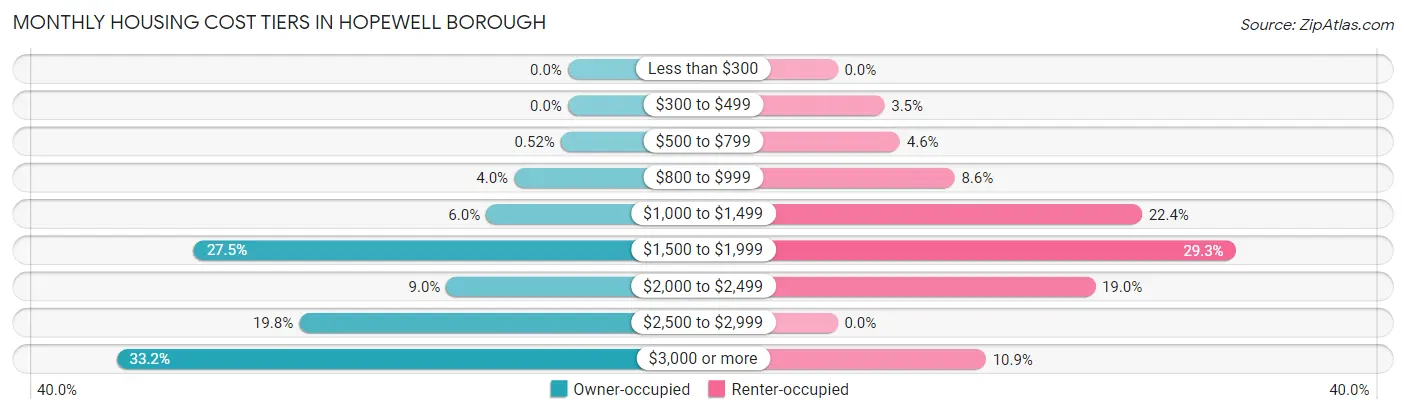
| Monthly Cost | Owner-occupied | Renter-occupied |
| Less than $300 | 0 (0.0%) | 0 (0.0%) |
| $300 to $499 | 0 (0.0%) | 6 (3.5%) |
| $500 to $799 | 3 (0.5%) | 8 (4.6%) |
| $800 to $999 | 23 (4.0%) | 15 (8.6%) |
| $1,000 to $1,499 | 35 (6.0%) | 39 (22.4%) |
| $1,500 to $1,999 | 160 (27.5%) | 51 (29.3%) |
| $2,000 to $2,499 | 52 (8.9%) | 33 (19.0%) |
| $2,500 to $2,999 | 115 (19.8%) | 0 (0.0%) |
| $3,000 or more | 193 (33.2%) | 19 (10.9%) |
| Total | 581 (100.0%) | 174 (100.0%) |
Physical Housing Characteristics in Hopewell borough
Housing Structures in Hopewell borough
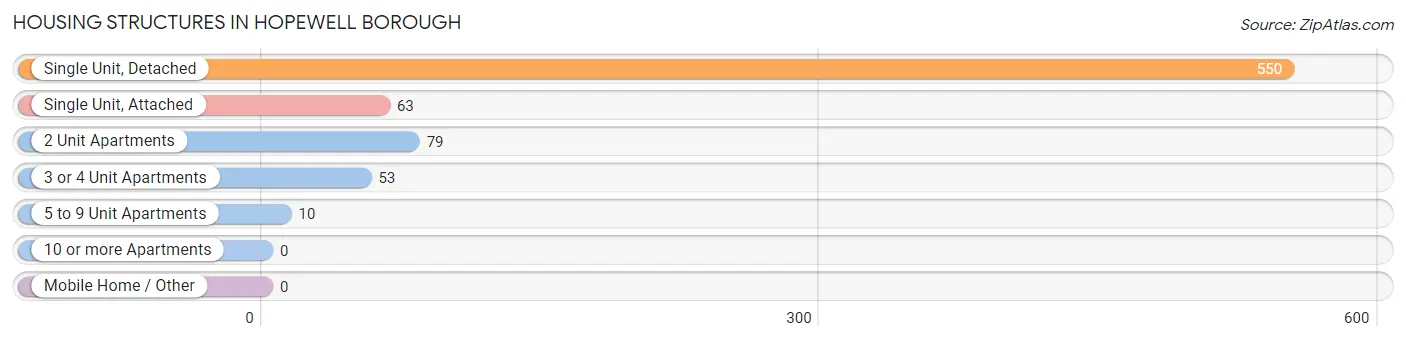
| Structure Type | # Housing Units | % Housing Units |
| Single Unit, Detached | 550 | 72.9% |
| Single Unit, Attached | 63 | 8.3% |
| 2 Unit Apartments | 79 | 10.5% |
| 3 or 4 Unit Apartments | 53 | 7.0% |
| 5 to 9 Unit Apartments | 10 | 1.3% |
| 10 or more Apartments | 0 | 0.0% |
| Mobile Home / Other | 0 | 0.0% |
| Total | 755 | 100.0% |
Housing Structures by Occupancy in Hopewell borough
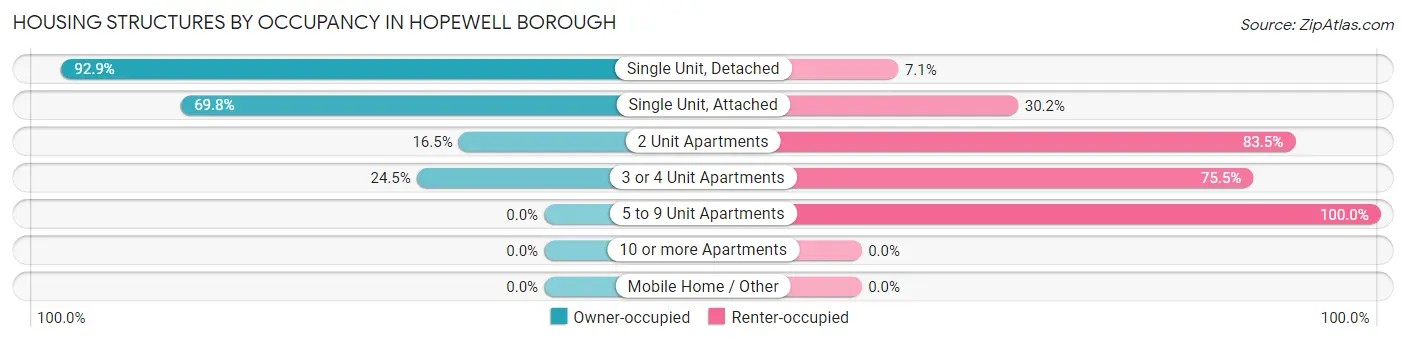
| Structure Type | Owner-occupied | Renter-occupied |
| Single Unit, Detached | 511 (92.9%) | 39 (7.1%) |
| Single Unit, Attached | 44 (69.8%) | 19 (30.2%) |
| 2 Unit Apartments | 13 (16.5%) | 66 (83.5%) |
| 3 or 4 Unit Apartments | 13 (24.5%) | 40 (75.5%) |
| 5 to 9 Unit Apartments | 0 (0.0%) | 10 (100.0%) |
| 10 or more Apartments | 0 (0.0%) | 0 (0.0%) |
| Mobile Home / Other | 0 (0.0%) | 0 (0.0%) |
| Total | 581 (76.9%) | 174 (23.1%) |
Housing Structures by Number of Rooms in Hopewell borough
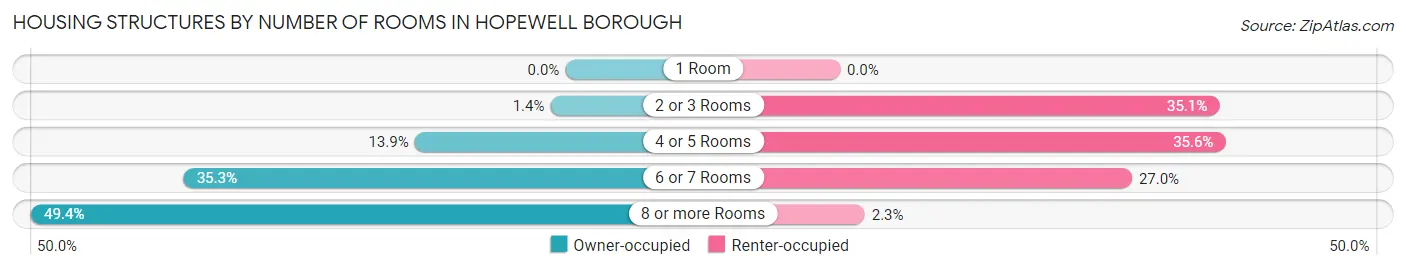
| Number of Rooms | Owner-occupied | Renter-occupied |
| 1 Room | 0 (0.0%) | 0 (0.0%) |
| 2 or 3 Rooms | 8 (1.4%) | 61 (35.1%) |
| 4 or 5 Rooms | 81 (13.9%) | 62 (35.6%) |
| 6 or 7 Rooms | 205 (35.3%) | 47 (27.0%) |
| 8 or more Rooms | 287 (49.4%) | 4 (2.3%) |
| Total | 581 (100.0%) | 174 (100.0%) |
Housing Structure by Heating Type in Hopewell borough
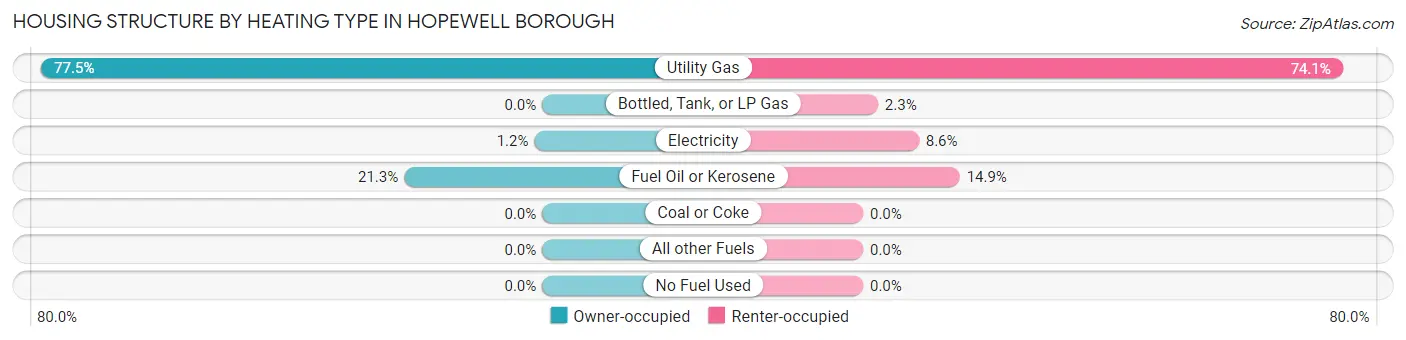
| Heating Type | Owner-occupied | Renter-occupied |
| Utility Gas | 450 (77.4%) | 129 (74.1%) |
| Bottled, Tank, or LP Gas | 0 (0.0%) | 4 (2.3%) |
| Electricity | 7 (1.2%) | 15 (8.6%) |
| Fuel Oil or Kerosene | 124 (21.3%) | 26 (14.9%) |
| Coal or Coke | 0 (0.0%) | 0 (0.0%) |
| All other Fuels | 0 (0.0%) | 0 (0.0%) |
| No Fuel Used | 0 (0.0%) | 0 (0.0%) |
| Total | 581 (100.0%) | 174 (100.0%) |
Household Vehicle Usage in Hopewell borough
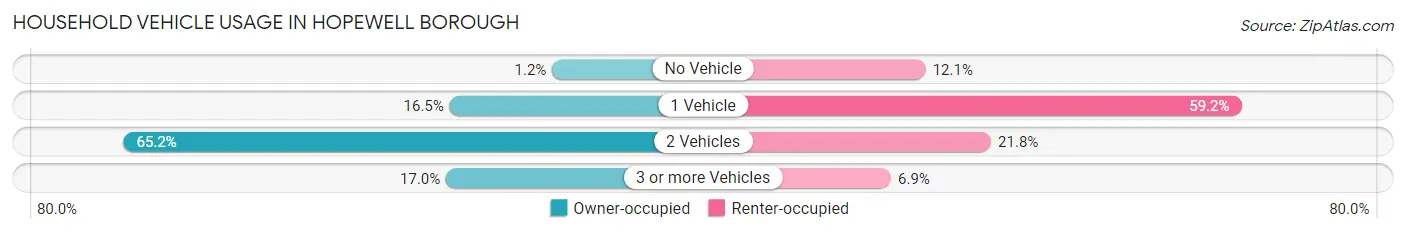
| Vehicles per Household | Owner-occupied | Renter-occupied |
| No Vehicle | 7 (1.2%) | 21 (12.1%) |
| 1 Vehicle | 96 (16.5%) | 103 (59.2%) |
| 2 Vehicles | 379 (65.2%) | 38 (21.8%) |
| 3 or more Vehicles | 99 (17.0%) | 12 (6.9%) |
| Total | 581 (100.0%) | 174 (100.0%) |
Real Estate & Mortgages in Hopewell borough
Real Estate and Mortgage Overview in Hopewell borough
| Characteristic | Without Mortgage | With Mortgage |
| Housing Units | 202 | 379 |
| Median Property Value | $531,300 | $499,000 |
| Median Household Income | $150,417 | $216 |
| Monthly Housing Costs | $1,501 | $193 |
| Real Estate Taxes | $10,001 | $3 |
Property Value by Mortgage Status in Hopewell borough
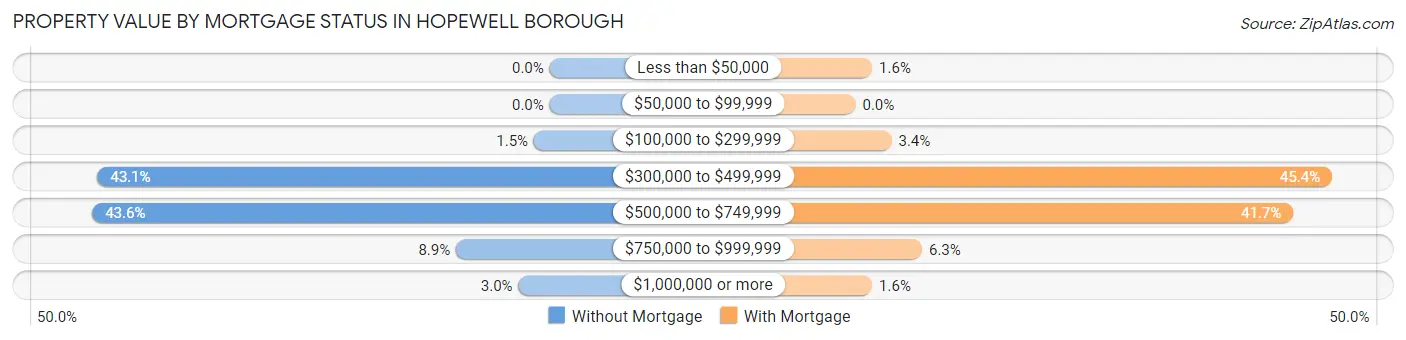
| Property Value | Without Mortgage | With Mortgage |
| Less than $50,000 | 0 (0.0%) | 6 (1.6%) |
| $50,000 to $99,999 | 0 (0.0%) | 0 (0.0%) |
| $100,000 to $299,999 | 3 (1.5%) | 13 (3.4%) |
| $300,000 to $499,999 | 87 (43.1%) | 172 (45.4%) |
| $500,000 to $749,999 | 88 (43.6%) | 158 (41.7%) |
| $750,000 to $999,999 | 18 (8.9%) | 24 (6.3%) |
| $1,000,000 or more | 6 (3.0%) | 6 (1.6%) |
| Total | 202 (100.0%) | 379 (100.0%) |
Household Income by Mortgage Status in Hopewell borough
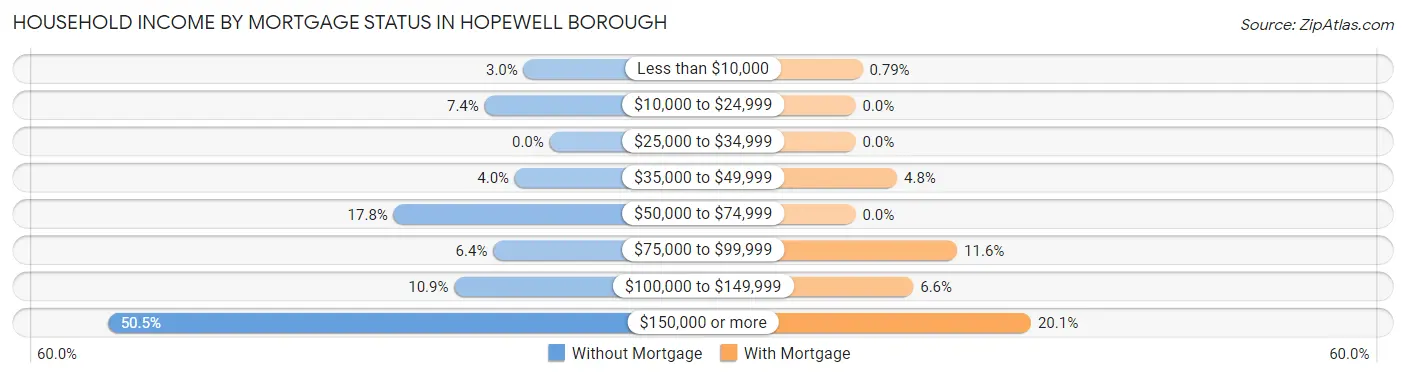
| Household Income | Without Mortgage | With Mortgage |
| Less than $10,000 | 6 (3.0%) | 3 (0.8%) |
| $10,000 to $24,999 | 15 (7.4%) | 0 (0.0%) |
| $25,000 to $34,999 | 0 (0.0%) | 0 (0.0%) |
| $35,000 to $49,999 | 8 (4.0%) | 18 (4.8%) |
| $50,000 to $74,999 | 36 (17.8%) | 0 (0.0%) |
| $75,000 to $99,999 | 13 (6.4%) | 44 (11.6%) |
| $100,000 to $149,999 | 22 (10.9%) | 25 (6.6%) |
| $150,000 or more | 102 (50.5%) | 76 (20.1%) |
| Total | 202 (100.0%) | 379 (100.0%) |
Property Value to Household Income Ratio in Hopewell borough
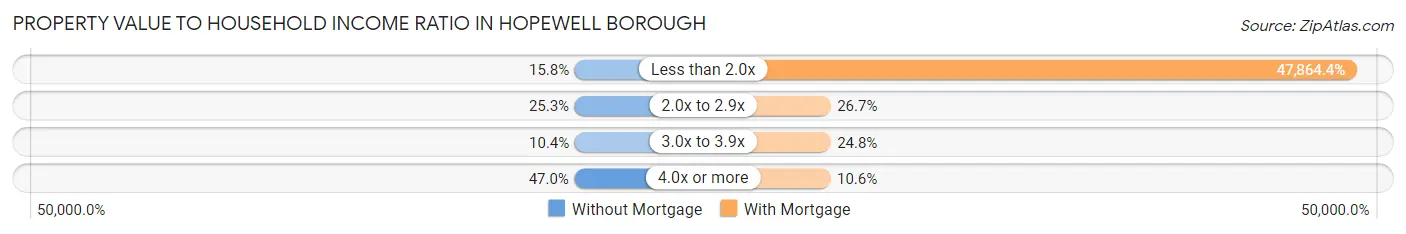
| Value-to-Income Ratio | Without Mortgage | With Mortgage |
| Less than 2.0x | 32 (15.8%) | 181,406 (47,864.4%) |
| 2.0x to 2.9x | 51 (25.3%) | 101 (26.7%) |
| 3.0x to 3.9x | 21 (10.4%) | 94 (24.8%) |
| 4.0x or more | 95 (47.0%) | 40 (10.5%) |
| Total | 202 (100.0%) | 379 (100.0%) |
Real Estate Taxes by Mortgage Status in Hopewell borough
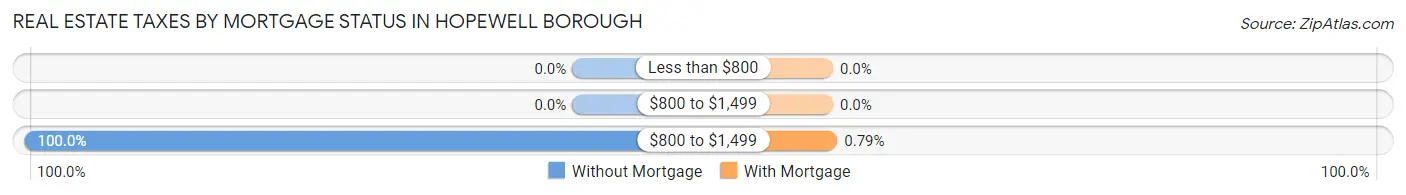
| Property Taxes | Without Mortgage | With Mortgage |
| Less than $800 | 0 (0.0%) | 0 (0.0%) |
| $800 to $1,499 | 0 (0.0%) | 0 (0.0%) |
| $800 to $1,499 | 202 (100.0%) | 3 (0.8%) |
| Total | 202 (100.0%) | 379 (100.0%) |
Health & Disability in Hopewell borough
Health Insurance Coverage by Age in Hopewell borough
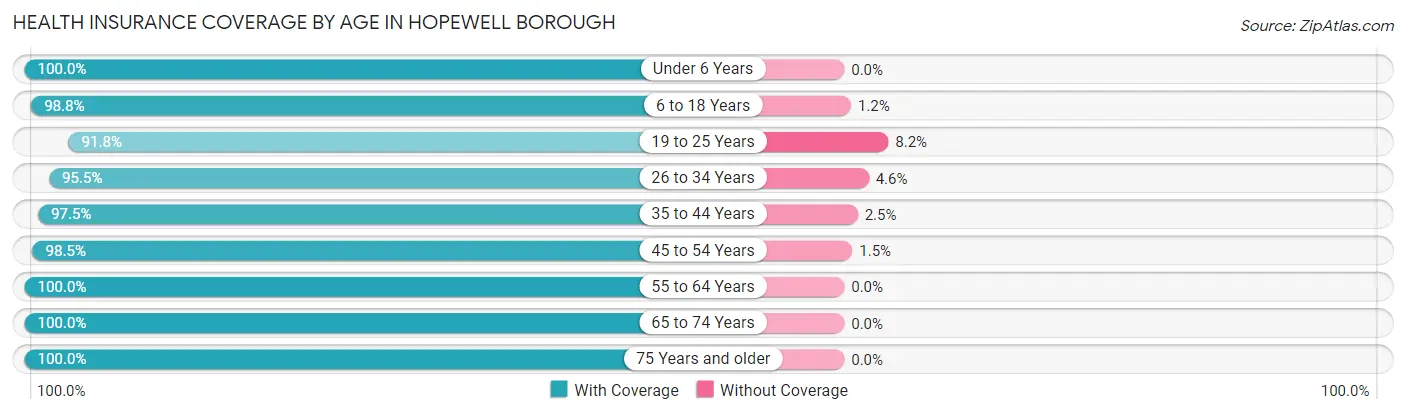
| Age Bracket | With Coverage | Without Coverage |
| Under 6 Years | 176 (100.0%) | 0 (0.0%) |
| 6 to 18 Years | 319 (98.8%) | 4 (1.2%) |
| 19 to 25 Years | 67 (91.8%) | 6 (8.2%) |
| 26 to 34 Years | 84 (95.5%) | 4 (4.5%) |
| 35 to 44 Years | 234 (97.5%) | 6 (2.5%) |
| 45 to 54 Years | 328 (98.5%) | 5 (1.5%) |
| 55 to 64 Years | 311 (100.0%) | 0 (0.0%) |
| 65 to 74 Years | 157 (100.0%) | 0 (0.0%) |
| 75 Years and older | 124 (100.0%) | 0 (0.0%) |
| Total | 1,800 (98.6%) | 25 (1.4%) |
Health Insurance Coverage by Citizenship Status in Hopewell borough
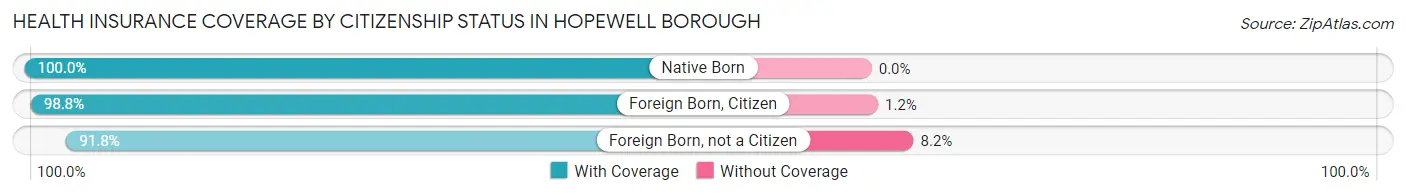
| Citizenship Status | With Coverage | Without Coverage |
| Native Born | 176 (100.0%) | 0 (0.0%) |
| Foreign Born, Citizen | 319 (98.8%) | 4 (1.2%) |
| Foreign Born, not a Citizen | 67 (91.8%) | 6 (8.2%) |
Health Insurance Coverage by Household Income in Hopewell borough
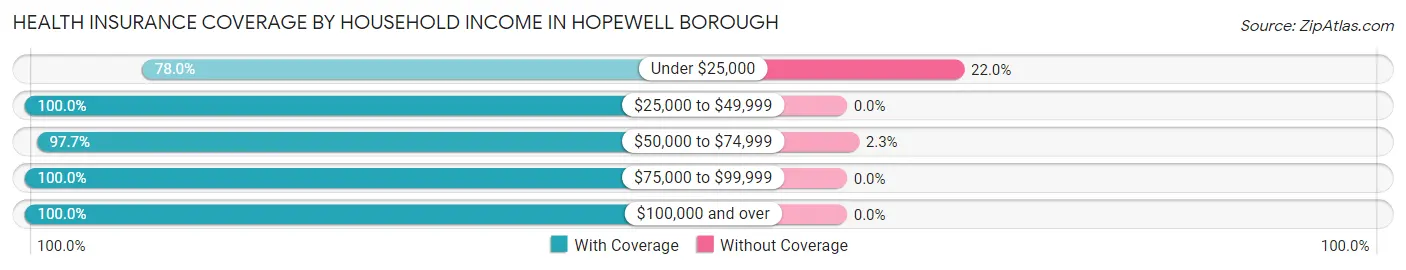
| Household Income | With Coverage | Without Coverage |
| Under $25,000 | 71 (78.0%) | 20 (22.0%) |
| $25,000 to $49,999 | 61 (100.0%) | 0 (0.0%) |
| $50,000 to $74,999 | 216 (97.7%) | 5 (2.3%) |
| $75,000 to $99,999 | 135 (100.0%) | 0 (0.0%) |
| $100,000 and over | 1,317 (100.0%) | 0 (0.0%) |
Public vs Private Health Insurance Coverage by Age in Hopewell borough
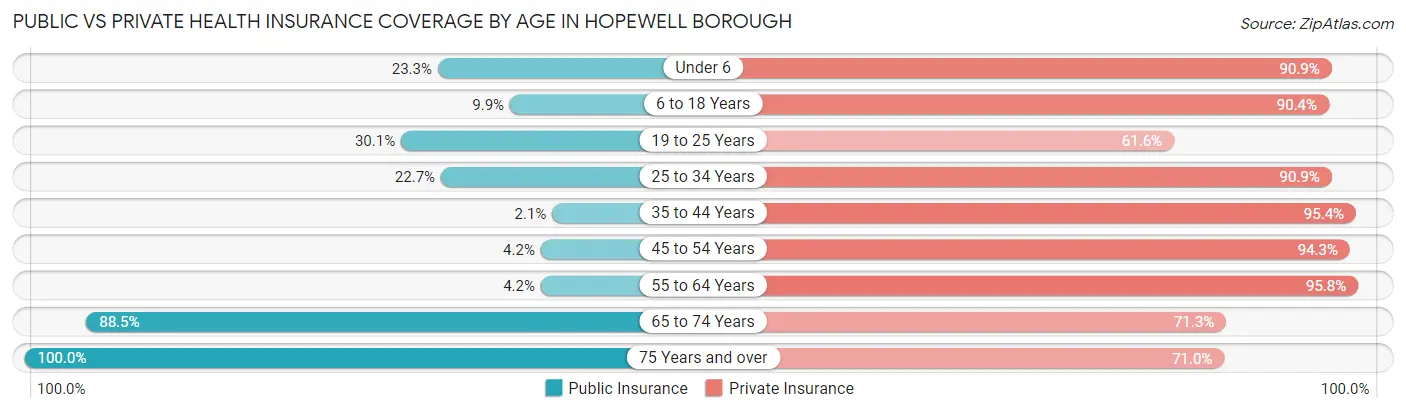
| Age Bracket | Public Insurance | Private Insurance |
| Under 6 | 41 (23.3%) | 160 (90.9%) |
| 6 to 18 Years | 32 (9.9%) | 292 (90.4%) |
| 19 to 25 Years | 22 (30.1%) | 45 (61.6%) |
| 25 to 34 Years | 20 (22.7%) | 80 (90.9%) |
| 35 to 44 Years | 5 (2.1%) | 229 (95.4%) |
| 45 to 54 Years | 14 (4.2%) | 314 (94.3%) |
| 55 to 64 Years | 13 (4.2%) | 298 (95.8%) |
| 65 to 74 Years | 139 (88.5%) | 112 (71.3%) |
| 75 Years and over | 124 (100.0%) | 88 (71.0%) |
| Total | 410 (22.5%) | 1,618 (88.7%) |
Disability Status by Sex by Age in Hopewell borough
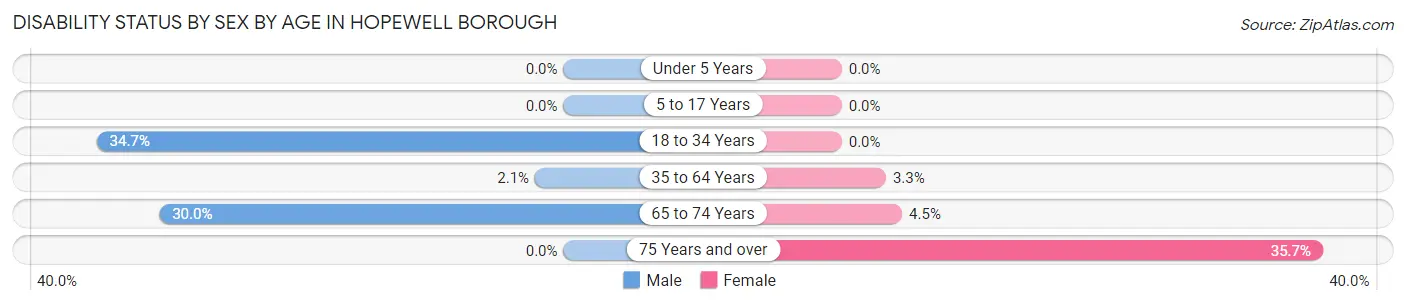
| Age Bracket | Male | Female |
| Under 5 Years | 0 (0.0%) | 0 (0.0%) |
| 5 to 17 Years | 0 (0.0%) | 0 (0.0%) |
| 18 to 34 Years | 35 (34.6%) | 0 (0.0%) |
| 35 to 64 Years | 9 (2.1%) | 15 (3.3%) |
| 65 to 74 Years | 27 (30.0%) | 3 (4.5%) |
| 75 Years and over | 0 (0.0%) | 25 (35.7%) |
Disability Class by Sex by Age in Hopewell borough
Disability Class: Hearing Difficulty
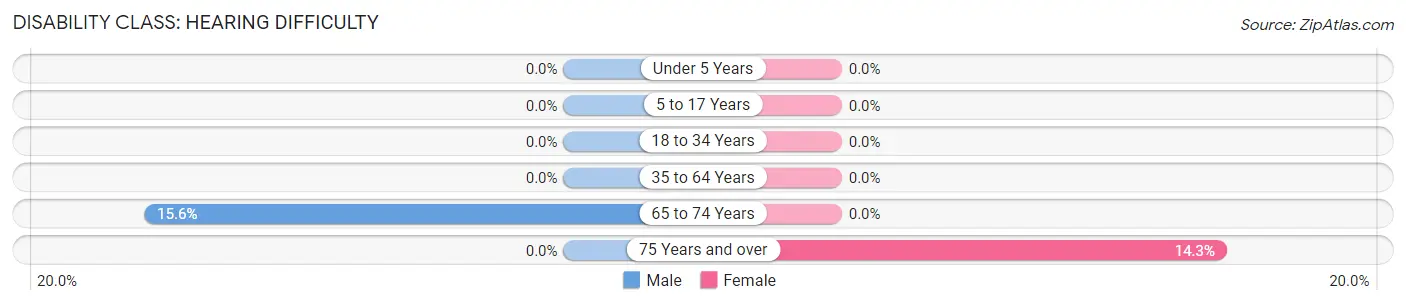
| Age Bracket | Male | Female |
| Under 5 Years | 0 (0.0%) | 0 (0.0%) |
| 5 to 17 Years | 0 (0.0%) | 0 (0.0%) |
| 18 to 34 Years | 0 (0.0%) | 0 (0.0%) |
| 35 to 64 Years | 0 (0.0%) | 0 (0.0%) |
| 65 to 74 Years | 14 (15.6%) | 0 (0.0%) |
| 75 Years and over | 0 (0.0%) | 10 (14.3%) |
Disability Class: Vision Difficulty
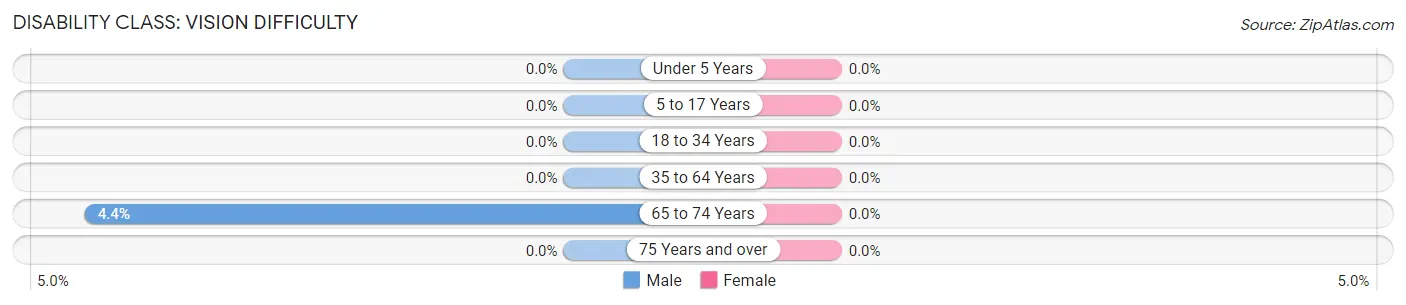
| Age Bracket | Male | Female |
| Under 5 Years | 0 (0.0%) | 0 (0.0%) |
| 5 to 17 Years | 0 (0.0%) | 0 (0.0%) |
| 18 to 34 Years | 0 (0.0%) | 0 (0.0%) |
| 35 to 64 Years | 0 (0.0%) | 0 (0.0%) |
| 65 to 74 Years | 4 (4.4%) | 0 (0.0%) |
| 75 Years and over | 0 (0.0%) | 0 (0.0%) |
Disability Class: Cognitive Difficulty
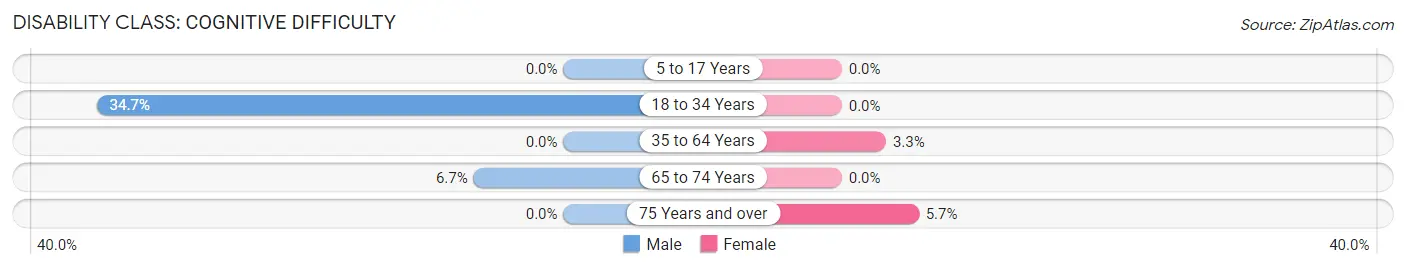
| Age Bracket | Male | Female |
| 5 to 17 Years | 0 (0.0%) | 0 (0.0%) |
| 18 to 34 Years | 35 (34.6%) | 0 (0.0%) |
| 35 to 64 Years | 0 (0.0%) | 15 (3.3%) |
| 65 to 74 Years | 6 (6.7%) | 0 (0.0%) |
| 75 Years and over | 0 (0.0%) | 4 (5.7%) |
Disability Class: Ambulatory Difficulty
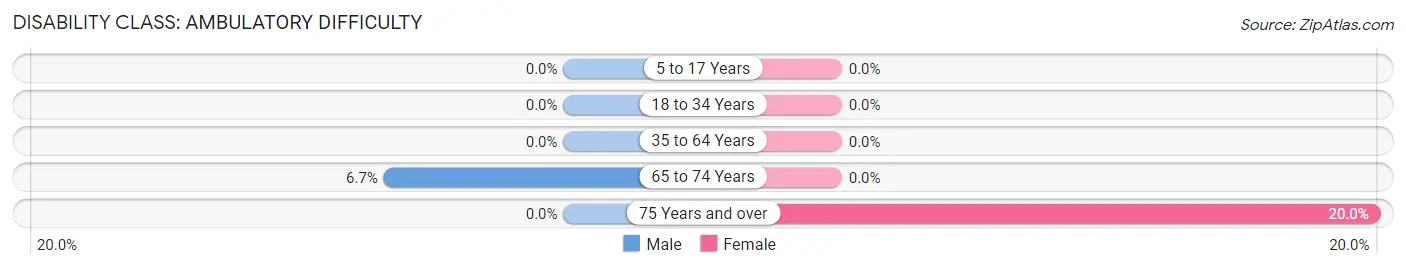
| Age Bracket | Male | Female |
| 5 to 17 Years | 0 (0.0%) | 0 (0.0%) |
| 18 to 34 Years | 0 (0.0%) | 0 (0.0%) |
| 35 to 64 Years | 0 (0.0%) | 0 (0.0%) |
| 65 to 74 Years | 6 (6.7%) | 0 (0.0%) |
| 75 Years and over | 0 (0.0%) | 14 (20.0%) |
Disability Class: Self-Care Difficulty
| Age Bracket | Male | Female |
| 5 to 17 Years | 0 (0.0%) | 0 (0.0%) |
| 18 to 34 Years | 0 (0.0%) | 0 (0.0%) |
| 35 to 64 Years | 0 (0.0%) | 0 (0.0%) |
| 65 to 74 Years | 0 (0.0%) | 0 (0.0%) |
| 75 Years and over | 0 (0.0%) | 0 (0.0%) |
Technology Access in Hopewell borough
Computing Device Access in Hopewell borough
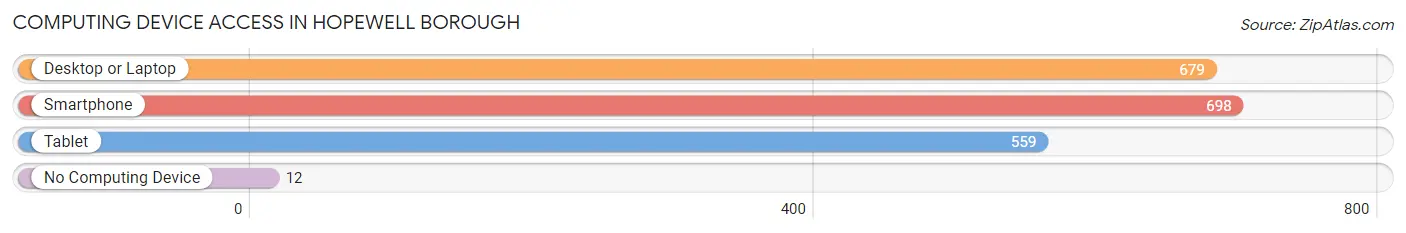
| Device Type | # Households | % Households |
| Desktop or Laptop | 679 | 89.9% |
| Smartphone | 698 | 92.4% |
| Tablet | 559 | 74.0% |
| No Computing Device | 12 | 1.6% |
| Total | 755 | 100.0% |
Internet Access in Hopewell borough
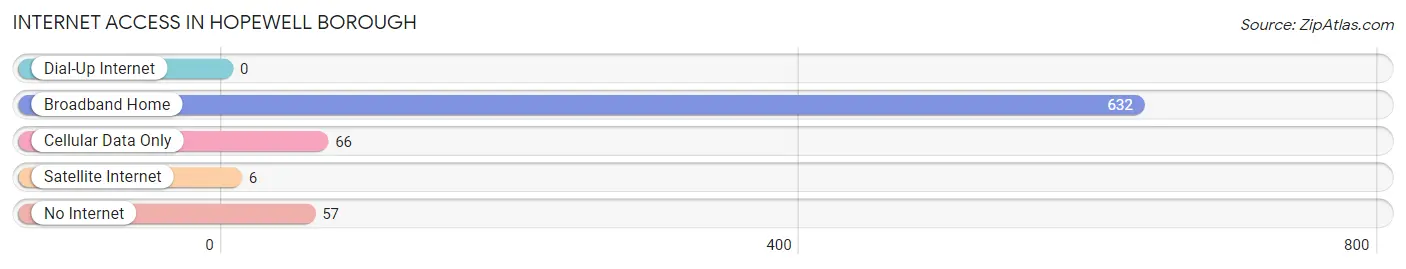
| Internet Type | # Households | % Households |
| Dial-Up Internet | 0 | 0.0% |
| Broadband Home | 632 | 83.7% |
| Cellular Data Only | 66 | 8.7% |
| Satellite Internet | 6 | 0.8% |
| No Internet | 57 | 7.5% |
| Total | 755 | 100.0% |
Hopewell borough Summary
HopeWell Borough is a small borough located in Mercer County, New Jersey. It is situated on the banks of the Delaware River, just south of Trenton. The borough was incorporated in 1891 and is home to a population of 2,722 people as of the 2010 census.
History
The area that is now HopeWell Borough was originally inhabited by the Lenni Lenape Native Americans. The first European settlers arrived in the area in the late 17th century. The area was originally part of Hopewell Township, which was established in 1715. In 1891, the area was incorporated as a borough and named after the township.
The borough was an important center of industry in the 19th century. It was home to several mills, including a paper mill, a grist mill, and a saw mill. The borough was also home to a number of quarries, which provided stone for the construction of many of the buildings in the area.
Geography
HopeWell Borough is located in Mercer County, New Jersey. It is situated on the banks of the Delaware River, just south of Trenton. The borough covers an area of 1.2 square miles and is bordered by Hopewell Township to the north, Lawrence Township to the east, and Ewing Township to the south and west.
The borough is located in the humid subtropical climate zone, with hot, humid summers and cold, wet winters. The average annual temperature is around 54°F, with an average high of around 78°F in the summer and an average low of around 32°F in the winter.
Economy
HopeWell Borough is primarily a residential community, with most of its residents employed in the nearby cities of Trenton and Princeton. The borough is home to a number of small businesses, including restaurants, retail stores, and professional services.
The borough is also home to a number of industrial and manufacturing businesses. The largest employer in the borough is the Hopewell Valley Regional School District, which employs over 1,000 people.
Demographics
As of the 2010 census, HopeWell Borough had a population of 2,722 people. The racial makeup of the borough was 87.3% White, 8.2% African American, 0.7% Asian, 0.3% Native American, and 3.5% from other races. Hispanic or Latino of any race were 5.2% of the population.
The median household income in the borough was $76,944, and the median family income was $90,917. The per capita income was $35,945. About 4.3% of families and 5.7% of the population were below the poverty line.
Conclusion
HopeWell Borough is a small borough located in Mercer County, New Jersey. It is situated on the banks of the Delaware River, just south of Trenton. The borough was incorporated in 1891 and is home to a population of 2,722 people as of the 2010 census. The borough is primarily a residential community, with most of its residents employed in the nearby cities of Trenton and Princeton. The borough is also home to a number of industrial and manufacturing businesses. The racial makeup of the borough was 87.3% White, 8.2% African American, 0.7% Asian, 0.3% Native American, and 3.5% from other races. The median household income in the borough was $76,944, and the median family income was $90,917. HopeWell Borough is a diverse and vibrant community that offers its residents a unique blend of history, geography, economy, and demographics.
Common Questions
What is Per Capita Income in Hopewell borough?
Per Capita income in Hopewell borough is $73,207.
What is the Median Family Income in Hopewell borough?
Median Family Income in Hopewell borough is $168,333.
What is the Median Household income in Hopewell borough?
Median Household Income in Hopewell borough is $137,138.
What is Income or Wage Gap in Hopewell borough?
Income or Wage Gap in Hopewell borough is 31.4%.
Women in Hopewell borough earn 68.6 cents for every dollar earned by a man.
What is Inequality or Gini Index in Hopewell borough?
Inequality or Gini Index in Hopewell borough is 0.45.
What is the Total Population of Hopewell borough?
Total Population of Hopewell borough is 1,825.
What is the Total Male Population of Hopewell borough?
Total Male Population of Hopewell borough is 932.
What is the Total Female Population of Hopewell borough?
Total Female Population of Hopewell borough is 893.
What is the Ratio of Males per 100 Females in Hopewell borough?
There are 104.37 Males per 100 Females in Hopewell borough.
What is the Ratio of Females per 100 Males in Hopewell borough?
There are 95.82 Females per 100 Males in Hopewell borough.
What is the Median Population Age in Hopewell borough?
Median Population Age in Hopewell borough is 45.3 Years.
What is the Average Family Size in Hopewell borough
Average Family Size in Hopewell borough is 3.0 People.
What is the Average Household Size in Hopewell borough
Average Household Size in Hopewell borough is 2.4 People.
How Large is the Labor Force in Hopewell borough?
There are 1,019 People in the Labor Forcein in Hopewell borough.
What is the Percentage of People in the Labor Force in Hopewell borough?
74.3% of People are in the Labor Force in Hopewell borough.
What is the Unemployment Rate in Hopewell borough?
Unemployment Rate in Hopewell borough is 1.9%.