Zip Codes with the Highest Percentage of Population with a Degree in Visual and Performing Arts in Plainfield, NJ
RELATED REPORTS & OPTIONS
Visual and Performing Arts
Plainfield
Compare Zip Codes
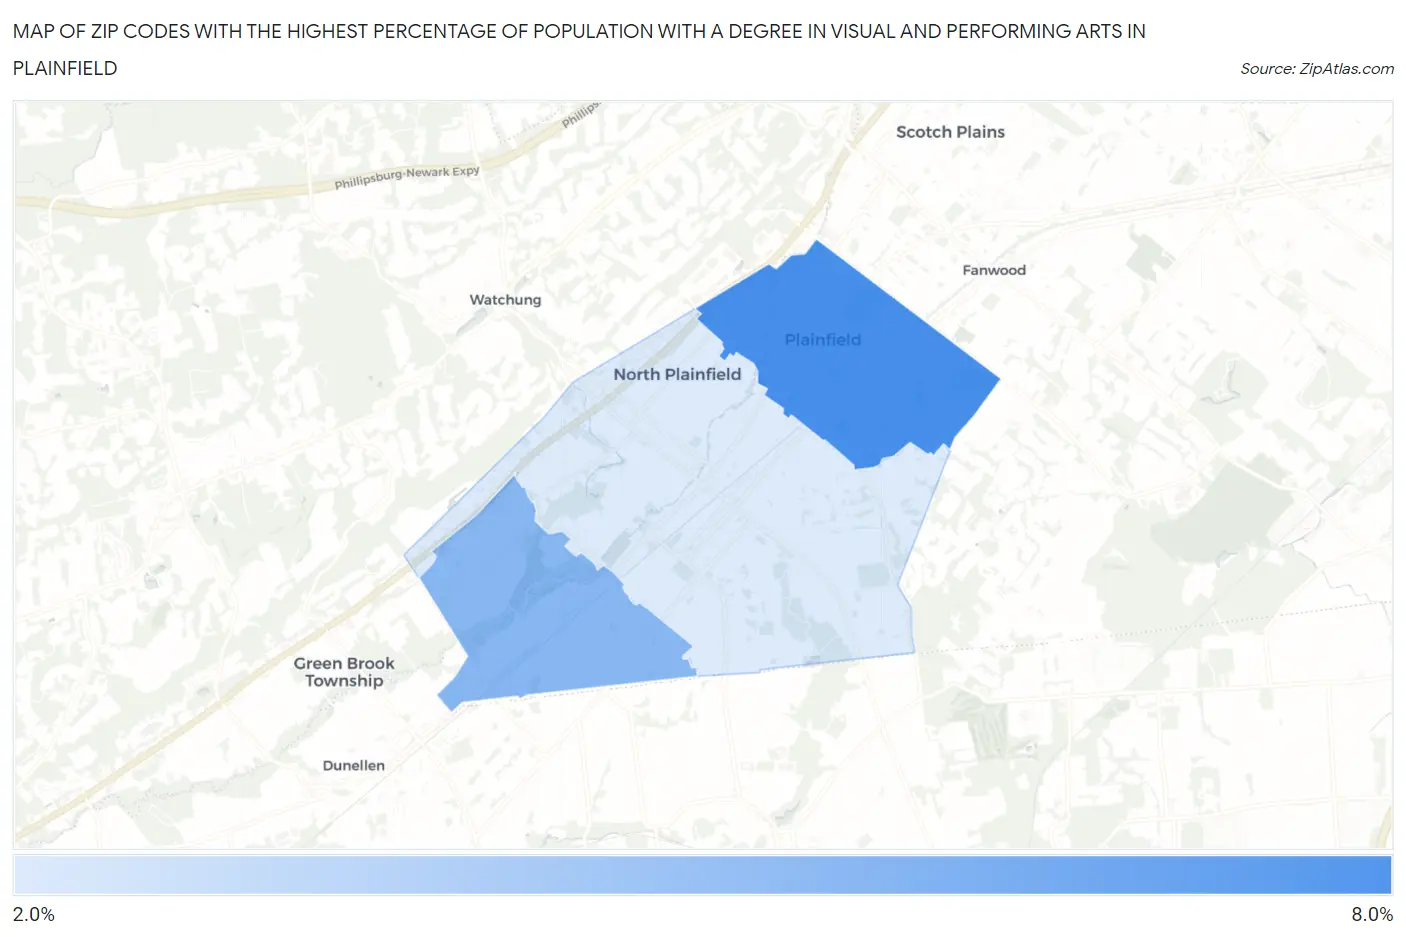
Map of Zip Codes with the Highest Percentage of Population with a Degree in Visual and Performing Arts in Plainfield
2.5%
6.1%
Zip Codes with the Highest Percentage of Population with a Degree in Visual and Performing Arts in Plainfield, NJ
| Zip Code | % Graduates | vs State | vs National | |
| 1. | 07062 | 6.1% | 4.0%(+2.07)#91 | 4.3%(+1.87)#4,716 |
| 2. | 07063 | 4.5% | 4.0%(+0.460)#178 | 4.3%(+0.255)#7,793 |
| 3. | 07060 | 2.5% | 4.0%(-1.59)#410 | 4.3%(-1.79)#14,753 |
1
Common Questions
What are the Top Zip Codes with the Highest Percentage of Population with a Degree in Visual and Performing Arts in Plainfield, NJ?
Top Zip Codes with the Highest Percentage of Population with a Degree in Visual and Performing Arts in Plainfield, NJ are:
What zip code has the Highest Percentage of Population with a Degree in Visual and Performing Arts in Plainfield, NJ?
07062 has the Highest Percentage of Population with a Degree in Visual and Performing Arts in Plainfield, NJ with 6.1%.
What is the Percentage of Population with a Degree in Visual and Performing Arts in Plainfield, NJ?
Percentage of Population with a Degree in Visual and Performing Arts in Plainfield is 3.9%.
What is the Percentage of Population with a Degree in Visual and Performing Arts in New Jersey?
Percentage of Population with a Degree in Visual and Performing Arts in New Jersey is 4.0%.
What is the Percentage of Population with a Degree in Visual and Performing Arts in the United States?
Percentage of Population with a Degree in Visual and Performing Arts in the United States is 4.3%.