Zip Codes with the Highest Percentage of Population with a Degree in Visual and Performing Arts in Princeton, NJ
RELATED REPORTS & OPTIONS
Visual and Performing Arts
Princeton
Compare Zip Codes
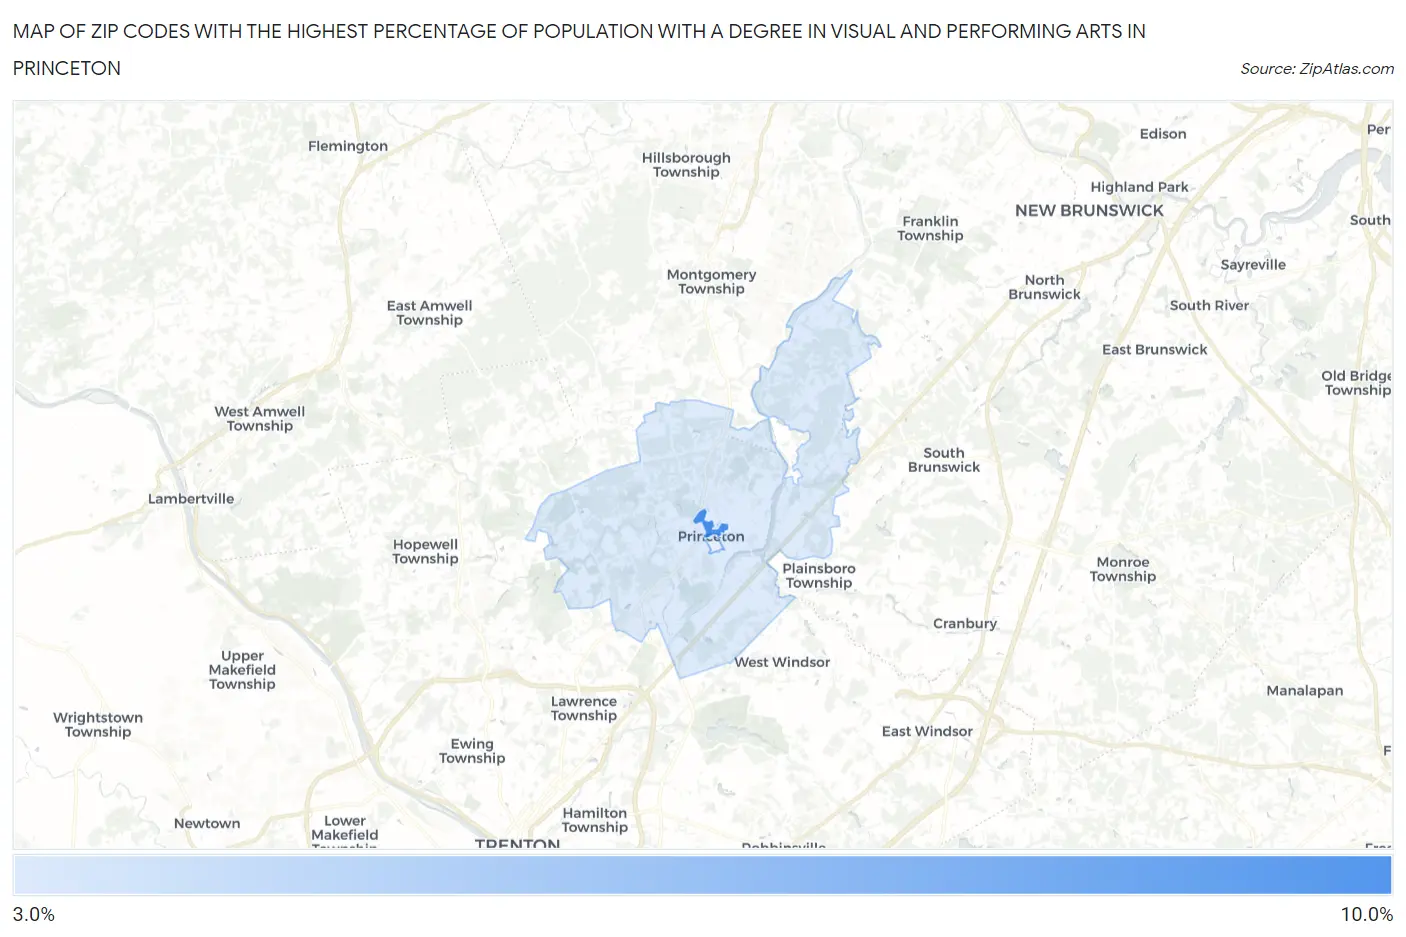
Map of Zip Codes with the Highest Percentage of Population with a Degree in Visual and Performing Arts in Princeton
3.8%
8.3%
Zip Codes with the Highest Percentage of Population with a Degree in Visual and Performing Arts in Princeton, NJ
| Zip Code | % Graduates | vs State | vs National | |
| 1. | 08542 | 8.3% | 4.0%(+4.22)#34 | 4.3%(+4.02)#2,677 |
| 2. | 08540 | 3.8% | 4.0%(-0.239)#239 | 4.3%(-0.443)#9,833 |
1
Common Questions
What are the Top Zip Codes with the Highest Percentage of Population with a Degree in Visual and Performing Arts in Princeton, NJ?
Top Zip Codes with the Highest Percentage of Population with a Degree in Visual and Performing Arts in Princeton, NJ are:
What zip code has the Highest Percentage of Population with a Degree in Visual and Performing Arts in Princeton, NJ?
08542 has the Highest Percentage of Population with a Degree in Visual and Performing Arts in Princeton, NJ with 8.3%.
What is the Percentage of Population with a Degree in Visual and Performing Arts in Princeton, NJ?
Percentage of Population with a Degree in Visual and Performing Arts in Princeton is 5.0%.
What is the Percentage of Population with a Degree in Visual and Performing Arts in New Jersey?
Percentage of Population with a Degree in Visual and Performing Arts in New Jersey is 4.0%.
What is the Percentage of Population with a Degree in Visual and Performing Arts in the United States?
Percentage of Population with a Degree in Visual and Performing Arts in the United States is 4.3%.