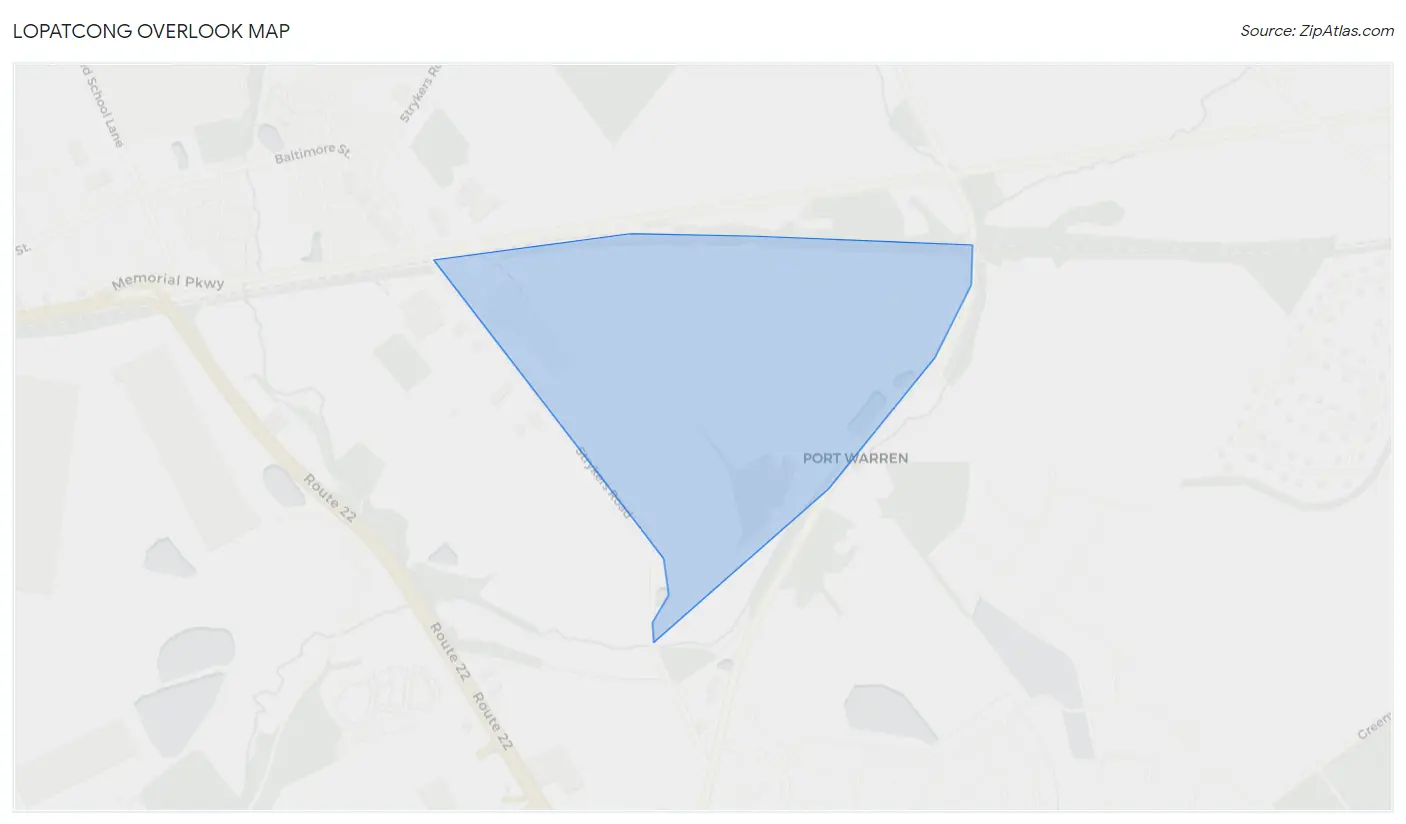
Lopatcong Overlook, NJ Map & Demographics
Lopatcong Overlook Map
Lopatcong Overlook Overview
$40,871
PER CAPITA INCOME
$84,609
AVG FAMILY INCOME
$83,242
AVG HOUSEHOLD INCOME
38.0%
WAGE / INCOME GAP [ % ]
62.0¢/ $1
WAGE / INCOME GAP [ $ ]
0.29
INEQUALITY / GINI INDEX
718
TOTAL POPULATION
351
MALE POPULATION
367
FEMALE POPULATION
95.64
MALES / 100 FEMALES
104.56
FEMALES / 100 MALES
42.7
MEDIAN AGE
2.8
AVG FAMILY SIZE
2.4
AVG HOUSEHOLD SIZE
423
LABOR FORCE [ PEOPLE ]
74.6%
PERCENT IN LABOR FORCE
Income in Lopatcong Overlook
Income Overview in Lopatcong Overlook
Per Capita Income in Lopatcong Overlook is $40,871, while median incomes of families and households are $84,609 and $83,242 respectively.
| Characteristic | Number | Measure |
| Per Capita Income | 718 | $40,871 |
| Median Family Income | 222 | $84,609 |
| Mean Family Income | 222 | $106,394 |
| Median Household Income | 301 | $83,242 |
| Mean Household Income | 301 | $91,747 |
| Income Deficit | 222 | $0 |
| Wage / Income Gap (%) | 718 | 38.05% |
| Wage / Income Gap ($) | 718 | 61.95¢ per $1 |
| Gini / Inequality Index | 718 | 0.29 |
Earnings by Sex in Lopatcong Overlook
Average Earnings in Lopatcong Overlook are $47,401, $46,579 for men and $75,183 for women, a difference of 38.1%.
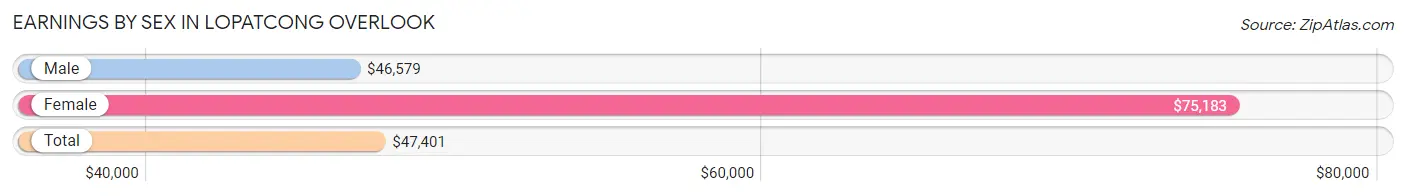
| Sex | Number | Average Earnings |
| Male | 224 (48.5%) | $46,579 |
| Female | 238 (51.5%) | $75,183 |
| Total | 462 (100.0%) | $47,401 |
Earnings by Sex by Income Bracket in Lopatcong Overlook
The most common earnings brackets in Lopatcong Overlook are $45,000 to $49,999 for men (76 | 33.9%) and $75,000 to $99,999 for women (73 | 30.7%).
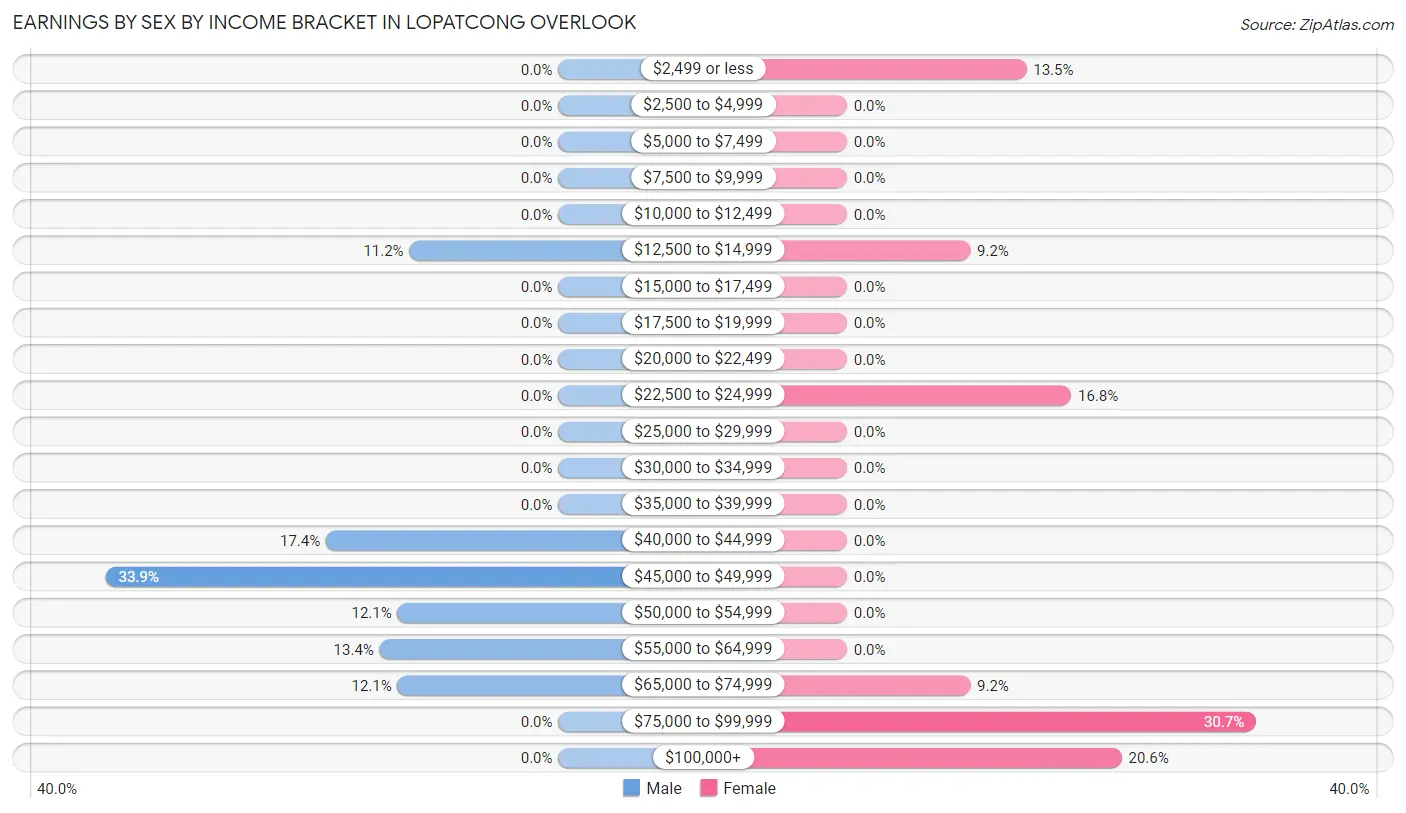
| Income | Male | Female |
| $2,499 or less | 0 (0.0%) | 32 (13.5%) |
| $2,500 to $4,999 | 0 (0.0%) | 0 (0.0%) |
| $5,000 to $7,499 | 0 (0.0%) | 0 (0.0%) |
| $7,500 to $9,999 | 0 (0.0%) | 0 (0.0%) |
| $10,000 to $12,499 | 0 (0.0%) | 0 (0.0%) |
| $12,500 to $14,999 | 25 (11.2%) | 22 (9.2%) |
| $15,000 to $17,499 | 0 (0.0%) | 0 (0.0%) |
| $17,500 to $19,999 | 0 (0.0%) | 0 (0.0%) |
| $20,000 to $22,499 | 0 (0.0%) | 0 (0.0%) |
| $22,500 to $24,999 | 0 (0.0%) | 40 (16.8%) |
| $25,000 to $29,999 | 0 (0.0%) | 0 (0.0%) |
| $30,000 to $34,999 | 0 (0.0%) | 0 (0.0%) |
| $35,000 to $39,999 | 0 (0.0%) | 0 (0.0%) |
| $40,000 to $44,999 | 39 (17.4%) | 0 (0.0%) |
| $45,000 to $49,999 | 76 (33.9%) | 0 (0.0%) |
| $50,000 to $54,999 | 27 (12.0%) | 0 (0.0%) |
| $55,000 to $64,999 | 30 (13.4%) | 0 (0.0%) |
| $65,000 to $74,999 | 27 (12.0%) | 22 (9.2%) |
| $75,000 to $99,999 | 0 (0.0%) | 73 (30.7%) |
| $100,000+ | 0 (0.0%) | 49 (20.6%) |
| Total | 224 (100.0%) | 238 (100.0%) |
Earnings by Sex by Educational Attainment in Lopatcong Overlook
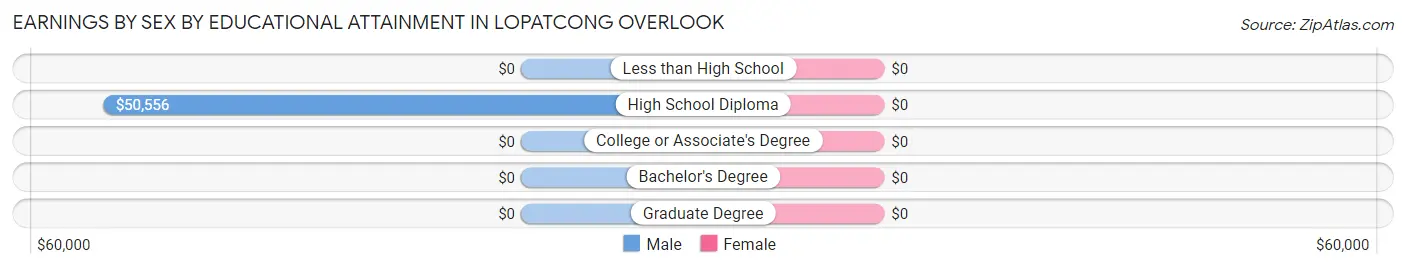
| Educational Attainment | Male Income | Female Income |
| Less than High School | - | - |
| High School Diploma | $50,556 | $0 |
| College or Associate's Degree | - | - |
| Bachelor's Degree | - | - |
| Graduate Degree | - | - |
| Total | $50,370 | $75,183 |
Family Income in Lopatcong Overlook
Family Income Brackets in Lopatcong Overlook
According to the Lopatcong Overlook family income data, there are 84 families falling into the $50,000 to $74,999 income range, which is the most common income bracket and makes up 37.8% of all families.
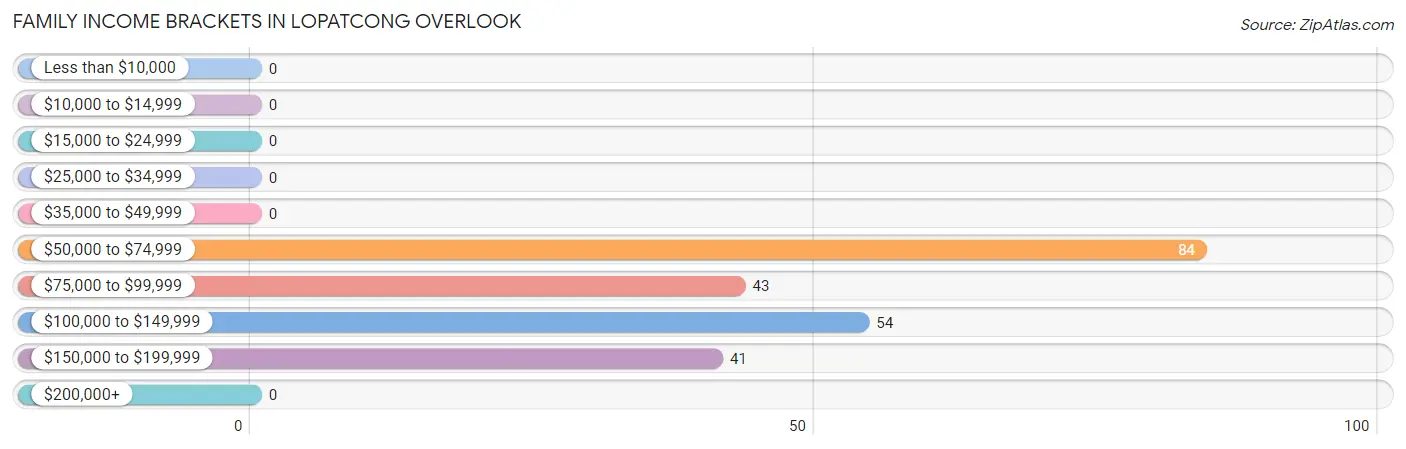
| Income Bracket | # Families | % Families |
| Less than $10,000 | 0 | 0.0% |
| $10,000 to $14,999 | 0 | 0.0% |
| $15,000 to $24,999 | 0 | 0.0% |
| $25,000 to $34,999 | 0 | 0.0% |
| $35,000 to $49,999 | 0 | 0.0% |
| $50,000 to $74,999 | 84 | 37.8% |
| $75,000 to $99,999 | 43 | 19.4% |
| $100,000 to $149,999 | 54 | 24.3% |
| $150,000 to $199,999 | 41 | 18.5% |
| $200,000+ | 0 | 0.0% |
Family Income by Famaliy Size in Lopatcong Overlook
2-person families (142 | 64.0%) account for the highest median family income in Lopatcong Overlook with $123,333 per family, while 2-person families (142 | 64.0%) have the highest median income of $61,666 per family member.
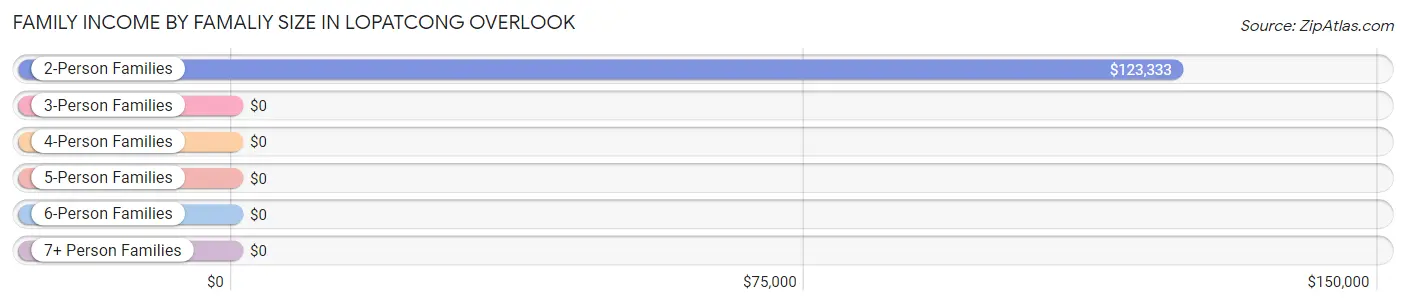
| Income Bracket | # Families | Median Income |
| 2-Person Families | 142 (64.0%) | $123,333 |
| 3-Person Families | 48 (21.6%) | $0 |
| 4-Person Families | 32 (14.4%) | $0 |
| 5-Person Families | 0 (0.0%) | $0 |
| 6-Person Families | 0 (0.0%) | $0 |
| 7+ Person Families | 0 (0.0%) | $0 |
| Total | 222 (100.0%) | $84,609 |
Family Income by Number of Earners in Lopatcong Overlook
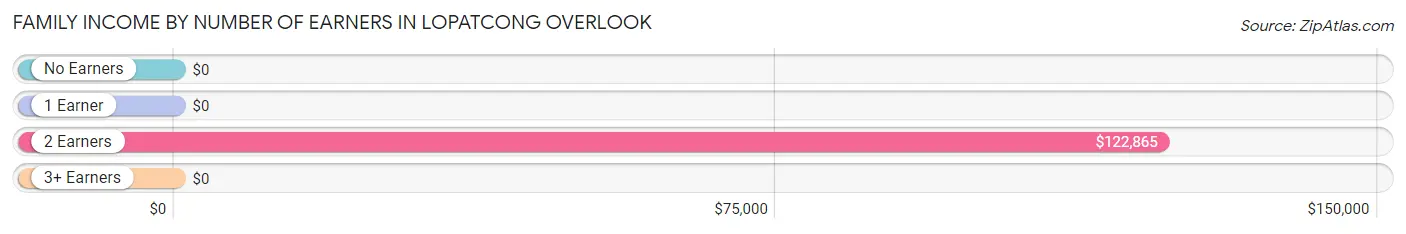
| Number of Earners | # Families | Median Income |
| No Earners | 23 (10.4%) | $0 |
| 1 Earner | 32 (14.4%) | $0 |
| 2 Earners | 151 (68.0%) | $122,865 |
| 3+ Earners | 16 (7.2%) | $0 |
| Total | 222 (100.0%) | $84,609 |
Household Income in Lopatcong Overlook
Household Income Brackets in Lopatcong Overlook
With 84 households falling in the category, the $50,000 to $74,999 income range is the most frequent in Lopatcong Overlook, accounting for 27.9% of all households.
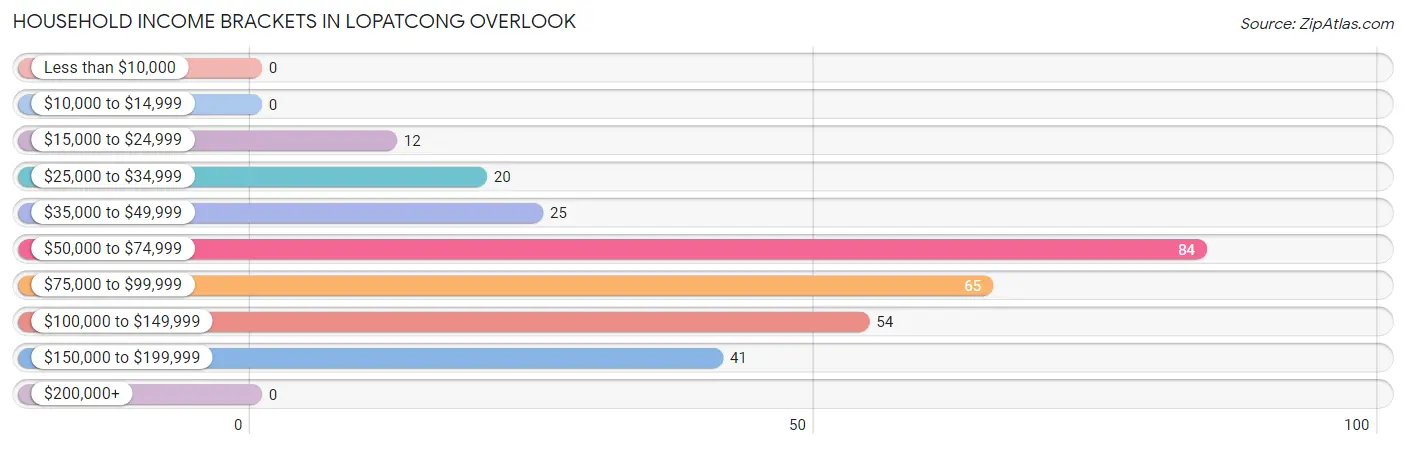
| Income Bracket | # Households | % Households |
| Less than $10,000 | 0 | 0.0% |
| $10,000 to $14,999 | 0 | 0.0% |
| $15,000 to $24,999 | 12 | 4.0% |
| $25,000 to $34,999 | 20 | 6.6% |
| $35,000 to $49,999 | 25 | 8.3% |
| $50,000 to $74,999 | 84 | 27.9% |
| $75,000 to $99,999 | 65 | 21.6% |
| $100,000 to $149,999 | 54 | 17.9% |
| $150,000 to $199,999 | 41 | 13.6% |
| $200,000+ | 0 | 0.0% |
Household Income by Householder Age in Lopatcong Overlook
The median household income in Lopatcong Overlook is $83,242, with the highest median household income of $123,802 found in the 45 to 64 years age bracket for the primary householder. A total of 105 households (34.9%) fall into this category.
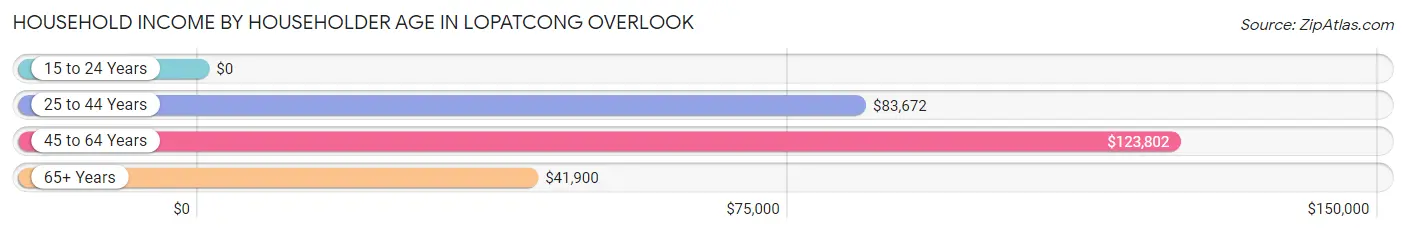
| Income Bracket | # Households | Median Income |
| 15 to 24 Years | 0 (0.0%) | $0 |
| 25 to 44 Years | 94 (31.2%) | $83,672 |
| 45 to 64 Years | 105 (34.9%) | $123,802 |
| 65+ Years | 102 (33.9%) | $41,900 |
| Total | 301 (100.0%) | $83,242 |
Poverty in Lopatcong Overlook
Income Below Poverty by Sex and Age in Lopatcong Overlook
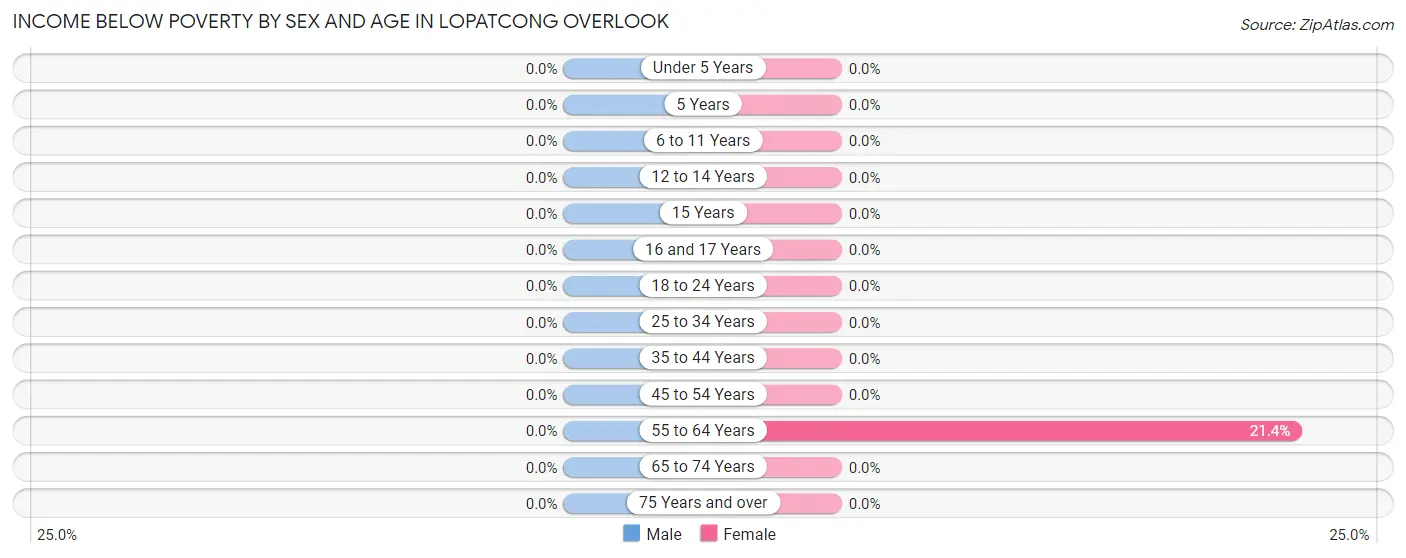
| Age Bracket | Male | Female |
| Under 5 Years | 0 (0.0%) | 0 (0.0%) |
| 5 Years | 0 (0.0%) | 0 (0.0%) |
| 6 to 11 Years | 0 (0.0%) | 0 (0.0%) |
| 12 to 14 Years | 0 (0.0%) | 0 (0.0%) |
| 15 Years | 0 (0.0%) | 0 (0.0%) |
| 16 and 17 Years | 0 (0.0%) | 0 (0.0%) |
| 18 to 24 Years | 0 (0.0%) | 0 (0.0%) |
| 25 to 34 Years | 0 (0.0%) | 0 (0.0%) |
| 35 to 44 Years | 0 (0.0%) | 0 (0.0%) |
| 45 to 54 Years | 0 (0.0%) | 0 (0.0%) |
| 55 to 64 Years | 0 (0.0%) | 22 (21.4%) |
| 65 to 74 Years | 0 (0.0%) | 0 (0.0%) |
| 75 Years and over | 0 (0.0%) | 0 (0.0%) |
| Total | 0 (0.0%) | 22 (6.0%) |
Income Above Poverty by Sex and Age in Lopatcong Overlook
According to the poverty statistics in Lopatcong Overlook, males aged under 5 years and females aged 6 to 11 years are the age groups that are most secure financially, with 100.0% of males and 100.0% of females in these age groups living above the poverty line.
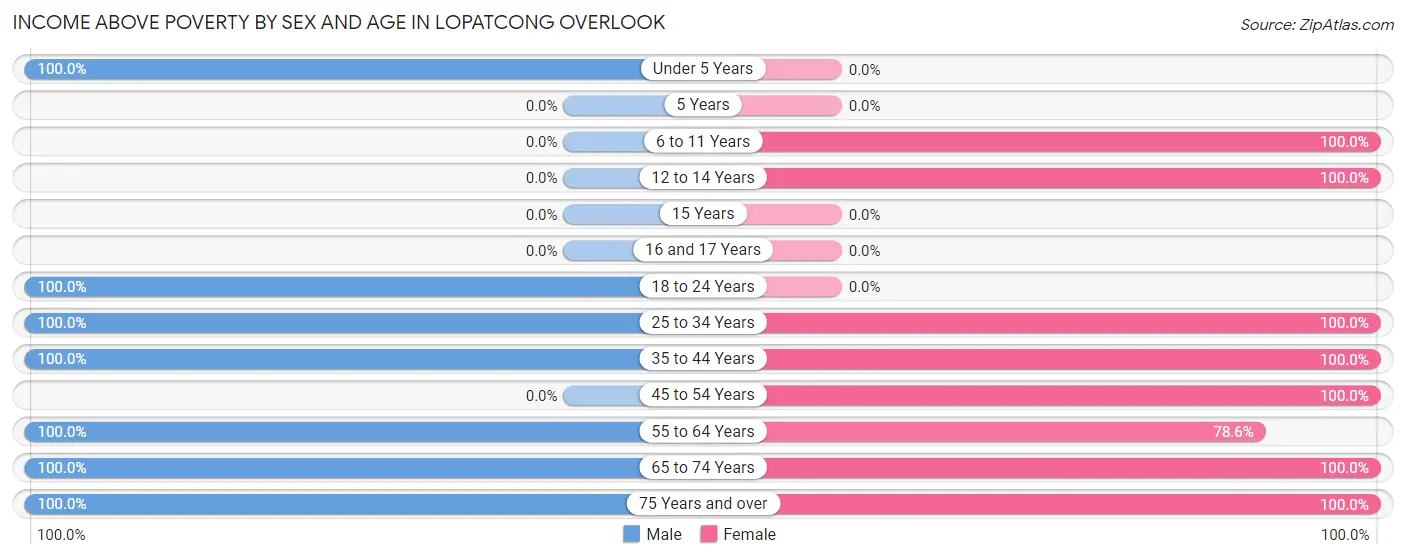
| Age Bracket | Male | Female |
| Under 5 Years | 82 (100.0%) | 0 (0.0%) |
| 5 Years | 0 (0.0%) | 0 (0.0%) |
| 6 to 11 Years | 0 (0.0%) | 35 (100.0%) |
| 12 to 14 Years | 0 (0.0%) | 34 (100.0%) |
| 15 Years | 0 (0.0%) | 0 (0.0%) |
| 16 and 17 Years | 0 (0.0%) | 0 (0.0%) |
| 18 to 24 Years | 64 (100.0%) | 0 (0.0%) |
| 25 to 34 Years | 34 (100.0%) | 32 (100.0%) |
| 35 to 44 Years | 30 (100.0%) | 57 (100.0%) |
| 45 to 54 Years | 0 (0.0%) | 24 (100.0%) |
| 55 to 64 Years | 54 (100.0%) | 81 (78.6%) |
| 65 to 74 Years | 42 (100.0%) | 47 (100.0%) |
| 75 Years and over | 45 (100.0%) | 35 (100.0%) |
| Total | 351 (100.0%) | 345 (94.0%) |
Income Below Poverty Among Married-Couple Families in Lopatcong Overlook
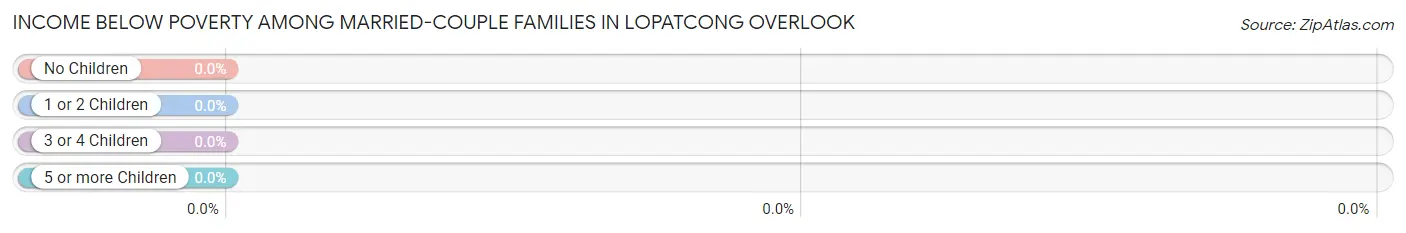
| Children | Above Poverty | Below Poverty |
| No Children | 134 (100.0%) | 0 (0.0%) |
| 1 or 2 Children | 32 (100.0%) | 0 (0.0%) |
| 3 or 4 Children | 0 (0.0%) | 0 (0.0%) |
| 5 or more Children | 0 (0.0%) | 0 (0.0%) |
| Total | 166 (100.0%) | 0 (0.0%) |
Income Below Poverty Among Single-Parent Households in Lopatcong Overlook
| Children | Single Father | Single Mother |
| No Children | 0 (0.0%) | 0 (0.0%) |
| 1 or 2 Children | 0 (0.0%) | 0 (0.0%) |
| 3 or 4 Children | 0 (0.0%) | 0 (0.0%) |
| 5 or more Children | 0 (0.0%) | 0 (0.0%) |
| Total | 0 (0.0%) | 0 (0.0%) |
Income Below Poverty Among Married-Couple vs Single-Parent Households in Lopatcong Overlook
| Children | Married-Couple Families | Single-Parent Households |
| No Children | 0 (0.0%) | 0 (0.0%) |
| 1 or 2 Children | 0 (0.0%) | 0 (0.0%) |
| 3 or 4 Children | 0 (0.0%) | 0 (0.0%) |
| 5 or more Children | 0 (0.0%) | 0 (0.0%) |
| Total | 0 (0.0%) | 0 (0.0%) |
Race in Lopatcong Overlook
The most populous races in Lopatcong Overlook are White / Caucasian (636 | 88.6%), and Black / African American (82 | 11.4%).
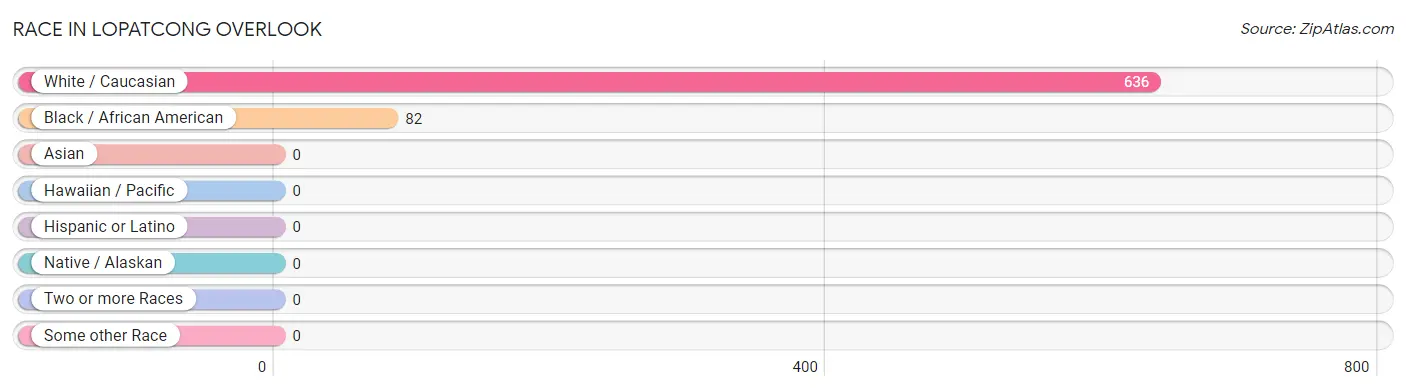
| Race | # Population | % Population |
| Asian | 0 | 0.0% |
| Black / African American | 82 | 11.4% |
| Hawaiian / Pacific | 0 | 0.0% |
| Hispanic or Latino | 0 | 0.0% |
| Native / Alaskan | 0 | 0.0% |
| White / Caucasian | 636 | 88.6% |
| Two or more Races | 0 | 0.0% |
| Some other Race | 0 | 0.0% |
| Total | 718 | 100.0% |
Ancestry in Lopatcong Overlook
The most populous ancestries reported in Lopatcong Overlook are Irish (168 | 23.4%), German (124 | 17.3%), English (113 | 15.7%), Polish (104 | 14.5%), and Scottish (64 | 8.9%), together accounting for 79.8% of all Lopatcong Overlook residents.
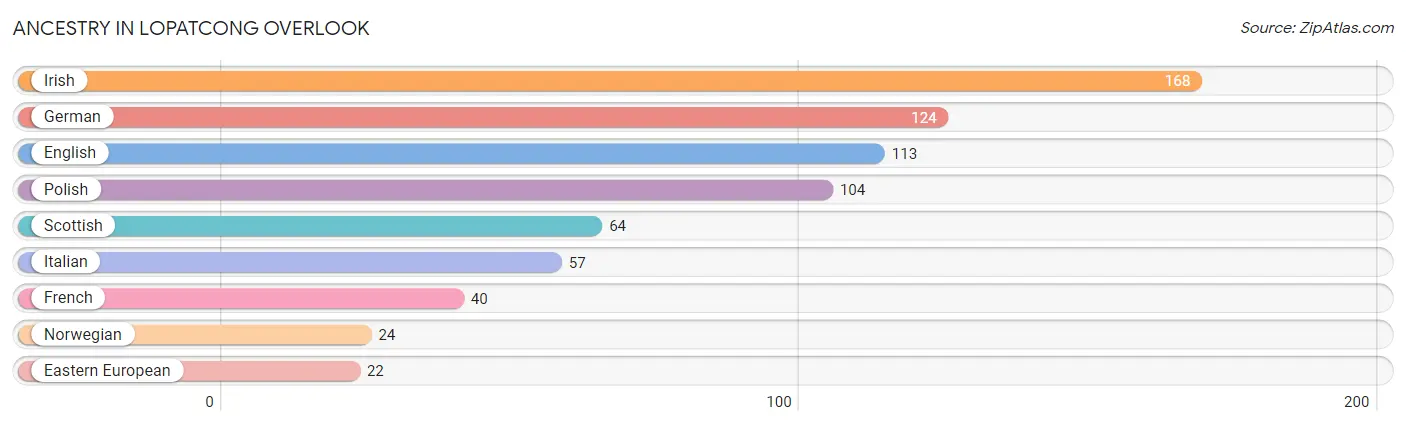
| Ancestry | # Population | % Population |
| Eastern European | 22 | 3.1% |
| English | 113 | 15.7% |
| French | 40 | 5.6% |
| German | 124 | 17.3% |
| Irish | 168 | 23.4% |
| Italian | 57 | 7.9% |
| Norwegian | 24 | 3.3% |
| Polish | 104 | 14.5% |
| Scottish | 64 | 8.9% | View All 9 Rows |
Immigrants in Lopatcong Overlook
The most numerous immigrant groups reported in Lopatcong Overlook came from Europe (12 | 1.7%), Italy (12 | 1.7%), and Southern Europe (12 | 1.7%), together accounting for 5.0% of all Lopatcong Overlook residents.
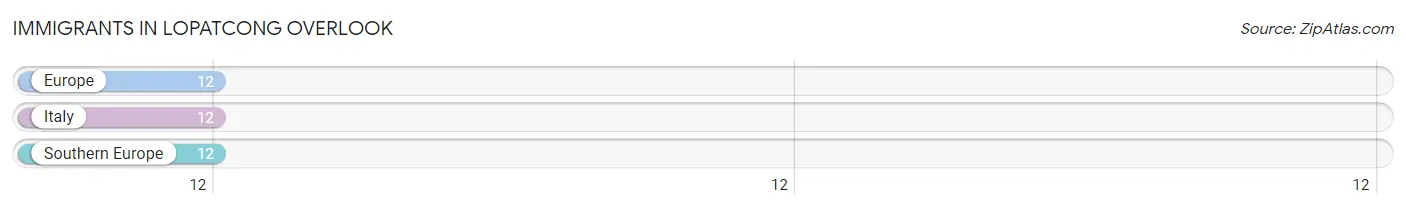
| Immigration Origin | # Population | % Population |
| Europe | 12 | 1.7% |
| Italy | 12 | 1.7% |
| Southern Europe | 12 | 1.7% | View All 3 Rows |
Sex and Age in Lopatcong Overlook
Sex and Age in Lopatcong Overlook
The most populous age groups in Lopatcong Overlook are Under 5 Years (82 | 23.4%) for men and 10 to 14 Years (69 | 18.8%) for women.
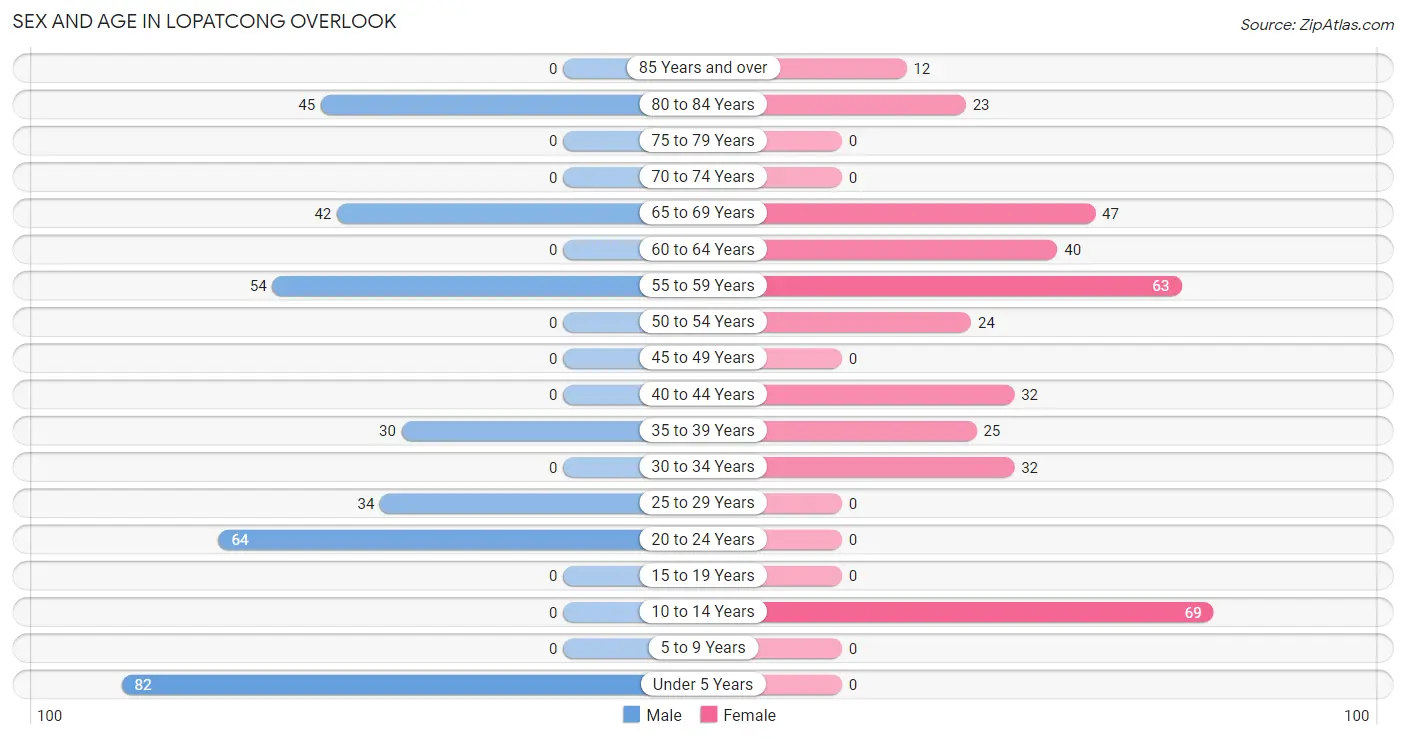
| Age Bracket | Male | Female |
| Under 5 Years | 82 (23.4%) | 0 (0.0%) |
| 5 to 9 Years | 0 (0.0%) | 0 (0.0%) |
| 10 to 14 Years | 0 (0.0%) | 69 (18.8%) |
| 15 to 19 Years | 0 (0.0%) | 0 (0.0%) |
| 20 to 24 Years | 64 (18.2%) | 0 (0.0%) |
| 25 to 29 Years | 34 (9.7%) | 0 (0.0%) |
| 30 to 34 Years | 0 (0.0%) | 32 (8.7%) |
| 35 to 39 Years | 30 (8.6%) | 25 (6.8%) |
| 40 to 44 Years | 0 (0.0%) | 32 (8.7%) |
| 45 to 49 Years | 0 (0.0%) | 0 (0.0%) |
| 50 to 54 Years | 0 (0.0%) | 24 (6.5%) |
| 55 to 59 Years | 54 (15.4%) | 63 (17.2%) |
| 60 to 64 Years | 0 (0.0%) | 40 (10.9%) |
| 65 to 69 Years | 42 (12.0%) | 47 (12.8%) |
| 70 to 74 Years | 0 (0.0%) | 0 (0.0%) |
| 75 to 79 Years | 0 (0.0%) | 0 (0.0%) |
| 80 to 84 Years | 45 (12.8%) | 23 (6.3%) |
| 85 Years and over | 0 (0.0%) | 12 (3.3%) |
| Total | 351 (100.0%) | 367 (100.0%) |
Families and Households in Lopatcong Overlook
Median Family Size in Lopatcong Overlook
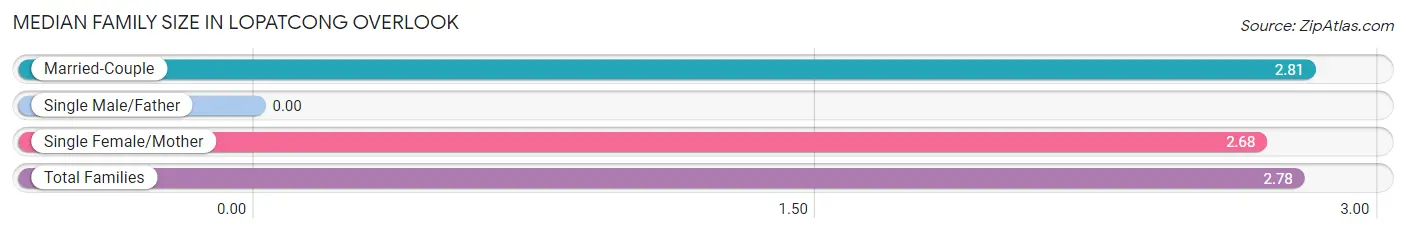
| Family Type | # Families | Family Size |
| Married-Couple | 166 (74.8%) | 2.81 |
| Single Male/Father | 0 (0.0%) | - |
| Single Female/Mother | 56 (25.2%) | 2.68 |
| Total Families | 222 (100.0%) | 2.78 |
Median Household Size in Lopatcong Overlook
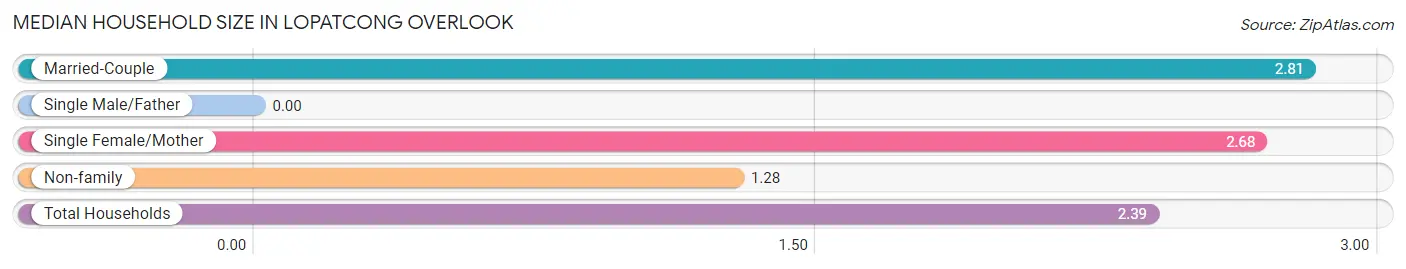
| Household Type | # Households | Household Size |
| Married-Couple | 166 (55.1%) | 2.81 |
| Single Male/Father | 0 (0.0%) | - |
| Single Female/Mother | 56 (18.6%) | 2.68 |
| Non-family | 79 (26.3%) | 1.28 |
| Total Households | 301 (100.0%) | 2.39 |
Household Size by Marriage Status in Lopatcong Overlook
Out of a total of 301 households in Lopatcong Overlook, 222 (73.8%) are family households, while 79 (26.3%) are nonfamily households. The most numerous type of family households are 2-person households, comprising 142, and the most common type of nonfamily households are 1-person households, comprising 54.
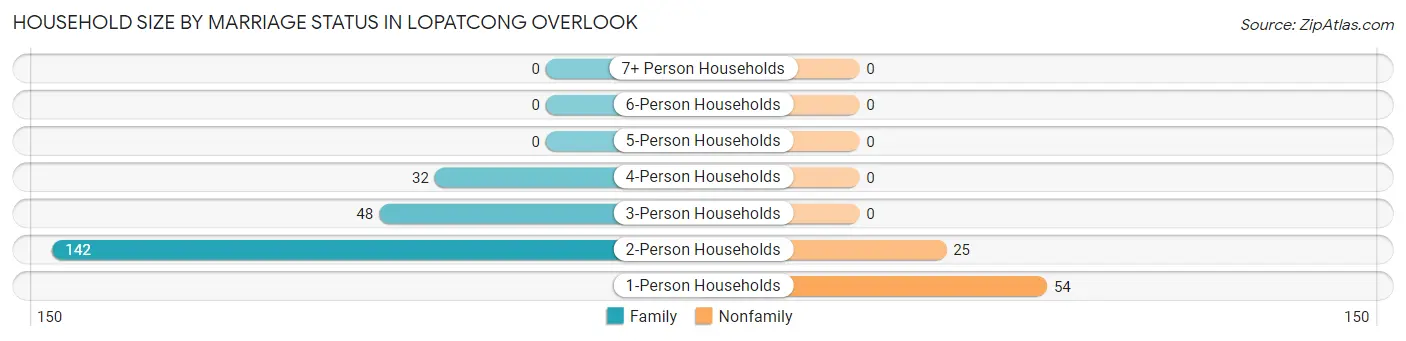
| Household Size | Family Households | Nonfamily Households |
| 1-Person Households | - | 54 (17.9%) |
| 2-Person Households | 142 (47.2%) | 25 (8.3%) |
| 3-Person Households | 48 (16.0%) | 0 (0.0%) |
| 4-Person Households | 32 (10.6%) | 0 (0.0%) |
| 5-Person Households | 0 (0.0%) | 0 (0.0%) |
| 6-Person Households | 0 (0.0%) | 0 (0.0%) |
| 7+ Person Households | 0 (0.0%) | 0 (0.0%) |
| Total | 222 (73.8%) | 79 (26.3%) |
Female Fertility in Lopatcong Overlook
Fertility by Age in Lopatcong Overlook
Average fertility rate in Lopatcong Overlook is 360.0 births per 1,000 women. Women in the age bracket of 20 to 34 years have the highest fertility rate with 1,000.0 births per 1,000 women. Women in the age bracket of 20 to 34 years acount for 100.0% of all women with births.
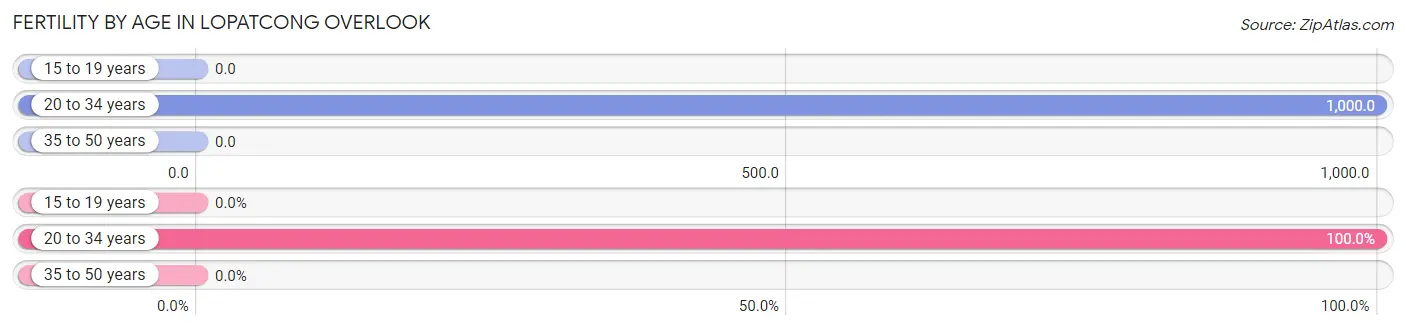
| Age Bracket | Women with Births | Births / 1,000 Women |
| 15 to 19 years | 0 (0.0%) | 0.0 |
| 20 to 34 years | 32 (100.0%) | 1,000.0 |
| 35 to 50 years | 0 (0.0%) | 0.0 |
| Total | 32 (100.0%) | 360.0 |
Fertility by Age by Marriage Status in Lopatcong Overlook
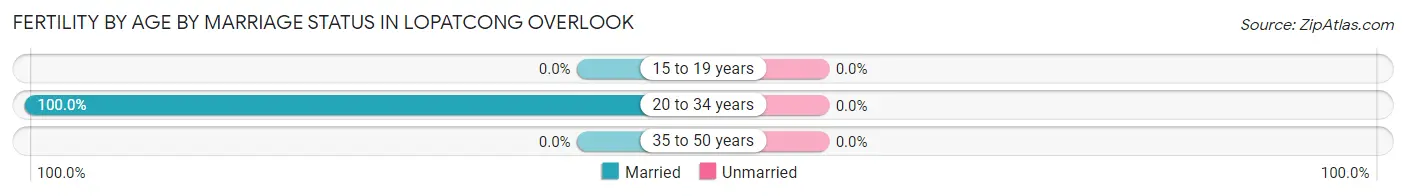
| Age Bracket | Married | Unmarried |
| 15 to 19 years | 0 (0.0%) | 0 (0.0%) |
| 20 to 34 years | 32 (100.0%) | 0 (0.0%) |
| 35 to 50 years | 0 (0.0%) | 0 (0.0%) |
| Total | 32 (100.0%) | 0 (0.0%) |
Fertility by Education in Lopatcong Overlook
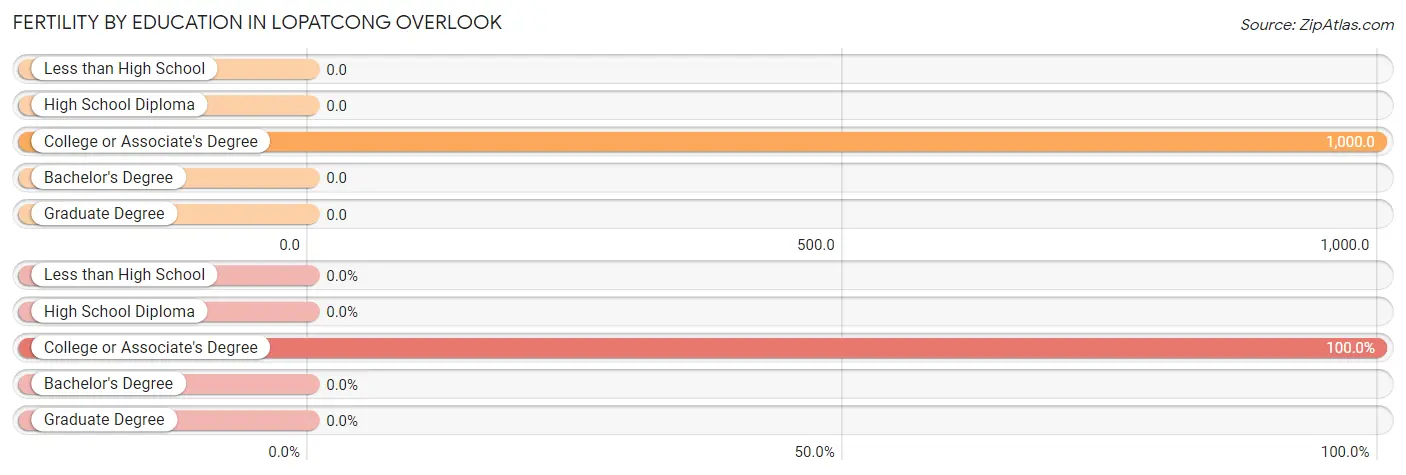
| Educational Attainment | Women with Births | Births / 1,000 Women |
| Less than High School | 0 (0.0%) | 0.0 |
| High School Diploma | 0 (0.0%) | 0.0 |
| College or Associate's Degree | 32 (100.0%) | 1,000.0 |
| Bachelor's Degree | 0 (0.0%) | 0.0 |
| Graduate Degree | 0 (0.0%) | 0.0 |
| Total | 32 (100.0%) | 360.0 |
Fertility by Education by Marriage Status in Lopatcong Overlook
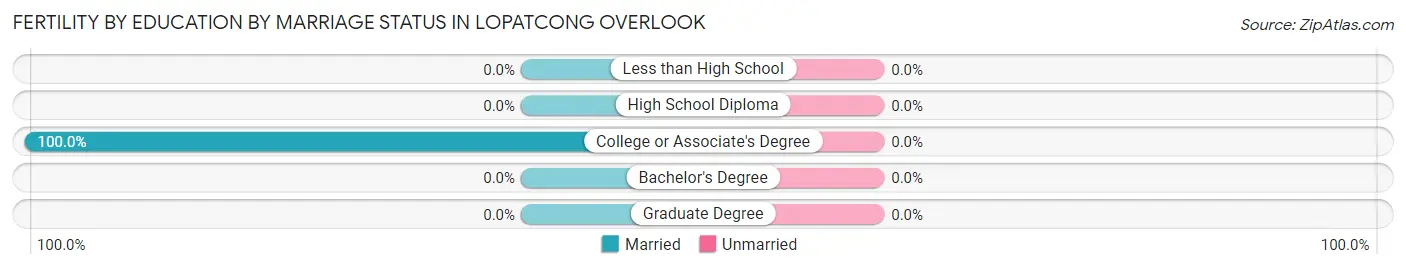
| Educational Attainment | Married | Unmarried |
| Less than High School | 0 (0.0%) | 0 (0.0%) |
| High School Diploma | 0 (0.0%) | 0 (0.0%) |
| College or Associate's Degree | 32 (100.0%) | 0 (0.0%) |
| Bachelor's Degree | 0 (0.0%) | 0 (0.0%) |
| Graduate Degree | 0 (0.0%) | 0 (0.0%) |
| Total | 32 (100.0%) | 0 (0.0%) |
Employment Characteristics in Lopatcong Overlook
Employment by Class of Employer in Lopatcong Overlook
Among the 401 employed individuals in Lopatcong Overlook, private company employees (263 | 65.6%), local government employees (71 | 17.7%), and state government employees (40 | 10.0%) make up the most common classes of employment.
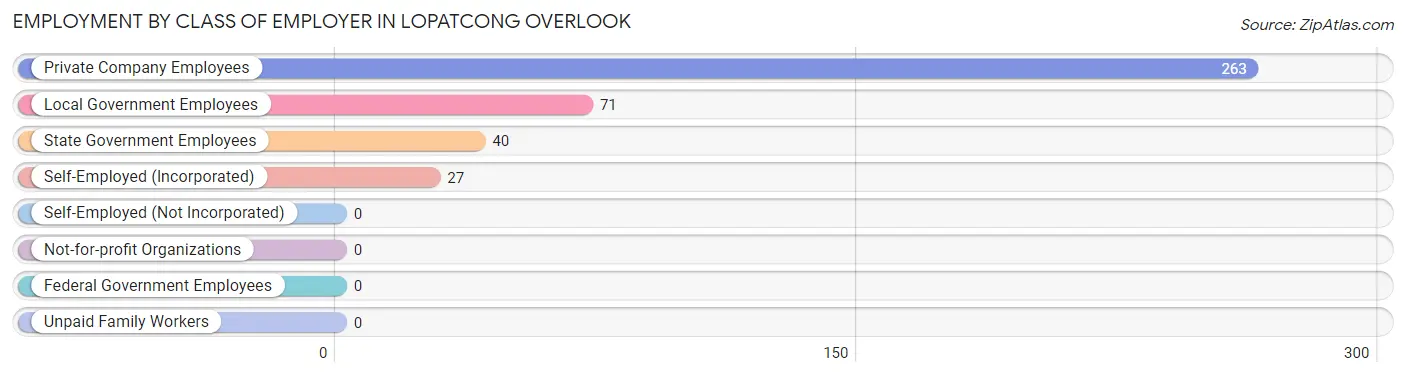
| Employer Class | # Employees | % Employees |
| Private Company Employees | 263 | 65.6% |
| Self-Employed (Incorporated) | 27 | 6.7% |
| Self-Employed (Not Incorporated) | 0 | 0.0% |
| Not-for-profit Organizations | 0 | 0.0% |
| Local Government Employees | 71 | 17.7% |
| State Government Employees | 40 | 10.0% |
| Federal Government Employees | 0 | 0.0% |
| Unpaid Family Workers | 0 | 0.0% |
| Total | 401 | 100.0% |
Employment Status by Age in Lopatcong Overlook
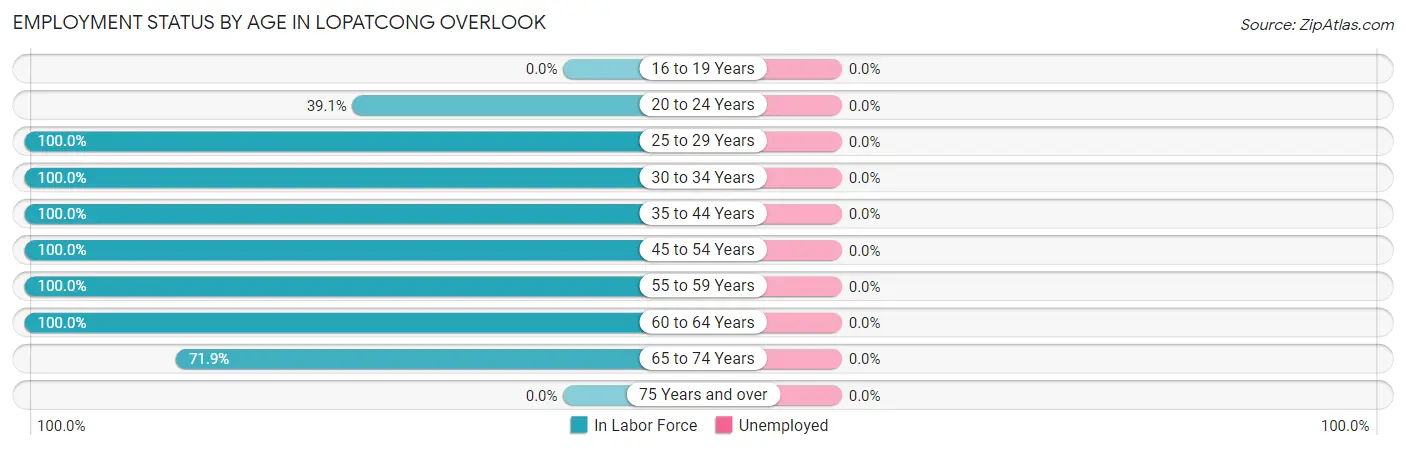
| Age Bracket | In Labor Force | Unemployed |
| 16 to 19 Years | 0 (0.0%) | 0 (0.0%) |
| 20 to 24 Years | 25 (39.1%) | 0 (0.0%) |
| 25 to 29 Years | 34 (100.0%) | 0 (0.0%) |
| 30 to 34 Years | 32 (100.0%) | 0 (0.0%) |
| 35 to 44 Years | 87 (100.0%) | 0 (0.0%) |
| 45 to 54 Years | 24 (100.0%) | 0 (0.0%) |
| 55 to 59 Years | 117 (100.0%) | 0 (0.0%) |
| 60 to 64 Years | 40 (100.0%) | 0 (0.0%) |
| 65 to 74 Years | 64 (71.9%) | 0 (0.0%) |
| 75 Years and over | 0 (0.0%) | 0 (0.0%) |
| Total | 423 (74.6%) | 0 (0.0%) |
Employment Status by Educational Attainment in Lopatcong Overlook
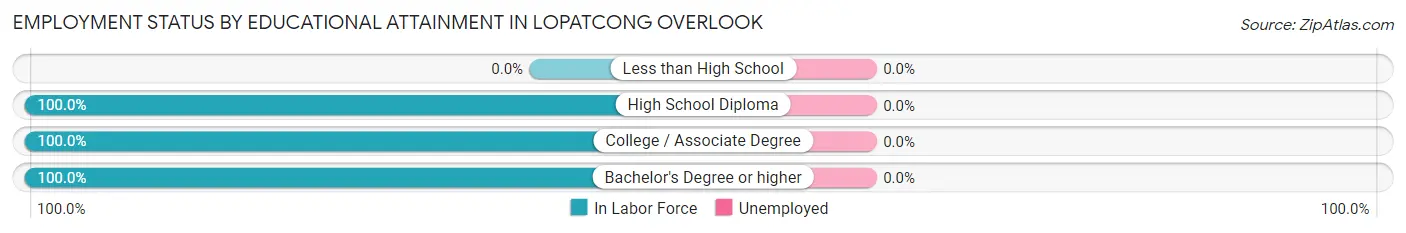
| Educational Attainment | In Labor Force | Unemployed |
| Less than High School | 0 (0.0%) | 0 (0.0%) |
| High School Diploma | 70 (100.0%) | 0 (0.0%) |
| College / Associate Degree | 119 (100.0%) | 0 (0.0%) |
| Bachelor's Degree or higher | 145 (100.0%) | 0 (0.0%) |
| Total | 334 (100.0%) | 0 (0.0%) |
Employment Occupations by Sex in Lopatcong Overlook
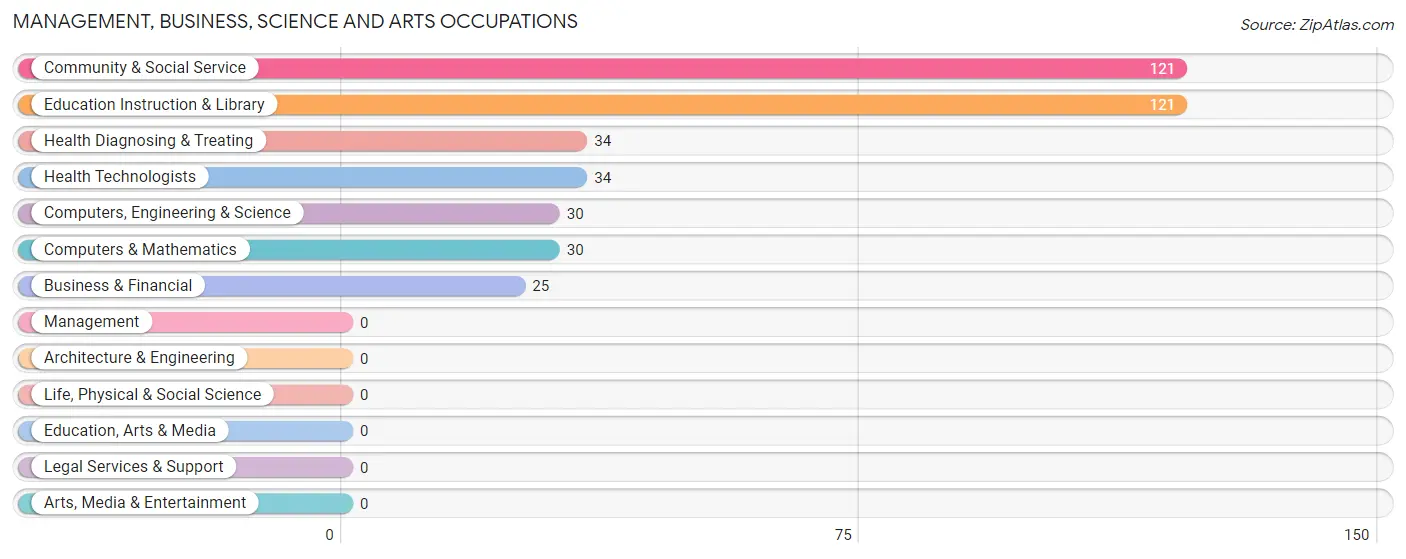
Management, Business, Science and Arts Occupations
The most common Management, Business, Science and Arts occupations in Lopatcong Overlook are Community & Social Service (121 | 28.6%), Education Instruction & Library (121 | 28.6%), Health Diagnosing & Treating (34 | 8.0%), Health Technologists (34 | 8.0%), and Computers, Engineering & Science (30 | 7.1%).
Management, Business, Science and Arts Occupations by Sex
Within the Management, Business, Science and Arts occupations in Lopatcong Overlook, the most male-oriented occupations are Computers, Engineering & Science (100.0%), Computers & Mathematics (100.0%), and Health Diagnosing & Treating (100.0%), while the most female-oriented occupations are Business & Financial (100.0%), Community & Social Service (100.0%), and Education Instruction & Library (100.0%).
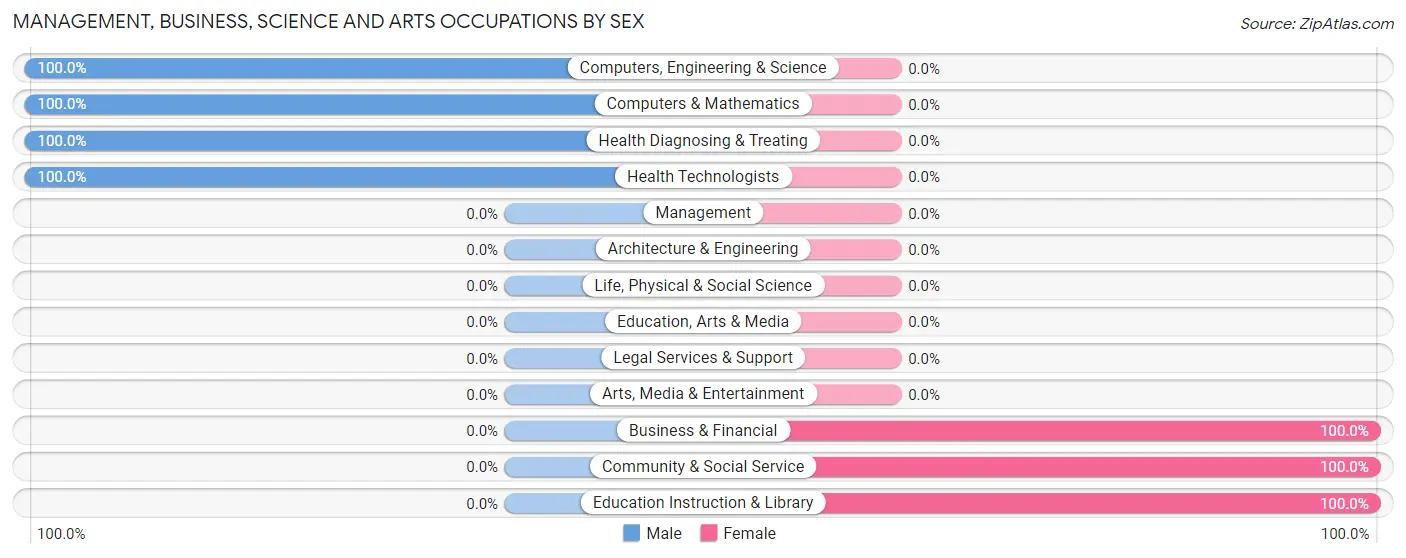
| Occupation | Male | Female |
| Management | 0 (0.0%) | 0 (0.0%) |
| Business & Financial | 0 (0.0%) | 25 (100.0%) |
| Computers, Engineering & Science | 30 (100.0%) | 0 (0.0%) |
| Computers & Mathematics | 30 (100.0%) | 0 (0.0%) |
| Architecture & Engineering | 0 (0.0%) | 0 (0.0%) |
| Life, Physical & Social Science | 0 (0.0%) | 0 (0.0%) |
| Community & Social Service | 0 (0.0%) | 121 (100.0%) |
| Education, Arts & Media | 0 (0.0%) | 0 (0.0%) |
| Legal Services & Support | 0 (0.0%) | 0 (0.0%) |
| Education Instruction & Library | 0 (0.0%) | 121 (100.0%) |
| Arts, Media & Entertainment | 0 (0.0%) | 0 (0.0%) |
| Health Diagnosing & Treating | 34 (100.0%) | 0 (0.0%) |
| Health Technologists | 34 (100.0%) | 0 (0.0%) |
| Total (Category) | 64 (30.5%) | 146 (69.5%) |
| Total (Overall) | 185 (43.7%) | 238 (56.3%) |
Services Occupations
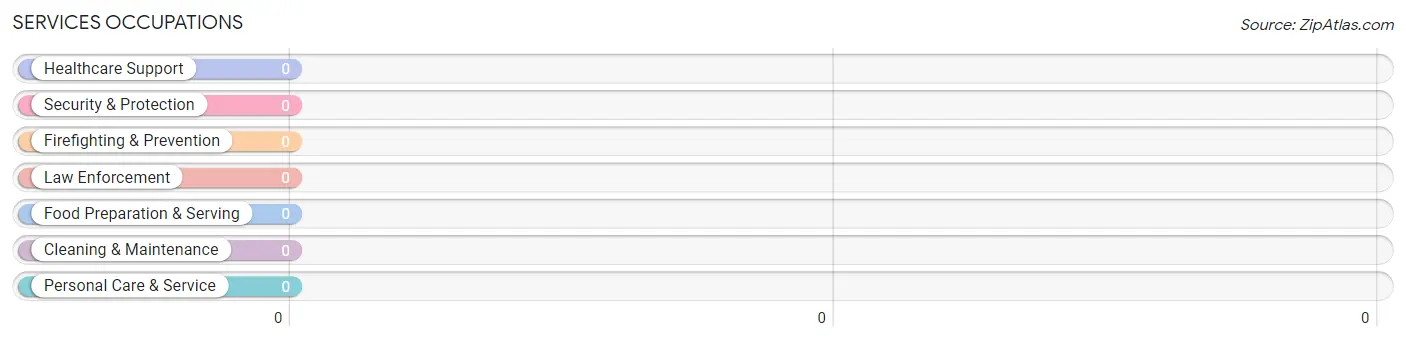
Services Occupations by Sex
| Occupation | Male | Female |
| Healthcare Support | 0 (0.0%) | 0 (0.0%) |
| Security & Protection | 0 (0.0%) | 0 (0.0%) |
| Firefighting & Prevention | 0 (0.0%) | 0 (0.0%) |
| Law Enforcement | 0 (0.0%) | 0 (0.0%) |
| Food Preparation & Serving | 0 (0.0%) | 0 (0.0%) |
| Cleaning & Maintenance | 0 (0.0%) | 0 (0.0%) |
| Personal Care & Service | 0 (0.0%) | 0 (0.0%) |
| Total (Category) | 0 (0.0%) | 0 (0.0%) |
| Total (Overall) | 185 (43.7%) | 238 (56.3%) |
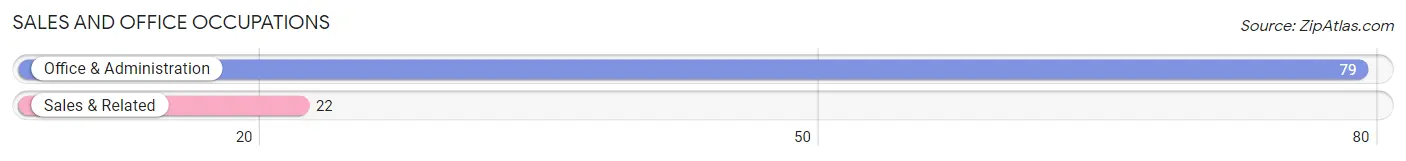
Sales and Office Occupations
The most common Sales and Office occupations in Lopatcong Overlook are Office & Administration (79 | 18.7%), and Sales & Related (22 | 5.2%).
Sales and Office Occupations by Sex

| Occupation | Male | Female |
| Sales & Related | 0 (0.0%) | 22 (100.0%) |
| Office & Administration | 25 (31.7%) | 54 (68.3%) |
| Total (Category) | 25 (24.7%) | 76 (75.2%) |
| Total (Overall) | 185 (43.7%) | 238 (56.3%) |
Natural Resources, Construction and Maintenance Occupations
Natural Resources, Construction and Maintenance Occupations by Sex
| Occupation | Male | Female |
| Farming, Fishing & Forestry | 0 (0.0%) | 0 (0.0%) |
| Construction & Extraction | 0 (0.0%) | 0 (0.0%) |
| Installation, Maintenance & Repair | 0 (0.0%) | 0 (0.0%) |
| Total (Category) | 0 (0.0%) | 0 (0.0%) |
| Total (Overall) | 185 (43.7%) | 238 (56.3%) |
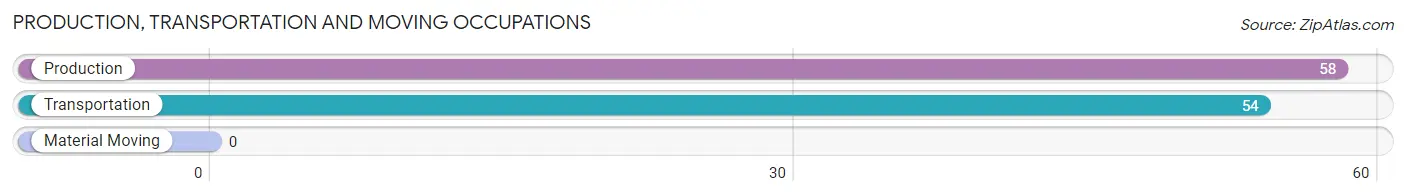
Production, Transportation and Moving Occupations
The most common Production, Transportation and Moving occupations in Lopatcong Overlook are Production (58 | 13.7%), and Transportation (54 | 12.8%).
Production, Transportation and Moving Occupations by Sex
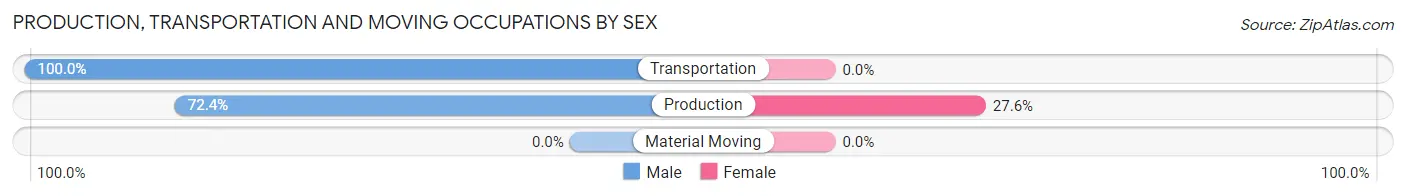
| Occupation | Male | Female |
| Production | 42 (72.4%) | 16 (27.6%) |
| Transportation | 54 (100.0%) | 0 (0.0%) |
| Material Moving | 0 (0.0%) | 0 (0.0%) |
| Total (Category) | 96 (85.7%) | 16 (14.3%) |
| Total (Overall) | 185 (43.7%) | 238 (56.3%) |
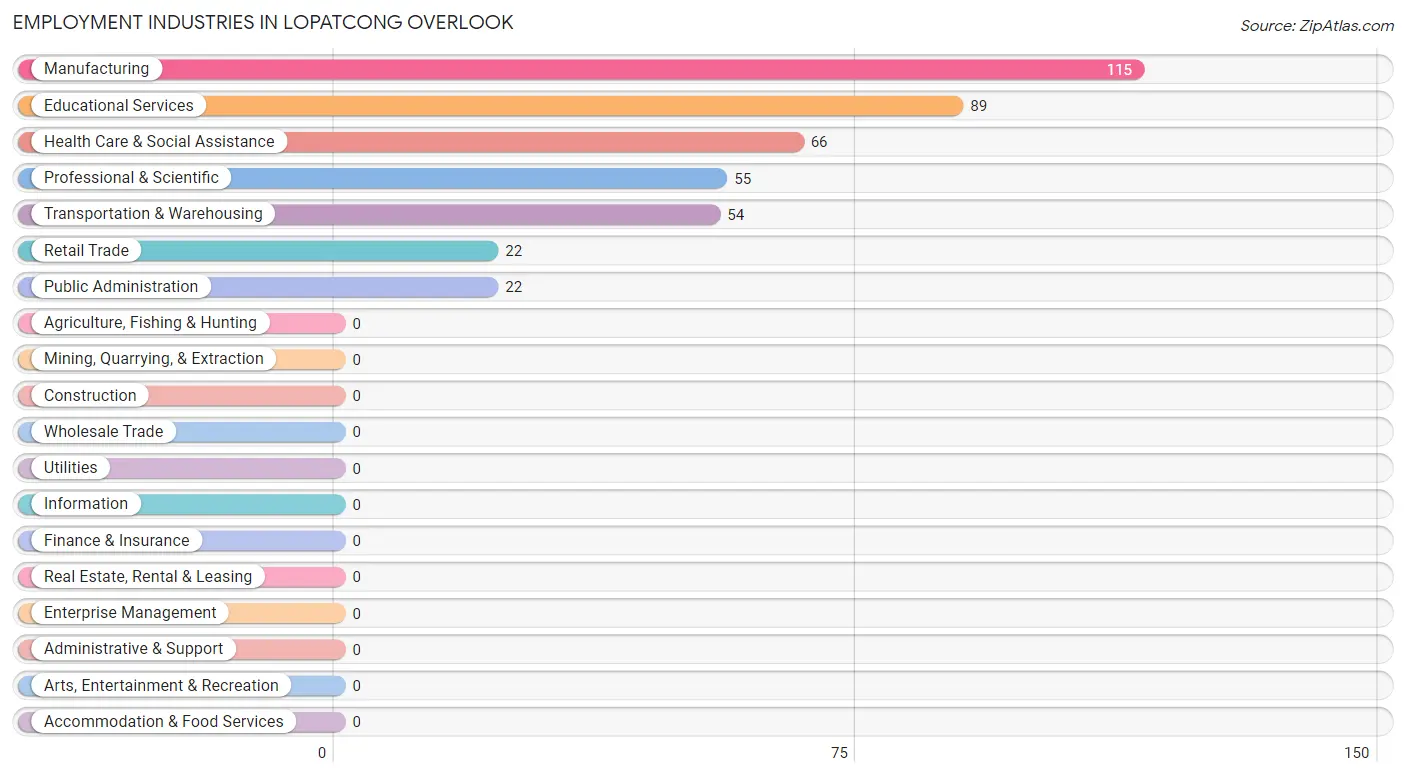
Employment Industries by Sex in Lopatcong Overlook
Employment Industries in Lopatcong Overlook
The major employment industries in Lopatcong Overlook include Manufacturing (115 | 27.2%), Educational Services (89 | 21.0%), Health Care & Social Assistance (66 | 15.6%), Professional & Scientific (55 | 13.0%), and Transportation & Warehousing (54 | 12.8%).
Employment Industries by Sex in Lopatcong Overlook
The Lopatcong Overlook industries that see more men than women are Transportation & Warehousing (100.0%), Professional & Scientific (100.0%), and Health Care & Social Assistance (51.5%), whereas the industries that tend to have a higher number of women are Retail Trade (100.0%), Educational Services (100.0%), and Public Administration (100.0%).
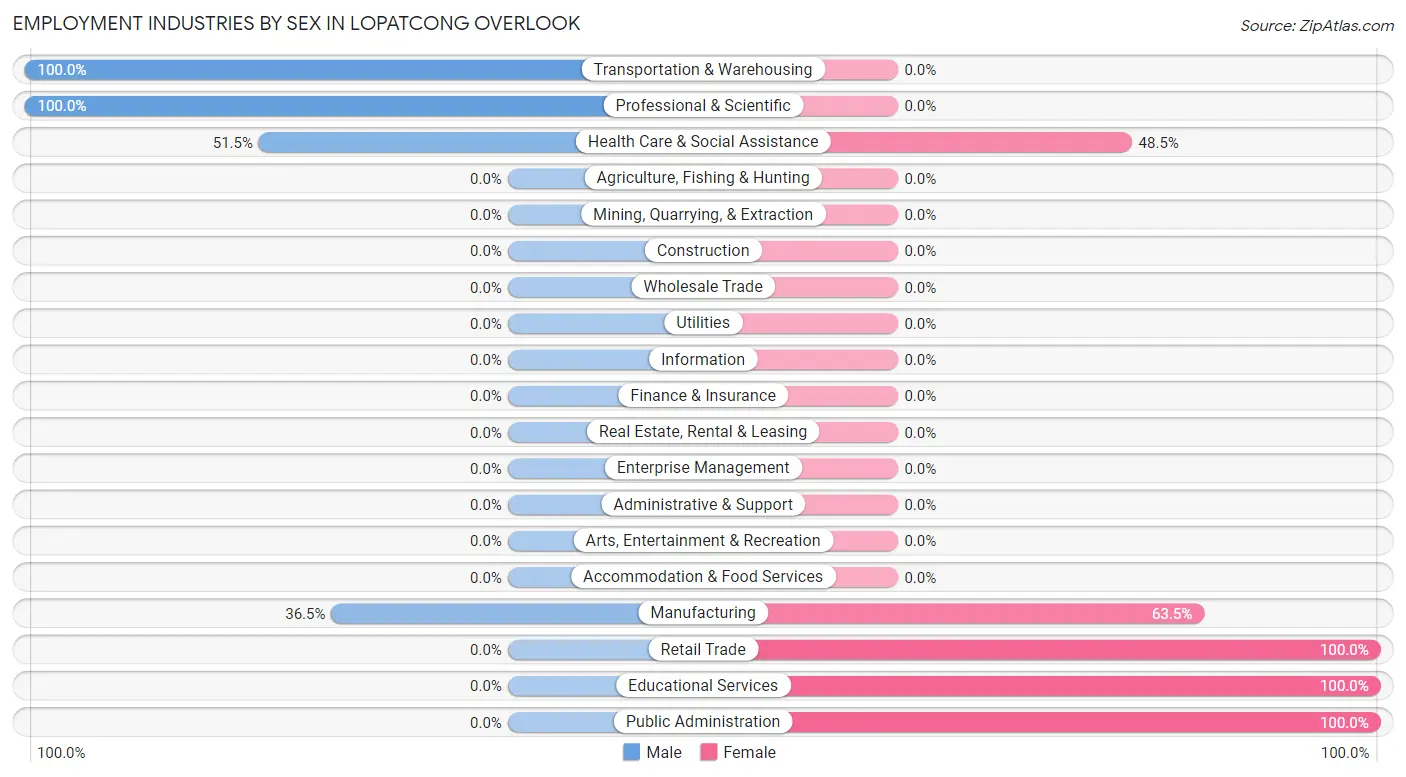
| Industry | Male | Female |
| Agriculture, Fishing & Hunting | 0 (0.0%) | 0 (0.0%) |
| Mining, Quarrying, & Extraction | 0 (0.0%) | 0 (0.0%) |
| Construction | 0 (0.0%) | 0 (0.0%) |
| Manufacturing | 42 (36.5%) | 73 (63.5%) |
| Wholesale Trade | 0 (0.0%) | 0 (0.0%) |
| Retail Trade | 0 (0.0%) | 22 (100.0%) |
| Transportation & Warehousing | 54 (100.0%) | 0 (0.0%) |
| Utilities | 0 (0.0%) | 0 (0.0%) |
| Information | 0 (0.0%) | 0 (0.0%) |
| Finance & Insurance | 0 (0.0%) | 0 (0.0%) |
| Real Estate, Rental & Leasing | 0 (0.0%) | 0 (0.0%) |
| Professional & Scientific | 55 (100.0%) | 0 (0.0%) |
| Enterprise Management | 0 (0.0%) | 0 (0.0%) |
| Administrative & Support | 0 (0.0%) | 0 (0.0%) |
| Educational Services | 0 (0.0%) | 89 (100.0%) |
| Health Care & Social Assistance | 34 (51.5%) | 32 (48.5%) |
| Arts, Entertainment & Recreation | 0 (0.0%) | 0 (0.0%) |
| Accommodation & Food Services | 0 (0.0%) | 0 (0.0%) |
| Public Administration | 0 (0.0%) | 22 (100.0%) |
| Total | 185 (43.7%) | 238 (56.3%) |
Education in Lopatcong Overlook
School Enrollment in Lopatcong Overlook
The most common levels of schooling among the 94 students in Lopatcong Overlook are middle school (69 | 73.4%), and college / undergraduate (25 | 26.6%).
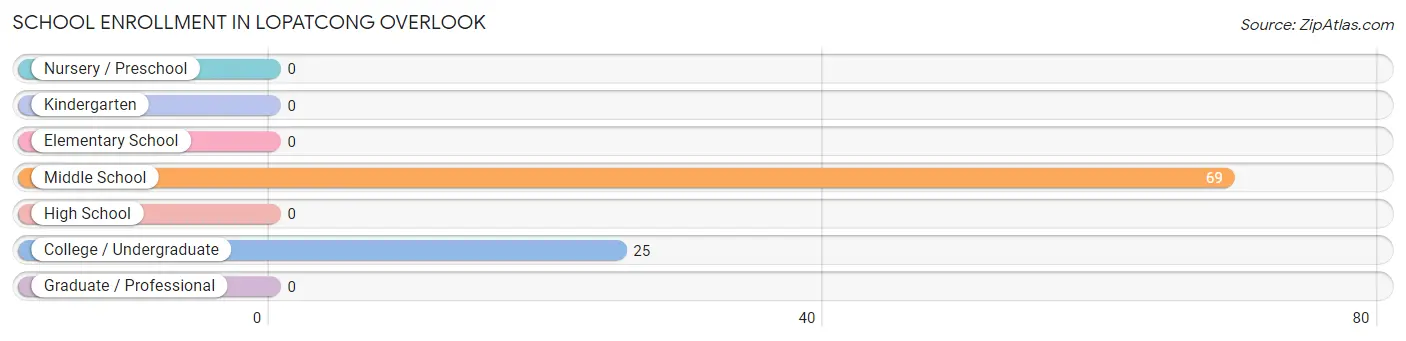
| School Level | # Students | % Students |
| Nursery / Preschool | 0 | 0.0% |
| Kindergarten | 0 | 0.0% |
| Elementary School | 0 | 0.0% |
| Middle School | 69 | 73.4% |
| High School | 0 | 0.0% |
| College / Undergraduate | 25 | 26.6% |
| Graduate / Professional | 0 | 0.0% |
| Total | 94 | 100.0% |
School Enrollment by Age by Funding Source in Lopatcong Overlook
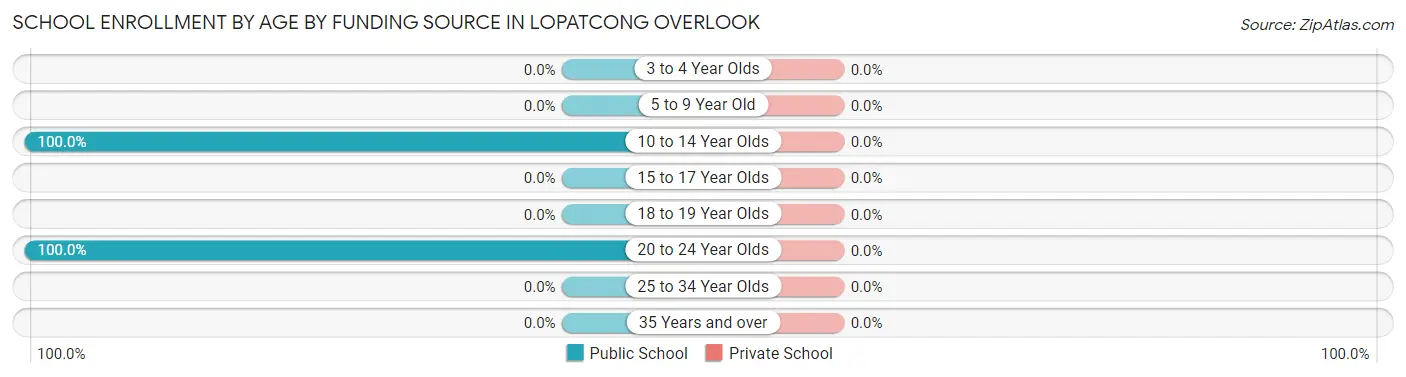
| Age Bracket | Public School | Private School |
| 3 to 4 Year Olds | 0 (0.0%) | 0 (0.0%) |
| 5 to 9 Year Old | 0 (0.0%) | 0 (0.0%) |
| 10 to 14 Year Olds | 69 (100.0%) | 0 (0.0%) |
| 15 to 17 Year Olds | 0 (0.0%) | 0 (0.0%) |
| 18 to 19 Year Olds | 0 (0.0%) | 0 (0.0%) |
| 20 to 24 Year Olds | 25 (100.0%) | 0 (0.0%) |
| 25 to 34 Year Olds | 0 (0.0%) | 0 (0.0%) |
| 35 Years and over | 0 (0.0%) | 0 (0.0%) |
| Total | 94 (100.0%) | 0 (0.0%) |
Educational Attainment by Field of Study in Lopatcong Overlook
Education (60 | 31.2%), arts & humanities (34 | 17.7%), psychology (32 | 16.7%), business (30 | 15.6%), and visual & performing arts (24 | 12.5%) are the most common fields of study among 192 individuals in Lopatcong Overlook who have obtained a bachelor's degree or higher.
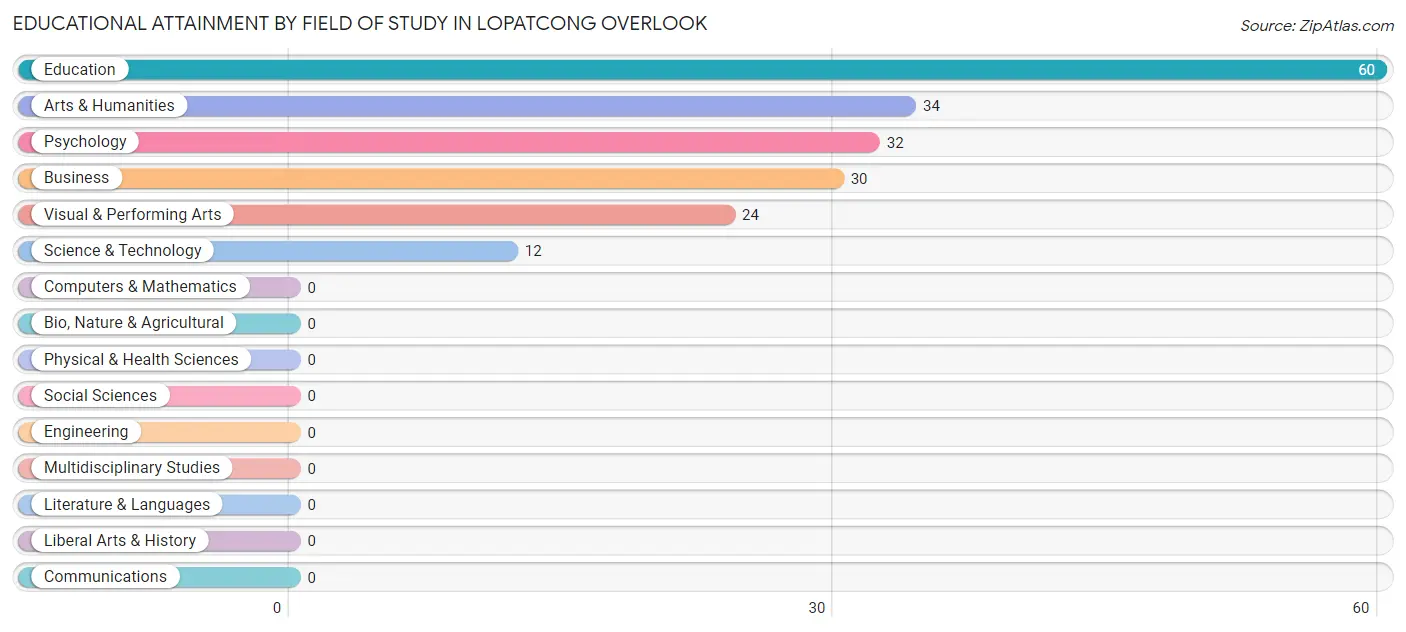
| Field of Study | # Graduates | % Graduates |
| Computers & Mathematics | 0 | 0.0% |
| Bio, Nature & Agricultural | 0 | 0.0% |
| Physical & Health Sciences | 0 | 0.0% |
| Psychology | 32 | 16.7% |
| Social Sciences | 0 | 0.0% |
| Engineering | 0 | 0.0% |
| Multidisciplinary Studies | 0 | 0.0% |
| Science & Technology | 12 | 6.2% |
| Business | 30 | 15.6% |
| Education | 60 | 31.2% |
| Literature & Languages | 0 | 0.0% |
| Liberal Arts & History | 0 | 0.0% |
| Visual & Performing Arts | 24 | 12.5% |
| Communications | 0 | 0.0% |
| Arts & Humanities | 34 | 17.7% |
| Total | 192 | 100.0% |
Transportation & Commute in Lopatcong Overlook
Vehicle Availability by Sex in Lopatcong Overlook
The most prevalent vehicle ownership categories in Lopatcong Overlook are males with 2 vehicles (133, accounting for 71.9%) and females with 2 vehicles (122, making up 61.6%).
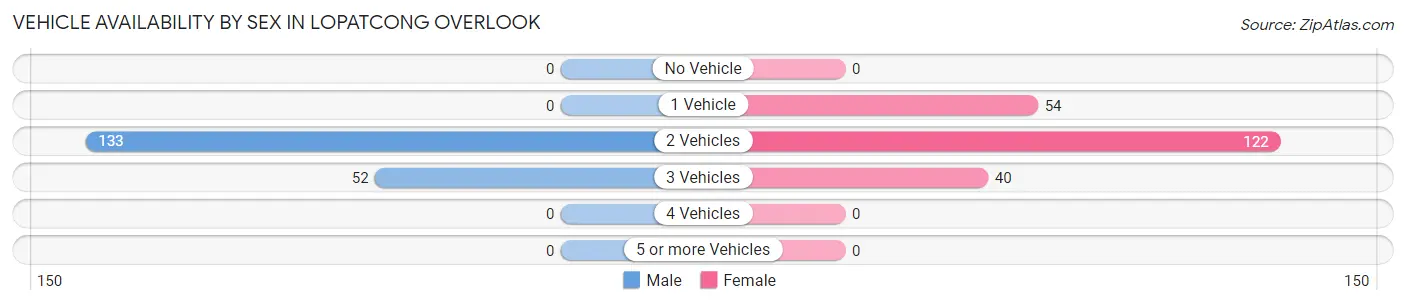
| Vehicles Available | Male | Female |
| No Vehicle | 0 (0.0%) | 0 (0.0%) |
| 1 Vehicle | 0 (0.0%) | 54 (25.0%) |
| 2 Vehicles | 133 (71.9%) | 122 (56.5%) |
| 3 Vehicles | 52 (28.1%) | 40 (18.5%) |
| 4 Vehicles | 0 (0.0%) | 0 (0.0%) |
| 5 or more Vehicles | 0 (0.0%) | 0 (0.0%) |
| Total | 185 (100.0%) | 216 (100.0%) |
Commute Time in Lopatcong Overlook
The most frequently occuring commute durations in Lopatcong Overlook are 20 to 24 minutes (69 commuters, 19.9%), 35 to 39 minutes (61 commuters, 17.6%), and 60 to 89 minutes (49 commuters, 14.2%).
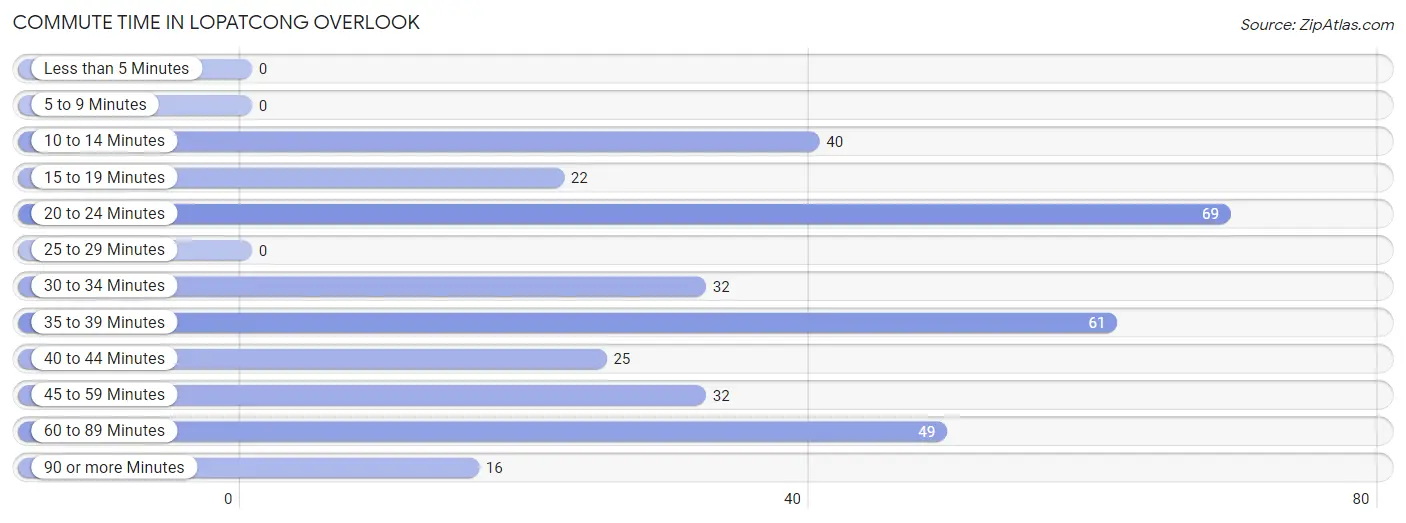
| Commute Time | # Commuters | % Commuters |
| Less than 5 Minutes | 0 | 0.0% |
| 5 to 9 Minutes | 0 | 0.0% |
| 10 to 14 Minutes | 40 | 11.6% |
| 15 to 19 Minutes | 22 | 6.4% |
| 20 to 24 Minutes | 69 | 19.9% |
| 25 to 29 Minutes | 0 | 0.0% |
| 30 to 34 Minutes | 32 | 9.2% |
| 35 to 39 Minutes | 61 | 17.6% |
| 40 to 44 Minutes | 25 | 7.2% |
| 45 to 59 Minutes | 32 | 9.2% |
| 60 to 89 Minutes | 49 | 14.2% |
| 90 or more Minutes | 16 | 4.6% |
Commute Time by Sex in Lopatcong Overlook
The most common commute times in Lopatcong Overlook are 20 to 24 minutes (69 commuters, 53.1%) for males and 60 to 89 minutes (49 commuters, 22.7%) for females.
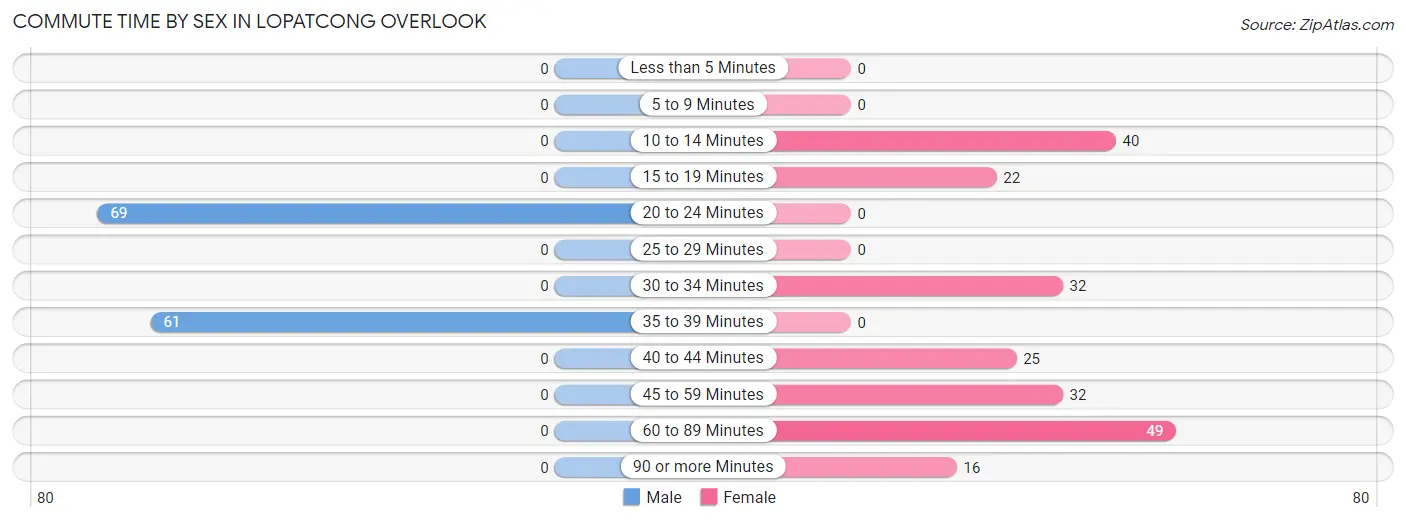
| Commute Time | Male | Female |
| Less than 5 Minutes | 0 (0.0%) | 0 (0.0%) |
| 5 to 9 Minutes | 0 (0.0%) | 0 (0.0%) |
| 10 to 14 Minutes | 0 (0.0%) | 40 (18.5%) |
| 15 to 19 Minutes | 0 (0.0%) | 22 (10.2%) |
| 20 to 24 Minutes | 69 (53.1%) | 0 (0.0%) |
| 25 to 29 Minutes | 0 (0.0%) | 0 (0.0%) |
| 30 to 34 Minutes | 0 (0.0%) | 32 (14.8%) |
| 35 to 39 Minutes | 61 (46.9%) | 0 (0.0%) |
| 40 to 44 Minutes | 0 (0.0%) | 25 (11.6%) |
| 45 to 59 Minutes | 0 (0.0%) | 32 (14.8%) |
| 60 to 89 Minutes | 0 (0.0%) | 49 (22.7%) |
| 90 or more Minutes | 0 (0.0%) | 16 (7.4%) |
Time of Departure to Work by Sex in Lopatcong Overlook
The most frequent times of departure to work in Lopatcong Overlook are 7:30 AM to 7:59 AM (61, 46.9%) for males and 8:00 AM to 8:29 AM (54, 25.0%) for females.
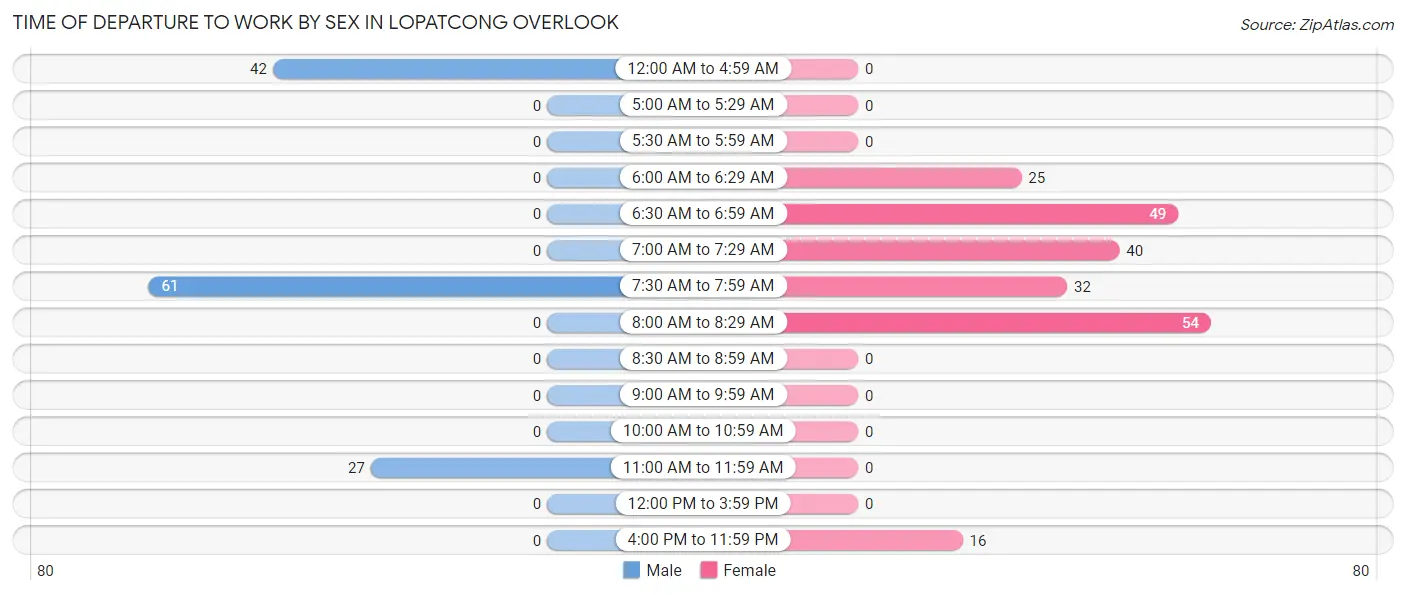
| Time of Departure | Male | Female |
| 12:00 AM to 4:59 AM | 42 (32.3%) | 0 (0.0%) |
| 5:00 AM to 5:29 AM | 0 (0.0%) | 0 (0.0%) |
| 5:30 AM to 5:59 AM | 0 (0.0%) | 0 (0.0%) |
| 6:00 AM to 6:29 AM | 0 (0.0%) | 25 (11.6%) |
| 6:30 AM to 6:59 AM | 0 (0.0%) | 49 (22.7%) |
| 7:00 AM to 7:29 AM | 0 (0.0%) | 40 (18.5%) |
| 7:30 AM to 7:59 AM | 61 (46.9%) | 32 (14.8%) |
| 8:00 AM to 8:29 AM | 0 (0.0%) | 54 (25.0%) |
| 8:30 AM to 8:59 AM | 0 (0.0%) | 0 (0.0%) |
| 9:00 AM to 9:59 AM | 0 (0.0%) | 0 (0.0%) |
| 10:00 AM to 10:59 AM | 0 (0.0%) | 0 (0.0%) |
| 11:00 AM to 11:59 AM | 27 (20.8%) | 0 (0.0%) |
| 12:00 PM to 3:59 PM | 0 (0.0%) | 0 (0.0%) |
| 4:00 PM to 11:59 PM | 0 (0.0%) | 16 (7.4%) |
| Total | 130 (100.0%) | 216 (100.0%) |
Housing Occupancy in Lopatcong Overlook
Occupancy by Ownership in Lopatcong Overlook
Of the total 301 dwellings in Lopatcong Overlook, owner-occupied units account for 265 (88.0%), while renter-occupied units make up 36 (12.0%).
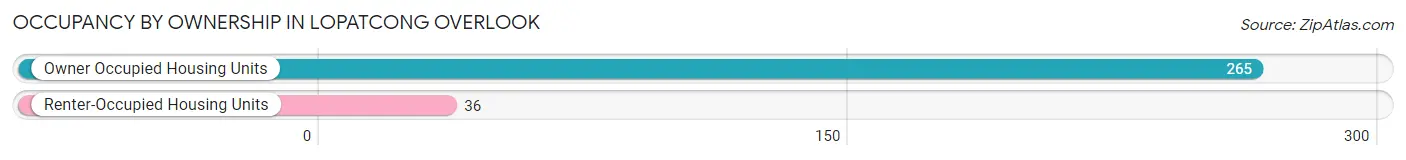
| Occupancy | # Housing Units | % Housing Units |
| Owner Occupied Housing Units | 265 | 88.0% |
| Renter-Occupied Housing Units | 36 | 12.0% |
| Total Occupied Housing Units | 301 | 100.0% |
Occupancy by Household Size in Lopatcong Overlook
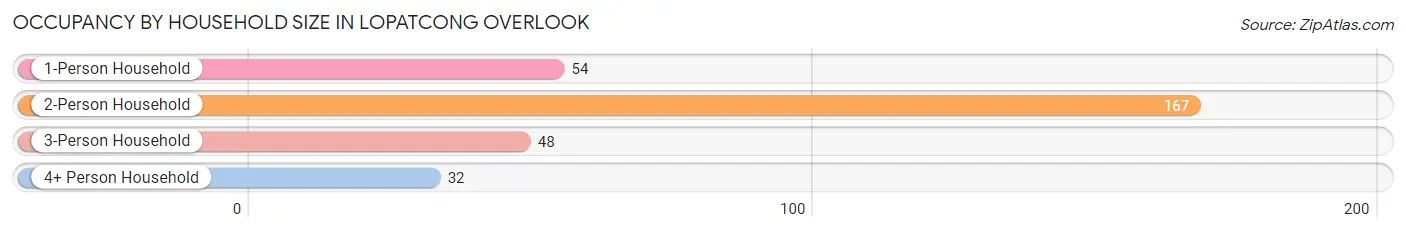
| Household Size | # Housing Units | % Housing Units |
| 1-Person Household | 54 | 17.9% |
| 2-Person Household | 167 | 55.5% |
| 3-Person Household | 48 | 16.0% |
| 4+ Person Household | 32 | 10.6% |
| Total Housing Units | 301 | 100.0% |
Occupancy by Ownership by Household Size in Lopatcong Overlook
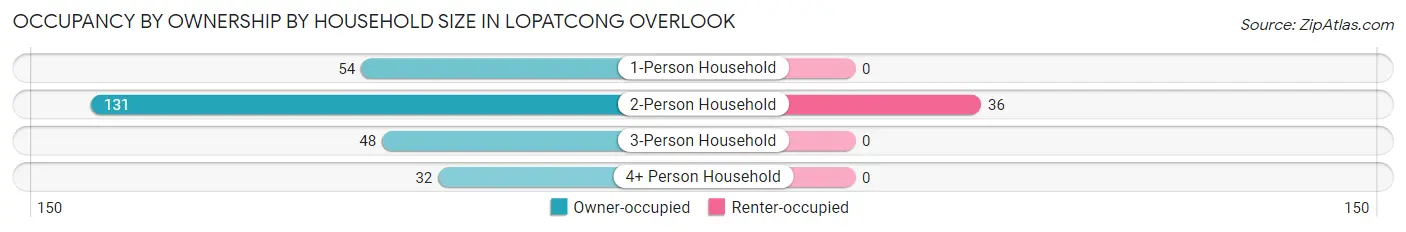
| Household Size | Owner-occupied | Renter-occupied |
| 1-Person Household | 54 (100.0%) | 0 (0.0%) |
| 2-Person Household | 131 (78.4%) | 36 (21.6%) |
| 3-Person Household | 48 (100.0%) | 0 (0.0%) |
| 4+ Person Household | 32 (100.0%) | 0 (0.0%) |
| Total Housing Units | 265 (88.0%) | 36 (12.0%) |
Occupancy by Educational Attainment in Lopatcong Overlook
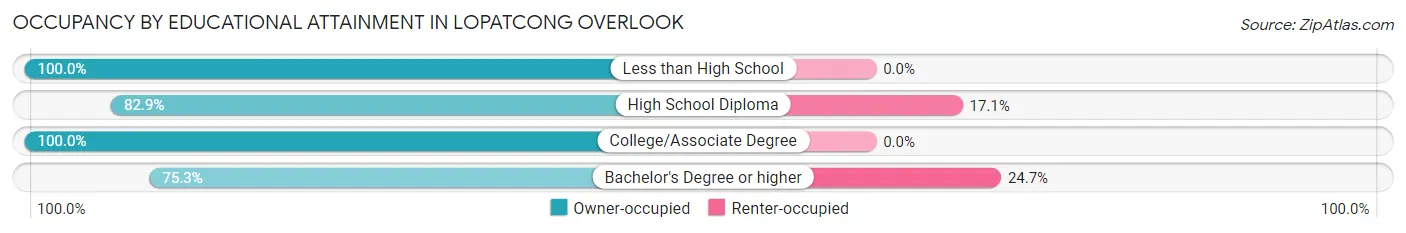
| Household Size | Owner-occupied | Renter-occupied |
| Less than High School | 12 (100.0%) | 0 (0.0%) |
| High School Diploma | 58 (82.9%) | 12 (17.1%) |
| College/Associate Degree | 122 (100.0%) | 0 (0.0%) |
| Bachelor's Degree or higher | 73 (75.3%) | 24 (24.7%) |
Occupancy by Age of Householder in Lopatcong Overlook
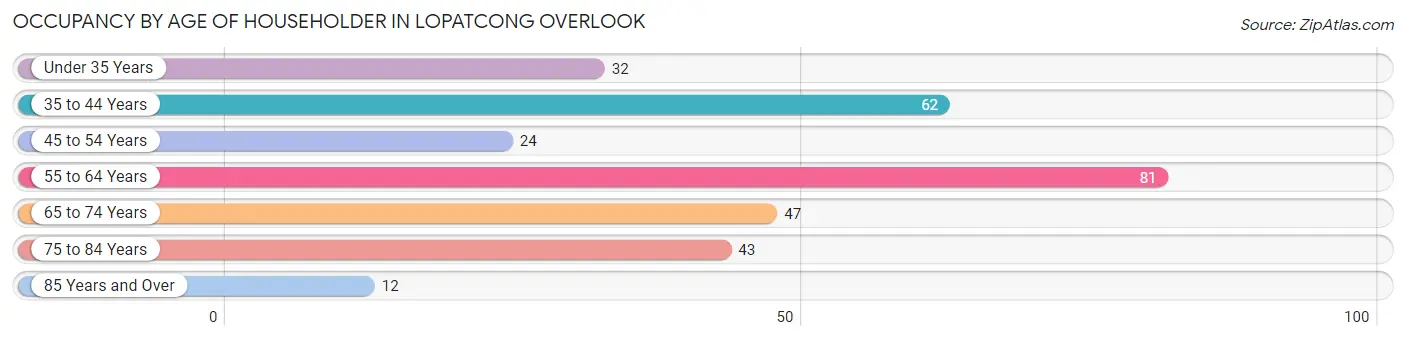
| Age Bracket | # Households | % Households |
| Under 35 Years | 32 | 10.6% |
| 35 to 44 Years | 62 | 20.6% |
| 45 to 54 Years | 24 | 8.0% |
| 55 to 64 Years | 81 | 26.9% |
| 65 to 74 Years | 47 | 15.6% |
| 75 to 84 Years | 43 | 14.3% |
| 85 Years and Over | 12 | 4.0% |
| Total | 301 | 100.0% |
Housing Finances in Lopatcong Overlook
Median Income by Occupancy in Lopatcong Overlook
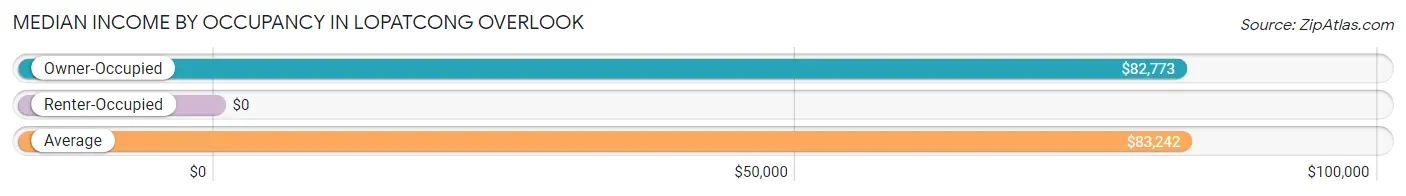
| Occupancy Type | # Households | Median Income |
| Owner-Occupied | 265 (88.0%) | $82,773 |
| Renter-Occupied | 36 (12.0%) | $0 |
| Average | 301 (100.0%) | $83,242 |
Occupancy by Householder Income Bracket in Lopatcong Overlook
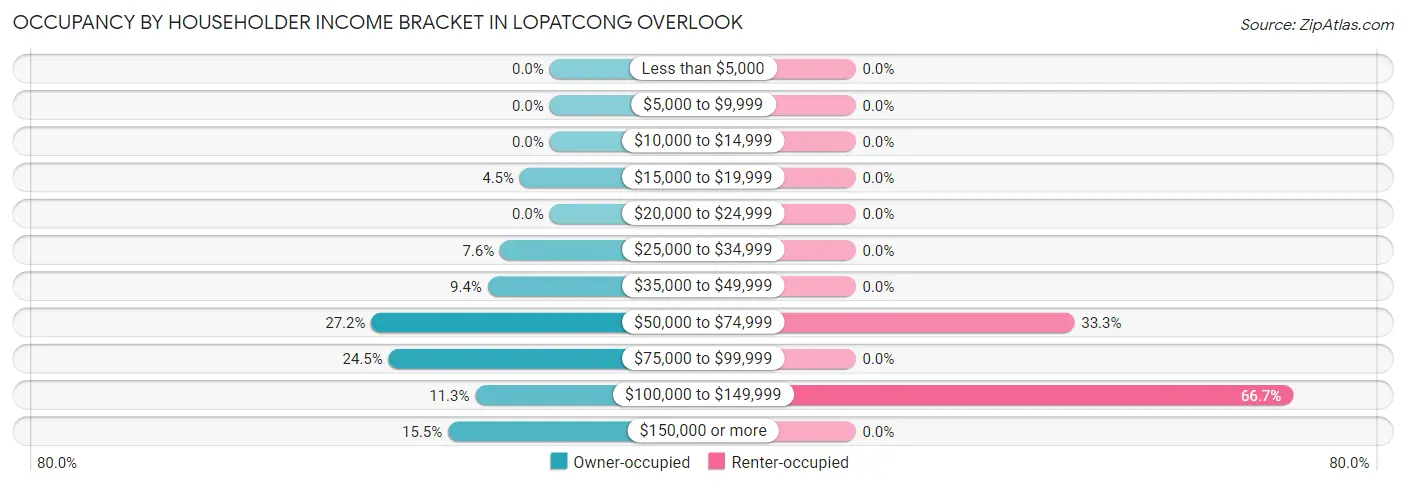
| Income Bracket | Owner-occupied | Renter-occupied |
| Less than $5,000 | 0 (0.0%) | 0 (0.0%) |
| $5,000 to $9,999 | 0 (0.0%) | 0 (0.0%) |
| $10,000 to $14,999 | 0 (0.0%) | 0 (0.0%) |
| $15,000 to $19,999 | 12 (4.5%) | 0 (0.0%) |
| $20,000 to $24,999 | 0 (0.0%) | 0 (0.0%) |
| $25,000 to $34,999 | 20 (7.5%) | 0 (0.0%) |
| $35,000 to $49,999 | 25 (9.4%) | 0 (0.0%) |
| $50,000 to $74,999 | 72 (27.2%) | 12 (33.3%) |
| $75,000 to $99,999 | 65 (24.5%) | 0 (0.0%) |
| $100,000 to $149,999 | 30 (11.3%) | 24 (66.7%) |
| $150,000 or more | 41 (15.5%) | 0 (0.0%) |
| Total | 265 (100.0%) | 36 (100.0%) |
Monthly Housing Cost Tiers in Lopatcong Overlook
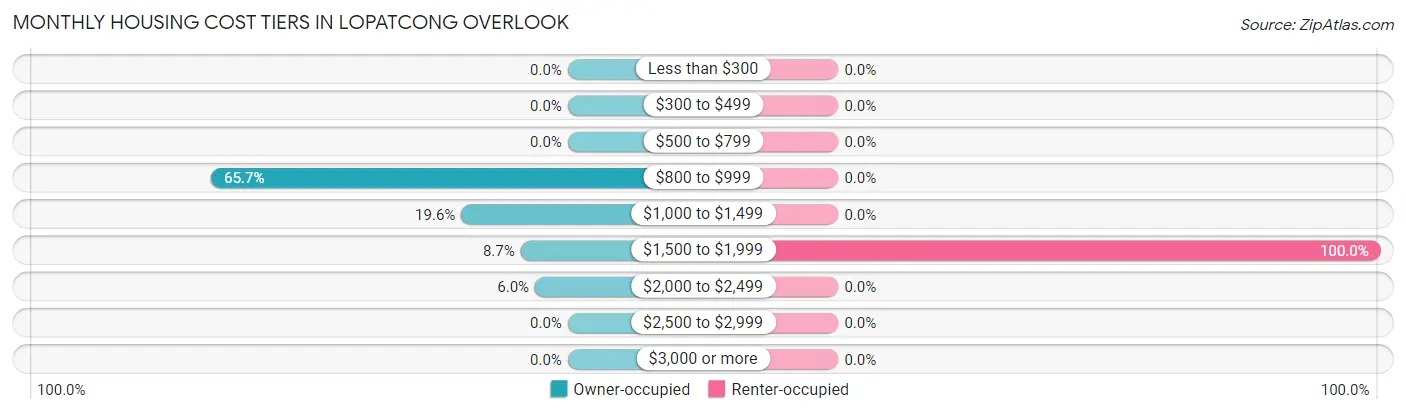
| Monthly Cost | Owner-occupied | Renter-occupied |
| Less than $300 | 0 (0.0%) | 0 (0.0%) |
| $300 to $499 | 0 (0.0%) | 0 (0.0%) |
| $500 to $799 | 0 (0.0%) | 0 (0.0%) |
| $800 to $999 | 174 (65.7%) | 0 (0.0%) |
| $1,000 to $1,499 | 52 (19.6%) | 0 (0.0%) |
| $1,500 to $1,999 | 23 (8.7%) | 36 (100.0%) |
| $2,000 to $2,499 | 16 (6.0%) | 0 (0.0%) |
| $2,500 to $2,999 | 0 (0.0%) | 0 (0.0%) |
| $3,000 or more | 0 (0.0%) | 0 (0.0%) |
| Total | 265 (100.0%) | 36 (100.0%) |
Physical Housing Characteristics in Lopatcong Overlook
Housing Structures in Lopatcong Overlook
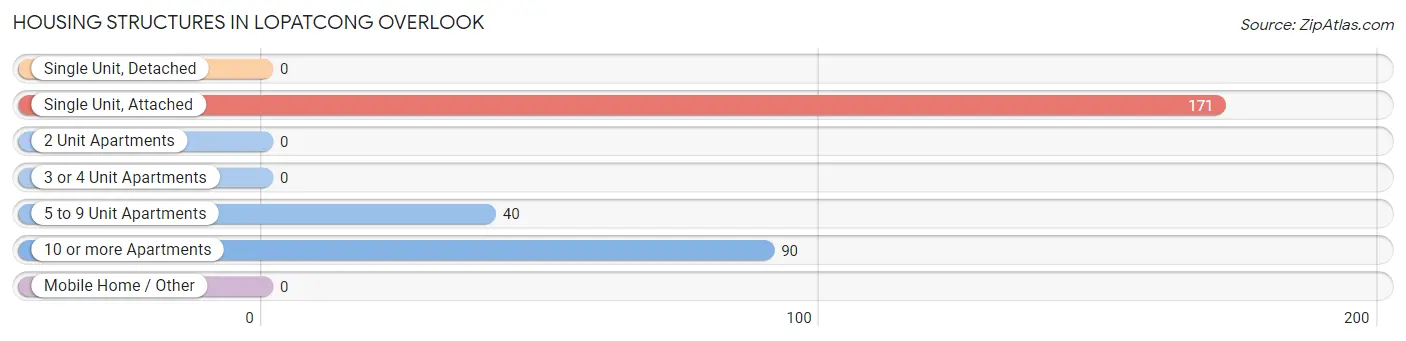
| Structure Type | # Housing Units | % Housing Units |
| Single Unit, Detached | 0 | 0.0% |
| Single Unit, Attached | 171 | 56.8% |
| 2 Unit Apartments | 0 | 0.0% |
| 3 or 4 Unit Apartments | 0 | 0.0% |
| 5 to 9 Unit Apartments | 40 | 13.3% |
| 10 or more Apartments | 90 | 29.9% |
| Mobile Home / Other | 0 | 0.0% |
| Total | 301 | 100.0% |
Housing Structures by Occupancy in Lopatcong Overlook
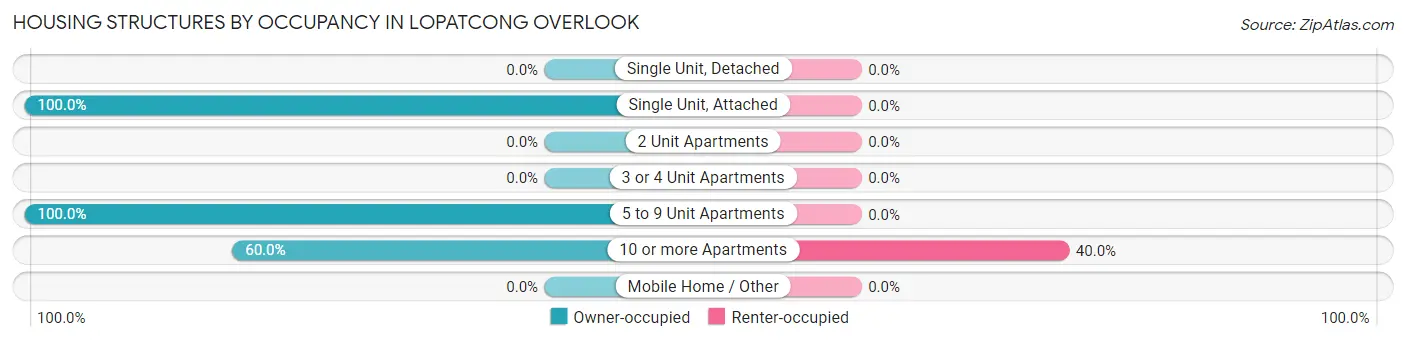
| Structure Type | Owner-occupied | Renter-occupied |
| Single Unit, Detached | 0 (0.0%) | 0 (0.0%) |
| Single Unit, Attached | 171 (100.0%) | 0 (0.0%) |
| 2 Unit Apartments | 0 (0.0%) | 0 (0.0%) |
| 3 or 4 Unit Apartments | 0 (0.0%) | 0 (0.0%) |
| 5 to 9 Unit Apartments | 40 (100.0%) | 0 (0.0%) |
| 10 or more Apartments | 54 (60.0%) | 36 (40.0%) |
| Mobile Home / Other | 0 (0.0%) | 0 (0.0%) |
| Total | 265 (88.0%) | 36 (12.0%) |
Housing Structures by Number of Rooms in Lopatcong Overlook
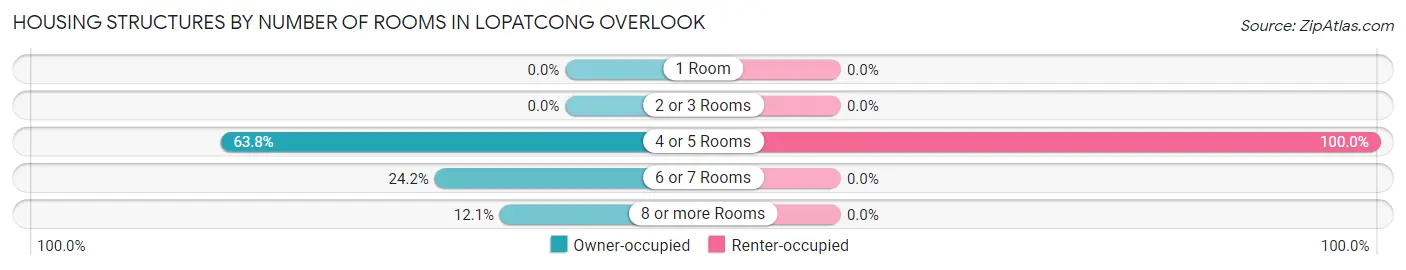
| Number of Rooms | Owner-occupied | Renter-occupied |
| 1 Room | 0 (0.0%) | 0 (0.0%) |
| 2 or 3 Rooms | 0 (0.0%) | 0 (0.0%) |
| 4 or 5 Rooms | 169 (63.8%) | 36 (100.0%) |
| 6 or 7 Rooms | 64 (24.1%) | 0 (0.0%) |
| 8 or more Rooms | 32 (12.1%) | 0 (0.0%) |
| Total | 265 (100.0%) | 36 (100.0%) |
Housing Structure by Heating Type in Lopatcong Overlook
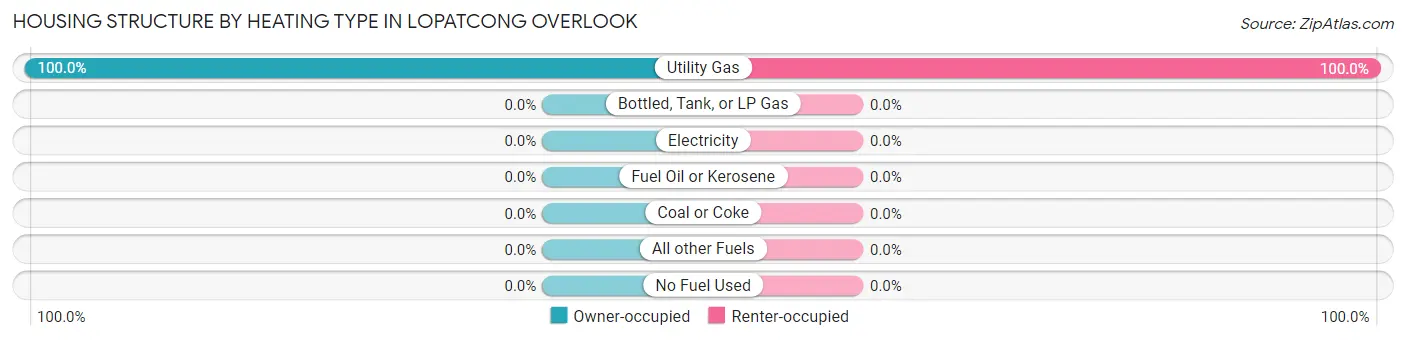
| Heating Type | Owner-occupied | Renter-occupied |
| Utility Gas | 265 (100.0%) | 36 (100.0%) |
| Bottled, Tank, or LP Gas | 0 (0.0%) | 0 (0.0%) |
| Electricity | 0 (0.0%) | 0 (0.0%) |
| Fuel Oil or Kerosene | 0 (0.0%) | 0 (0.0%) |
| Coal or Coke | 0 (0.0%) | 0 (0.0%) |
| All other Fuels | 0 (0.0%) | 0 (0.0%) |
| No Fuel Used | 0 (0.0%) | 0 (0.0%) |
| Total | 265 (100.0%) | 36 (100.0%) |
Household Vehicle Usage in Lopatcong Overlook
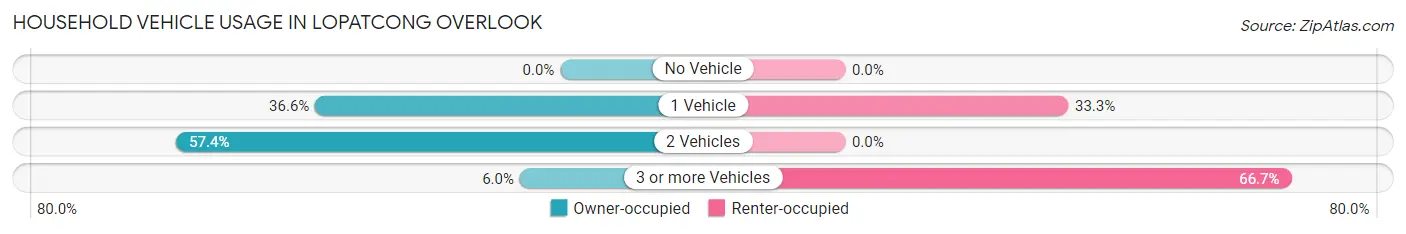
| Vehicles per Household | Owner-occupied | Renter-occupied |
| No Vehicle | 0 (0.0%) | 0 (0.0%) |
| 1 Vehicle | 97 (36.6%) | 12 (33.3%) |
| 2 Vehicles | 152 (57.4%) | 0 (0.0%) |
| 3 or more Vehicles | 16 (6.0%) | 24 (66.7%) |
| Total | 265 (100.0%) | 36 (100.0%) |
Real Estate & Mortgages in Lopatcong Overlook
Real Estate and Mortgage Overview in Lopatcong Overlook
| Characteristic | Without Mortgage | With Mortgage |
| Housing Units | 184 | 81 |
| Median Property Value | $204,000 | $164,500 |
| Median Household Income | $69,688 | $16 |
| Monthly Housing Costs | $950 | $0 |
| Real Estate Taxes | $5,847 | $0 |
Property Value by Mortgage Status in Lopatcong Overlook
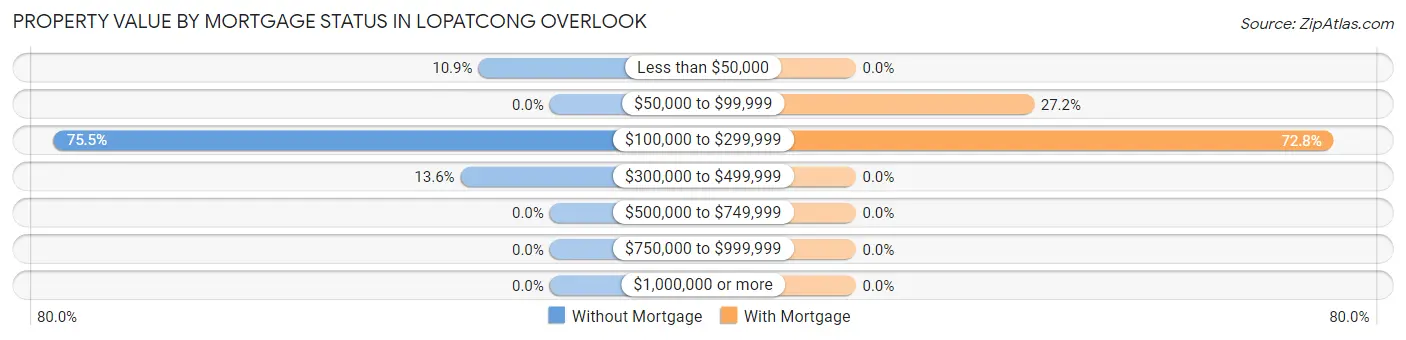
| Property Value | Without Mortgage | With Mortgage |
| Less than $50,000 | 20 (10.9%) | 0 (0.0%) |
| $50,000 to $99,999 | 0 (0.0%) | 22 (27.2%) |
| $100,000 to $299,999 | 139 (75.5%) | 59 (72.8%) |
| $300,000 to $499,999 | 25 (13.6%) | 0 (0.0%) |
| $500,000 to $749,999 | 0 (0.0%) | 0 (0.0%) |
| $750,000 to $999,999 | 0 (0.0%) | 0 (0.0%) |
| $1,000,000 or more | 0 (0.0%) | 0 (0.0%) |
| Total | 184 (100.0%) | 81 (100.0%) |
Household Income by Mortgage Status in Lopatcong Overlook
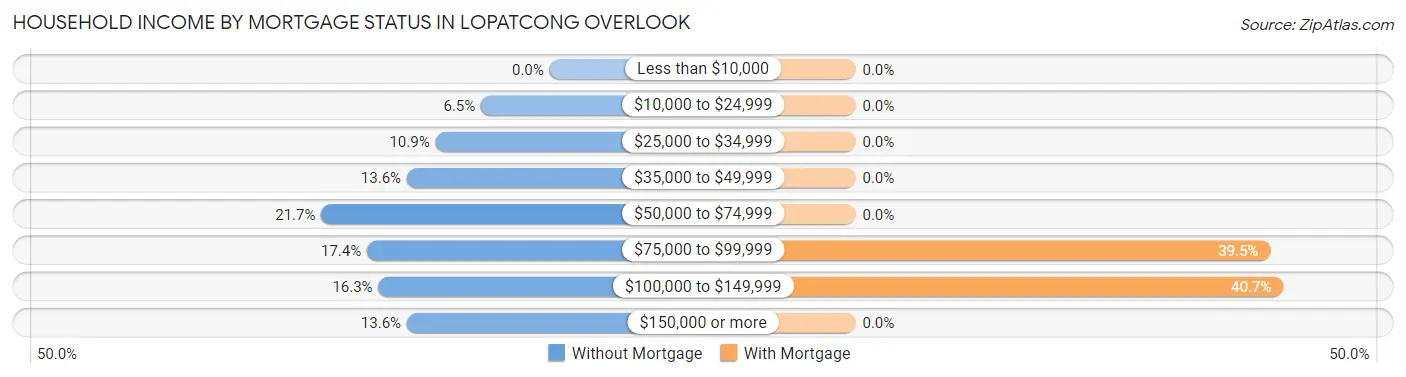
| Household Income | Without Mortgage | With Mortgage |
| Less than $10,000 | 0 (0.0%) | 0 (0.0%) |
| $10,000 to $24,999 | 12 (6.5%) | 0 (0.0%) |
| $25,000 to $34,999 | 20 (10.9%) | 0 (0.0%) |
| $35,000 to $49,999 | 25 (13.6%) | 0 (0.0%) |
| $50,000 to $74,999 | 40 (21.7%) | 0 (0.0%) |
| $75,000 to $99,999 | 32 (17.4%) | 32 (39.5%) |
| $100,000 to $149,999 | 30 (16.3%) | 33 (40.7%) |
| $150,000 or more | 25 (13.6%) | 0 (0.0%) |
| Total | 184 (100.0%) | 81 (100.0%) |
Property Value to Household Income Ratio in Lopatcong Overlook
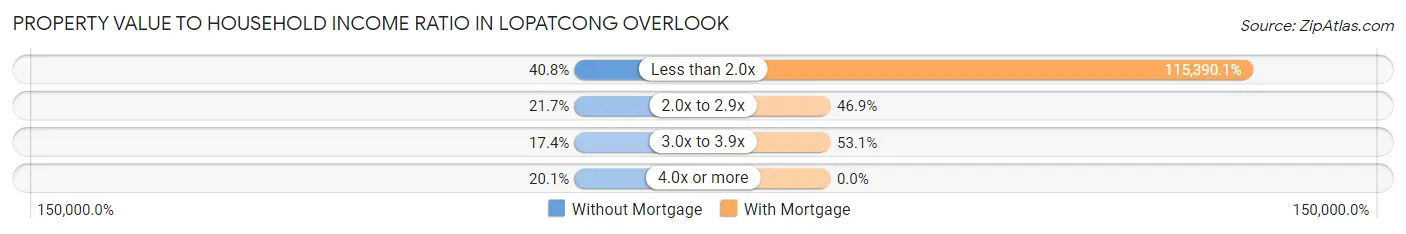
| Value-to-Income Ratio | Without Mortgage | With Mortgage |
| Less than 2.0x | 75 (40.8%) | 93,466 (115,390.1%) |
| 2.0x to 2.9x | 40 (21.7%) | 38 (46.9%) |
| 3.0x to 3.9x | 32 (17.4%) | 43 (53.1%) |
| 4.0x or more | 37 (20.1%) | 0 (0.0%) |
| Total | 184 (100.0%) | 81 (100.0%) |
Real Estate Taxes by Mortgage Status in Lopatcong Overlook
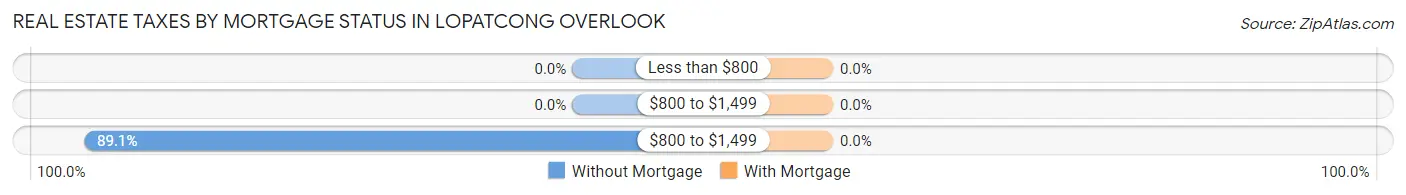
| Property Taxes | Without Mortgage | With Mortgage |
| Less than $800 | 0 (0.0%) | 0 (0.0%) |
| $800 to $1,499 | 0 (0.0%) | 0 (0.0%) |
| $800 to $1,499 | 164 (89.1%) | 0 (0.0%) |
| Total | 184 (100.0%) | 81 (100.0%) |
Health & Disability in Lopatcong Overlook
Health Insurance Coverage by Age in Lopatcong Overlook
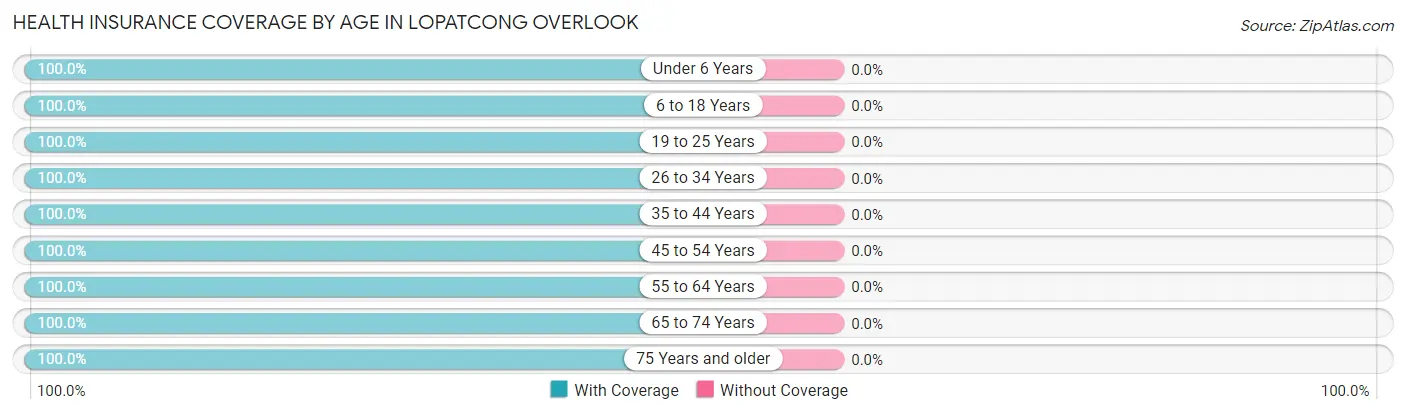
| Age Bracket | With Coverage | Without Coverage |
| Under 6 Years | 82 (100.0%) | 0 (0.0%) |
| 6 to 18 Years | 69 (100.0%) | 0 (0.0%) |
| 19 to 25 Years | 64 (100.0%) | 0 (0.0%) |
| 26 to 34 Years | 66 (100.0%) | 0 (0.0%) |
| 35 to 44 Years | 87 (100.0%) | 0 (0.0%) |
| 45 to 54 Years | 24 (100.0%) | 0 (0.0%) |
| 55 to 64 Years | 157 (100.0%) | 0 (0.0%) |
| 65 to 74 Years | 89 (100.0%) | 0 (0.0%) |
| 75 Years and older | 80 (100.0%) | 0 (0.0%) |
| Total | 718 (100.0%) | 0 (0.0%) |
Health Insurance Coverage by Citizenship Status in Lopatcong Overlook
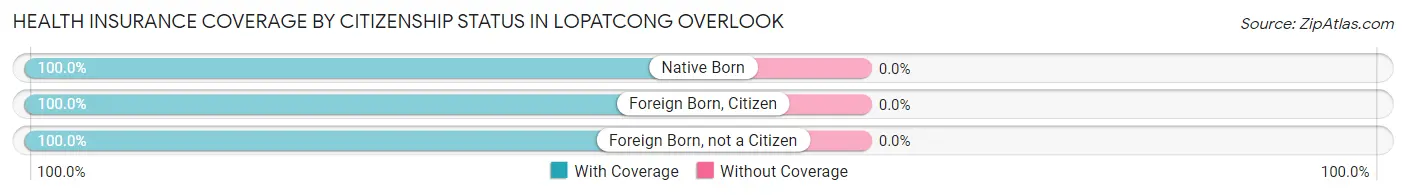
| Citizenship Status | With Coverage | Without Coverage |
| Native Born | 82 (100.0%) | 0 (0.0%) |
| Foreign Born, Citizen | 69 (100.0%) | 0 (0.0%) |
| Foreign Born, not a Citizen | 64 (100.0%) | 0 (0.0%) |
Health Insurance Coverage by Household Income in Lopatcong Overlook
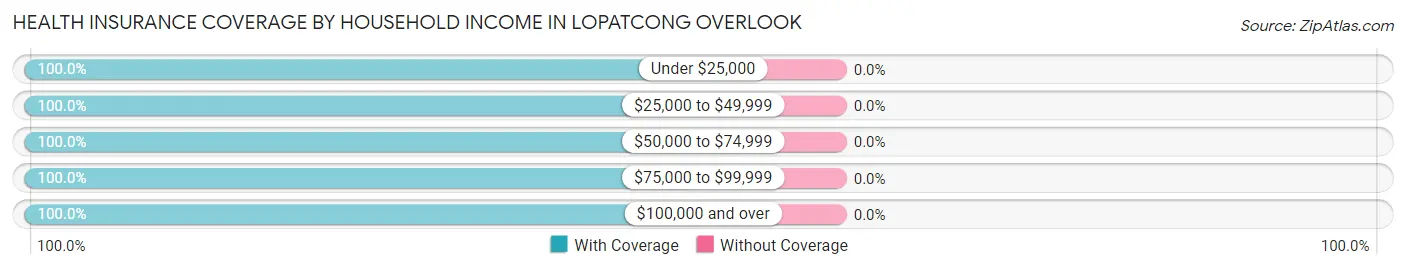
| Household Income | With Coverage | Without Coverage |
| Under $25,000 | 12 (100.0%) | 0 (0.0%) |
| $25,000 to $49,999 | 67 (100.0%) | 0 (0.0%) |
| $50,000 to $74,999 | 255 (100.0%) | 0 (0.0%) |
| $75,000 to $99,999 | 146 (100.0%) | 0 (0.0%) |
| $100,000 and over | 238 (100.0%) | 0 (0.0%) |
Public vs Private Health Insurance Coverage by Age in Lopatcong Overlook
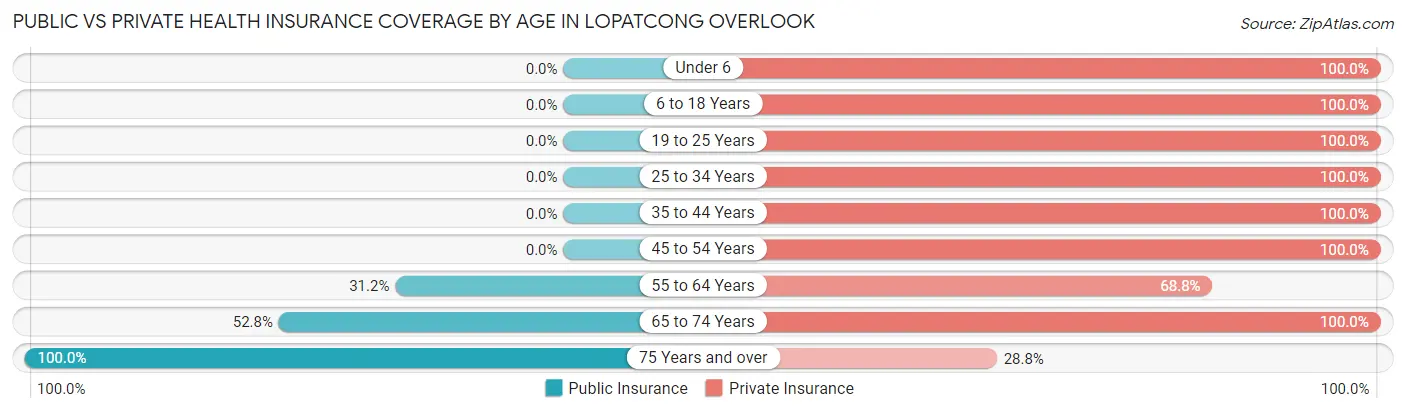
| Age Bracket | Public Insurance | Private Insurance |
| Under 6 | 0 (0.0%) | 82 (100.0%) |
| 6 to 18 Years | 0 (0.0%) | 69 (100.0%) |
| 19 to 25 Years | 0 (0.0%) | 64 (100.0%) |
| 25 to 34 Years | 0 (0.0%) | 66 (100.0%) |
| 35 to 44 Years | 0 (0.0%) | 87 (100.0%) |
| 45 to 54 Years | 0 (0.0%) | 24 (100.0%) |
| 55 to 64 Years | 49 (31.2%) | 108 (68.8%) |
| 65 to 74 Years | 47 (52.8%) | 89 (100.0%) |
| 75 Years and over | 80 (100.0%) | 23 (28.7%) |
| Total | 176 (24.5%) | 612 (85.2%) |
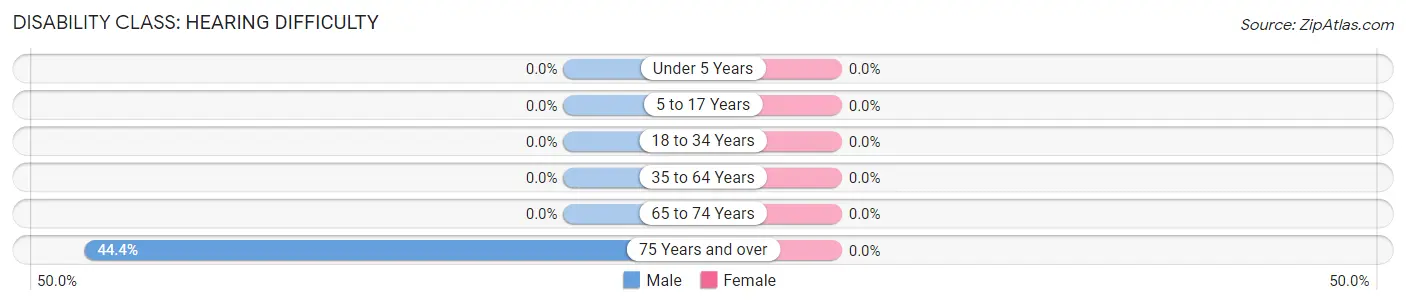
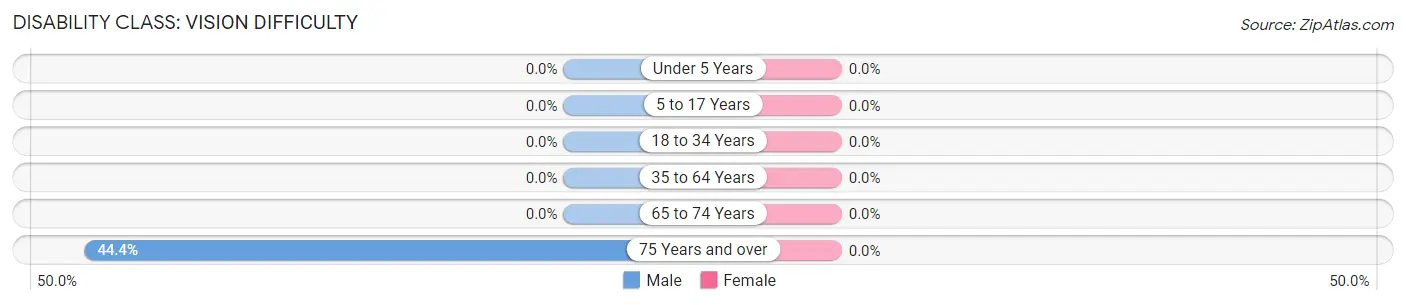
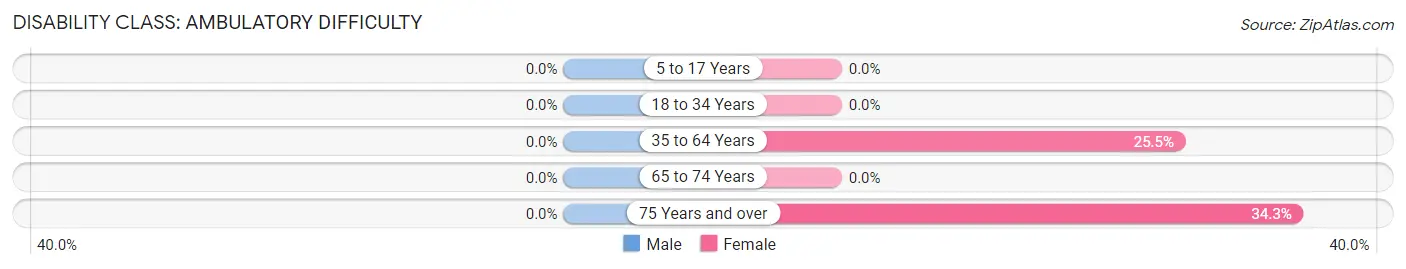
Disability Status by Sex by Age in Lopatcong Overlook
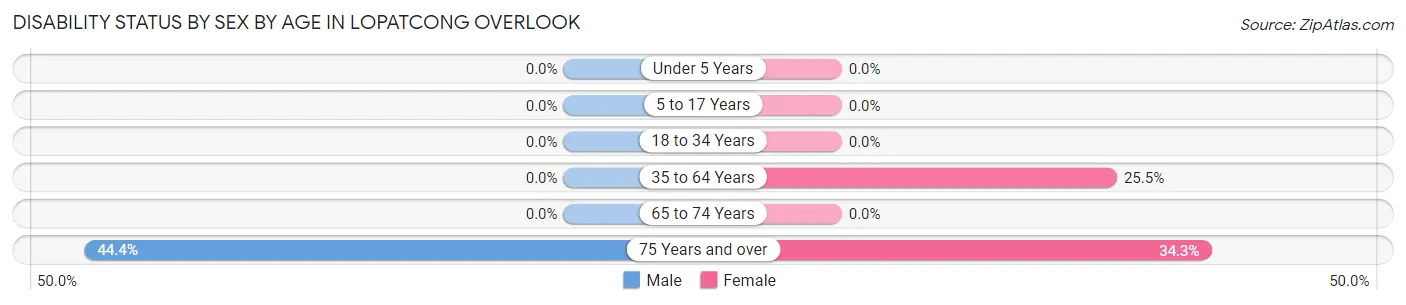
| Age Bracket | Male | Female |
| Under 5 Years | 0 (0.0%) | 0 (0.0%) |
| 5 to 17 Years | 0 (0.0%) | 0 (0.0%) |
| 18 to 34 Years | 0 (0.0%) | 0 (0.0%) |
| 35 to 64 Years | 0 (0.0%) | 47 (25.5%) |
| 65 to 74 Years | 0 (0.0%) | 0 (0.0%) |
| 75 Years and over | 20 (44.4%) | 12 (34.3%) |
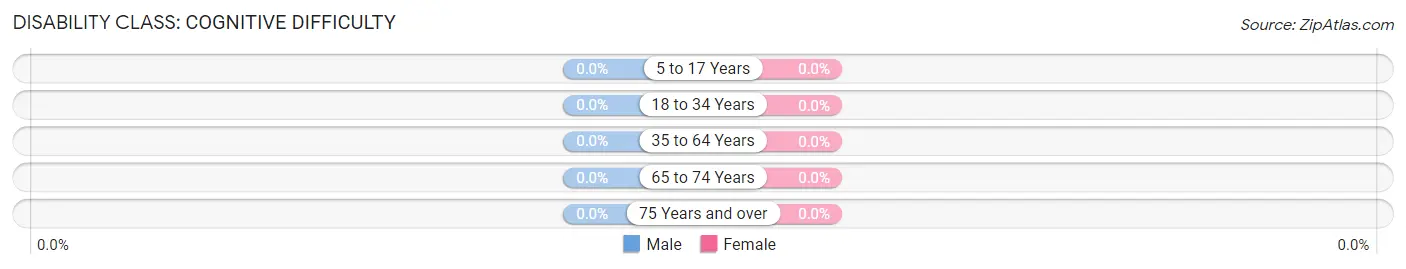
Disability Class by Sex by Age in Lopatcong Overlook
Disability Class: Hearing Difficulty
| Age Bracket | Male | Female |
| Under 5 Years | 0 (0.0%) | 0 (0.0%) |
| 5 to 17 Years | 0 (0.0%) | 0 (0.0%) |
| 18 to 34 Years | 0 (0.0%) | 0 (0.0%) |
| 35 to 64 Years | 0 (0.0%) | 0 (0.0%) |
| 65 to 74 Years | 0 (0.0%) | 0 (0.0%) |
| 75 Years and over | 20 (44.4%) | 0 (0.0%) |
Disability Class: Vision Difficulty
| Age Bracket | Male | Female |
| Under 5 Years | 0 (0.0%) | 0 (0.0%) |
| 5 to 17 Years | 0 (0.0%) | 0 (0.0%) |
| 18 to 34 Years | 0 (0.0%) | 0 (0.0%) |
| 35 to 64 Years | 0 (0.0%) | 0 (0.0%) |
| 65 to 74 Years | 0 (0.0%) | 0 (0.0%) |
| 75 Years and over | 20 (44.4%) | 0 (0.0%) |
Disability Class: Cognitive Difficulty
| Age Bracket | Male | Female |
| 5 to 17 Years | 0 (0.0%) | 0 (0.0%) |
| 18 to 34 Years | 0 (0.0%) | 0 (0.0%) |
| 35 to 64 Years | 0 (0.0%) | 0 (0.0%) |
| 65 to 74 Years | 0 (0.0%) | 0 (0.0%) |
| 75 Years and over | 0 (0.0%) | 0 (0.0%) |
Disability Class: Ambulatory Difficulty
| Age Bracket | Male | Female |
| 5 to 17 Years | 0 (0.0%) | 0 (0.0%) |
| 18 to 34 Years | 0 (0.0%) | 0 (0.0%) |
| 35 to 64 Years | 0 (0.0%) | 47 (25.5%) |
| 65 to 74 Years | 0 (0.0%) | 0 (0.0%) |
| 75 Years and over | 0 (0.0%) | 12 (34.3%) |
Disability Class: Self-Care Difficulty
| Age Bracket | Male | Female |
| 5 to 17 Years | 0 (0.0%) | 0 (0.0%) |
| 18 to 34 Years | 0 (0.0%) | 0 (0.0%) |
| 35 to 64 Years | 0 (0.0%) | 0 (0.0%) |
| 65 to 74 Years | 0 (0.0%) | 0 (0.0%) |
| 75 Years and over | 0 (0.0%) | 0 (0.0%) |
Technology Access in Lopatcong Overlook
Computing Device Access in Lopatcong Overlook
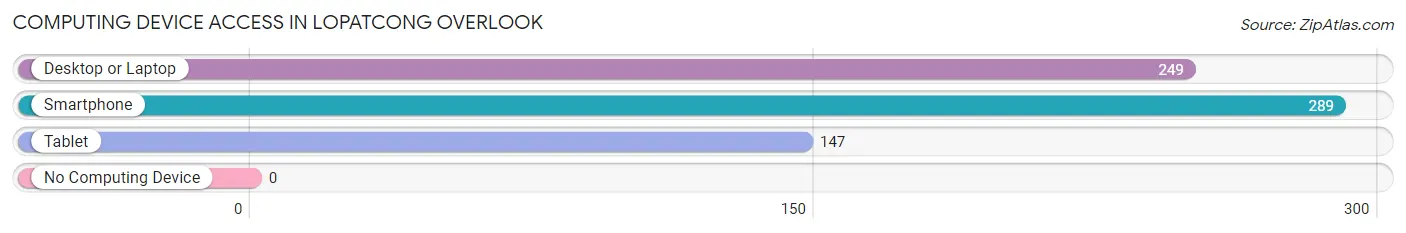
| Device Type | # Households | % Households |
| Desktop or Laptop | 249 | 82.7% |
| Smartphone | 289 | 96.0% |
| Tablet | 147 | 48.8% |
| No Computing Device | 0 | 0.0% |
| Total | 301 | 100.0% |
Internet Access in Lopatcong Overlook
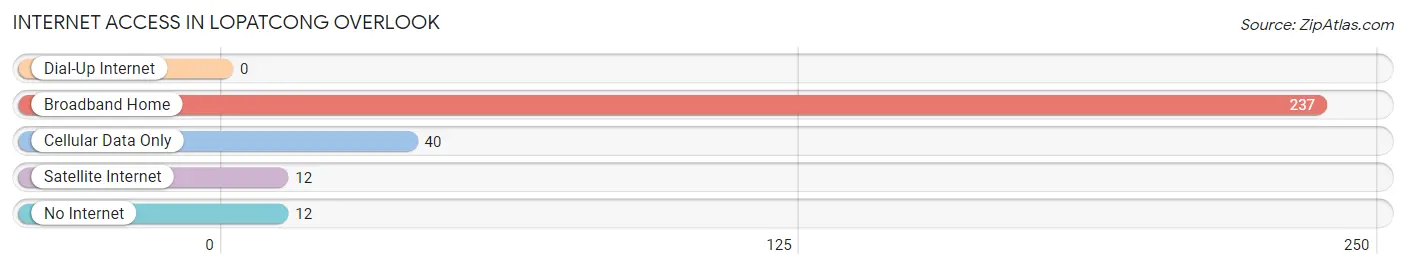
| Internet Type | # Households | % Households |
| Dial-Up Internet | 0 | 0.0% |
| Broadband Home | 237 | 78.7% |
| Cellular Data Only | 40 | 13.3% |
| Satellite Internet | 12 | 4.0% |
| No Internet | 12 | 4.0% |
| Total | 301 | 100.0% |
Lopatcong Overlook Summary
Lopatcong Overlook is a small borough located in Warren County, New Jersey. It is situated on the banks of the Delaware River, just south of Phillipsburg. The borough was incorporated in 1922 and has a population of 1,845 as of the 2010 census.
Geography
Lopatcong Overlook is located at 40°45'17" North, 75°10'17" West (40.754722, -75.171389). It is bordered by the Delaware River to the east, the borough of Phillipsburg to the north, and the borough of Alpha to the south. The borough has a total area of 0.7 square miles, all of which is land.
History
The area that is now Lopatcong Overlook was originally inhabited by the Lenape Native Americans. The first European settlers arrived in the area in the late 17th century. The area was part of Phillipsburg until 1922, when it was incorporated as the borough of Lopatcong Overlook. The name of the borough is derived from the Lenape word for “place of many hills”.
Economy
The economy of Lopatcong Overlook is largely based on the service industry. The borough is home to several small businesses, including restaurants, retail stores, and professional services. The borough also has a small manufacturing sector, with several small factories located in the area.
Demographics
As of the 2010 census, the population of Lopatcong Overlook was 1,845. The racial makeup of the borough was 94.2% White, 2.2% African American, 0.3% Native American, 0.7% Asian, 0.1% Pacific Islander, 1.2% from other races, and 1.4% from two or more races. Hispanic or Latino of any race were 4.2% of the population.
The median income for a household in the borough was $50,938, and the median income for a family was $60,000. The per capita income for the borough was $25,938. About 6.2% of families and 8.2% of the population were below the poverty line, including 11.2% of those under age 18 and 5.2% of those age 65 or over.
Conclusion
Lopatcong Overlook is a small borough located in Warren County, New Jersey. It is situated on the banks of the Delaware River, just south of Phillipsburg. The borough was incorporated in 1922 and has a population of 1,845 as of the 2010 census. The economy of Lopatcong Overlook is largely based on the service industry, with a small manufacturing sector as well. The racial makeup of the borough is 94.2% White, 2.2% African American, 0.3% Native American, 0.7% Asian, 0.1% Pacific Islander, 1.2% from other races, and 1.4% from two or more races. The median income for a household in the borough was $50,938, and the median income for a family was $60,000. The per capita income for the borough was $25,938.
Common Questions
What is Per Capita Income in Lopatcong Overlook?
Per Capita income in Lopatcong Overlook is $40,871.
What is the Median Family Income in Lopatcong Overlook?
Median Family Income in Lopatcong Overlook is $84,609.
What is the Median Household income in Lopatcong Overlook?
Median Household Income in Lopatcong Overlook is $83,242.
What is Income or Wage Gap in Lopatcong Overlook?
Income or Wage Gap in Lopatcong Overlook is 38.0%.
Women in Lopatcong Overlook earn 62.0 cents for every dollar earned by a man.
What is Inequality or Gini Index in Lopatcong Overlook?
Inequality or Gini Index in Lopatcong Overlook is 0.29.
What is the Total Population of Lopatcong Overlook?
Total Population of Lopatcong Overlook is 718.
What is the Total Male Population of Lopatcong Overlook?
Total Male Population of Lopatcong Overlook is 351.
What is the Total Female Population of Lopatcong Overlook?
Total Female Population of Lopatcong Overlook is 367.
What is the Ratio of Males per 100 Females in Lopatcong Overlook?
There are 95.64 Males per 100 Females in Lopatcong Overlook.
What is the Ratio of Females per 100 Males in Lopatcong Overlook?
There are 104.56 Females per 100 Males in Lopatcong Overlook.
What is the Median Population Age in Lopatcong Overlook?
Median Population Age in Lopatcong Overlook is 42.7 Years.
What is the Average Family Size in Lopatcong Overlook
Average Family Size in Lopatcong Overlook is 2.8 People.
What is the Average Household Size in Lopatcong Overlook
Average Household Size in Lopatcong Overlook is 2.4 People.
How Large is the Labor Force in Lopatcong Overlook?
There are 423 People in the Labor Forcein in Lopatcong Overlook.
What is the Percentage of People in the Labor Force in Lopatcong Overlook?
74.6% of People are in the Labor Force in Lopatcong Overlook.