Zip Codes with the Highest Percentage of Population with a Degree in Visual and Performing Arts in Vineland, NJ
RELATED REPORTS & OPTIONS
Visual and Performing Arts
Vineland
Compare Zip Codes
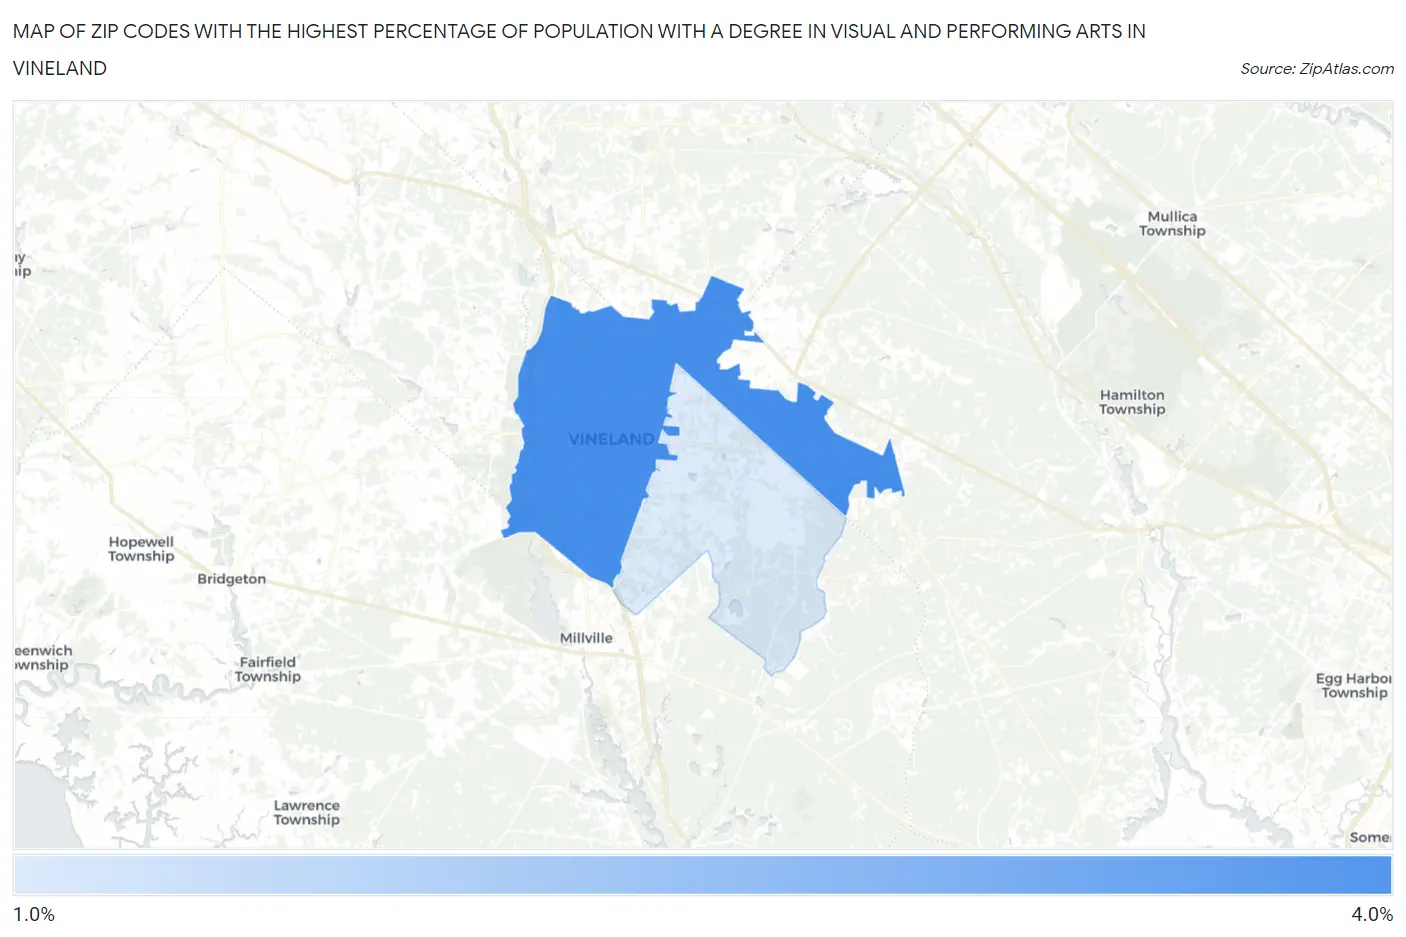
Map of Zip Codes with the Highest Percentage of Population with a Degree in Visual and Performing Arts in Vineland
1.5%
3.8%
Zip Codes with the Highest Percentage of Population with a Degree in Visual and Performing Arts in Vineland, NJ
| Zip Code | % Graduates | vs State | vs National | |
| 1. | 08360 | 3.8% | 4.0%(-0.270)#242 | 4.3%(-0.474)#9,917 |
| 2. | 08361 | 1.5% | 4.0%(-2.57)#495 | 4.3%(-2.77)#18,232 |
1
Common Questions
What are the Top Zip Codes with the Highest Percentage of Population with a Degree in Visual and Performing Arts in Vineland, NJ?
Top Zip Codes with the Highest Percentage of Population with a Degree in Visual and Performing Arts in Vineland, NJ are:
What zip code has the Highest Percentage of Population with a Degree in Visual and Performing Arts in Vineland, NJ?
08360 has the Highest Percentage of Population with a Degree in Visual and Performing Arts in Vineland, NJ with 3.8%.
What is the Percentage of Population with a Degree in Visual and Performing Arts in Vineland, NJ?
Percentage of Population with a Degree in Visual and Performing Arts in Vineland is 2.7%.
What is the Percentage of Population with a Degree in Visual and Performing Arts in New Jersey?
Percentage of Population with a Degree in Visual and Performing Arts in New Jersey is 4.0%.
What is the Percentage of Population with a Degree in Visual and Performing Arts in the United States?
Percentage of Population with a Degree in Visual and Performing Arts in the United States is 4.3%.