Zip Codes with the Highest Percentage of Population with a Degree in Visual and Performing Arts in Paterson, NJ
RELATED REPORTS & OPTIONS
Visual and Performing Arts
Paterson
Compare Zip Codes
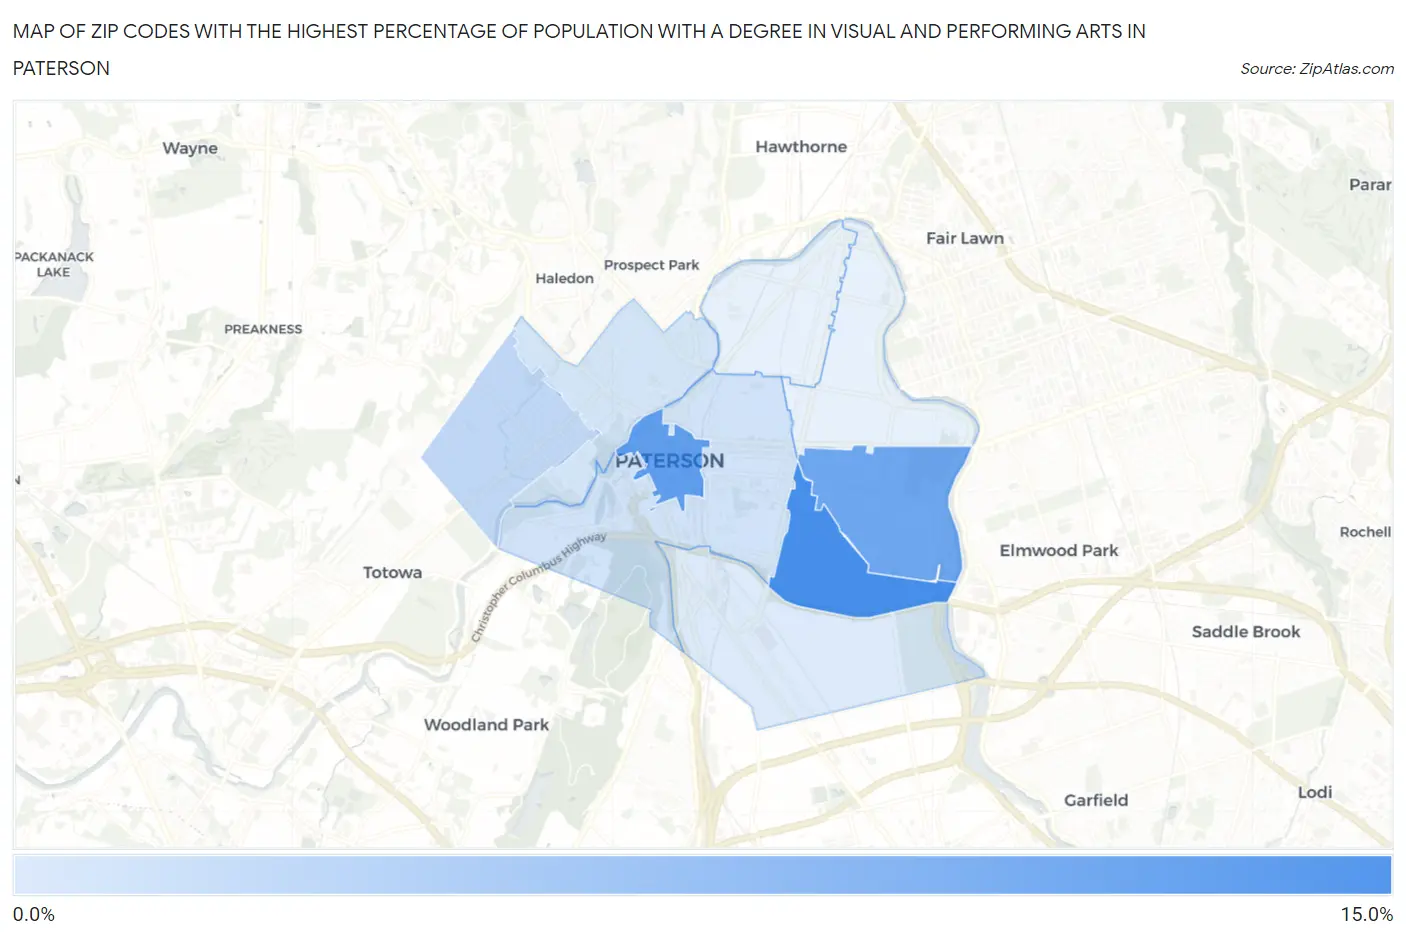
Map of Zip Codes with the Highest Percentage of Population with a Degree in Visual and Performing Arts in Paterson
0.46%
11.3%
Zip Codes with the Highest Percentage of Population with a Degree in Visual and Performing Arts in Paterson, NJ
| Zip Code | % Graduates | vs State | vs National | |
| 1. | 07513 | 11.3% | 4.0%(+7.21)#15 | 4.3%(+7.00)#1,452 |
| 2. | 07505 | 9.3% | 4.0%(+5.29)#26 | 4.3%(+5.08)#2,088 |
| 3. | 07504 | 8.4% | 4.0%(+4.34)#33 | 4.3%(+4.14)#2,605 |
| 4. | 07502 | 2.4% | 4.0%(-1.63)#416 | 4.3%(-1.83)#14,941 |
| 5. | 07501 | 1.3% | 4.0%(-2.76)#500 | 4.3%(-2.96)#18,805 |
| 6. | 07522 | 0.93% | 4.0%(-3.11)#511 | 4.3%(-3.32)#19,853 |
| 7. | 07503 | 0.46% | 4.0%(-3.59)#521 | 4.3%(-3.79)#20,860 |
1
Common Questions
What are the Top 5 Zip Codes with the Highest Percentage of Population with a Degree in Visual and Performing Arts in Paterson, NJ?
Top 5 Zip Codes with the Highest Percentage of Population with a Degree in Visual and Performing Arts in Paterson, NJ are:
What zip code has the Highest Percentage of Population with a Degree in Visual and Performing Arts in Paterson, NJ?
07513 has the Highest Percentage of Population with a Degree in Visual and Performing Arts in Paterson, NJ with 11.3%.
What is the Percentage of Population with a Degree in Visual and Performing Arts in Paterson, NJ?
Percentage of Population with a Degree in Visual and Performing Arts in Paterson is 3.0%.
What is the Percentage of Population with a Degree in Visual and Performing Arts in New Jersey?
Percentage of Population with a Degree in Visual and Performing Arts in New Jersey is 4.0%.
What is the Percentage of Population with a Degree in Visual and Performing Arts in the United States?
Percentage of Population with a Degree in Visual and Performing Arts in the United States is 4.3%.