High Bridge borough, NJ Map & Demographics
High Bridge borough Overview
$47,457
PER CAPITA INCOME
$122,431
AVG FAMILY INCOME
$106,111
AVG HOUSEHOLD INCOME
11.0%
WAGE / INCOME GAP [ % ]
89.0¢/ $1
WAGE / INCOME GAP [ $ ]
0.38
INEQUALITY / GINI INDEX
3,564
TOTAL POPULATION
1,860
MALE POPULATION
1,704
FEMALE POPULATION
109.15
MALES / 100 FEMALES
91.61
FEMALES / 100 MALES
40.0
MEDIAN AGE
3.0
AVG FAMILY SIZE
2.5
AVG HOUSEHOLD SIZE
1,969
LABOR FORCE [ PEOPLE ]
66.3%
PERCENT IN LABOR FORCE
6.0%
UNEMPLOYMENT RATE
Income in High Bridge borough
Income Overview in High Bridge borough
Per Capita Income in High Bridge borough is $47,457, while median incomes of families and households are $122,431 and $106,111 respectively.
| Characteristic | Number | Measure |
| Per Capita Income | 3,564 | $47,457 |
| Median Family Income | 1,003 | $122,431 |
| Mean Family Income | 1,003 | $135,035 |
| Median Household Income | 1,436 | $106,111 |
| Mean Household Income | 1,436 | $119,946 |
| Income Deficit | 1,003 | $0 |
| Wage / Income Gap (%) | 3,564 | 11.04% |
| Wage / Income Gap ($) | 3,564 | 88.96¢ per $1 |
| Gini / Inequality Index | 3,564 | 0.38 |
Earnings by Sex in High Bridge borough
Average Earnings in High Bridge borough are $58,054, $58,488 for men and $52,031 for women, a difference of 11.0%.
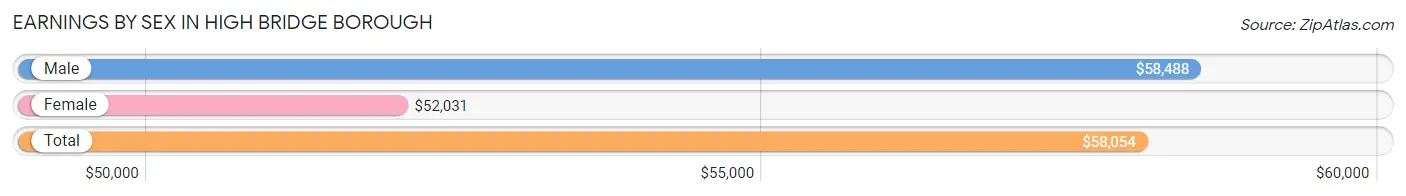
| Sex | Number | Average Earnings |
| Male | 1,082 (53.2%) | $58,488 |
| Female | 951 (46.8%) | $52,031 |
| Total | 2,033 (100.0%) | $58,054 |
Earnings by Sex by Income Bracket in High Bridge borough
The most common earnings brackets in High Bridge borough are $100,000+ for men (272 | 25.1%) and $100,000+ for women (207 | 21.8%).
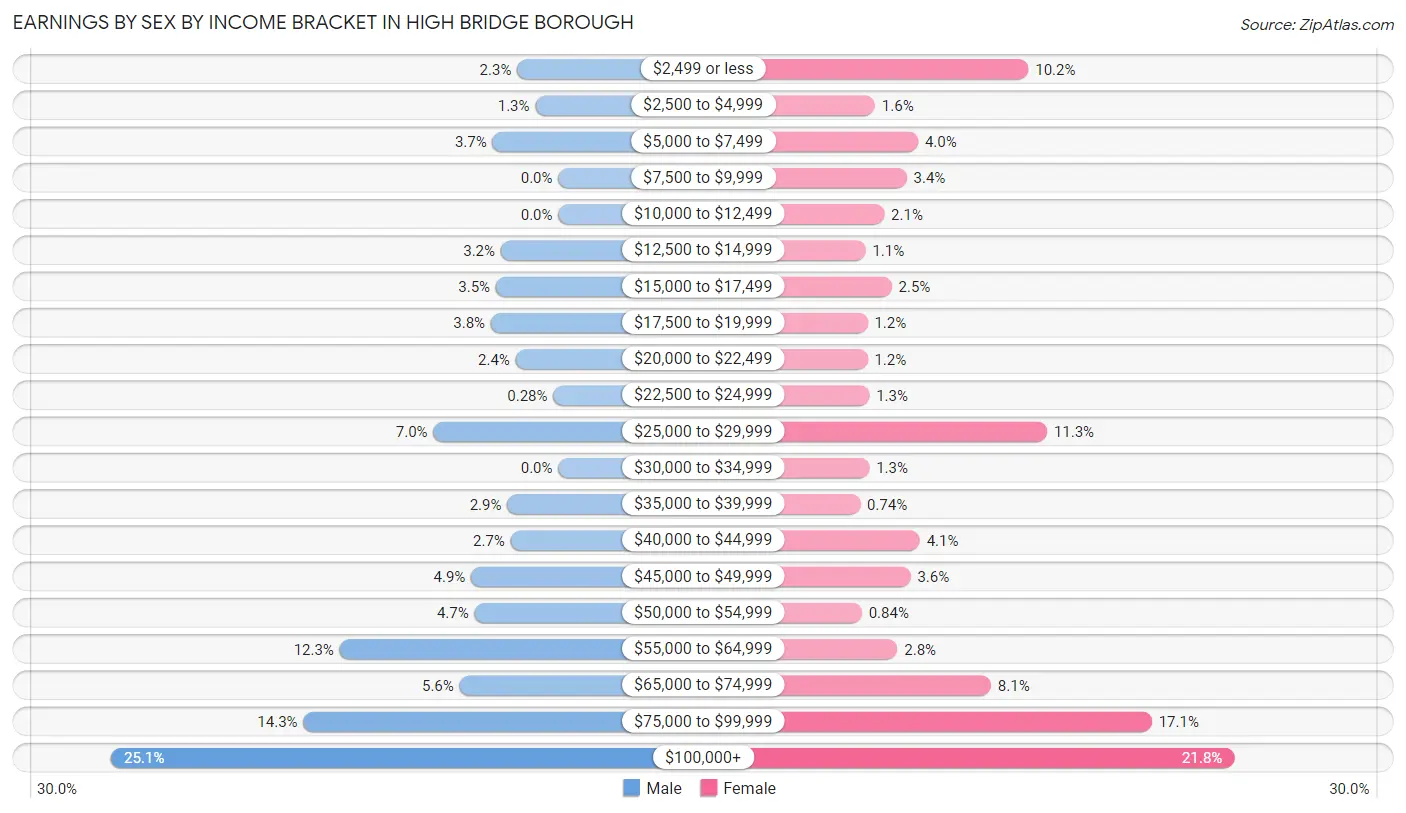
| Income | Male | Female |
| $2,499 or less | 25 (2.3%) | 97 (10.2%) |
| $2,500 to $4,999 | 14 (1.3%) | 15 (1.6%) |
| $5,000 to $7,499 | 40 (3.7%) | 38 (4.0%) |
| $7,500 to $9,999 | 0 (0.0%) | 32 (3.4%) |
| $10,000 to $12,499 | 0 (0.0%) | 20 (2.1%) |
| $12,500 to $14,999 | 35 (3.2%) | 10 (1.1%) |
| $15,000 to $17,499 | 38 (3.5%) | 24 (2.5%) |
| $17,500 to $19,999 | 41 (3.8%) | 11 (1.2%) |
| $20,000 to $22,499 | 26 (2.4%) | 11 (1.2%) |
| $22,500 to $24,999 | 3 (0.3%) | 12 (1.3%) |
| $25,000 to $29,999 | 76 (7.0%) | 107 (11.3%) |
| $30,000 to $34,999 | 0 (0.0%) | 12 (1.3%) |
| $35,000 to $39,999 | 31 (2.9%) | 7 (0.7%) |
| $40,000 to $44,999 | 29 (2.7%) | 39 (4.1%) |
| $45,000 to $49,999 | 53 (4.9%) | 34 (3.6%) |
| $50,000 to $54,999 | 51 (4.7%) | 8 (0.8%) |
| $55,000 to $64,999 | 133 (12.3%) | 27 (2.8%) |
| $65,000 to $74,999 | 60 (5.6%) | 77 (8.1%) |
| $75,000 to $99,999 | 155 (14.3%) | 163 (17.1%) |
| $100,000+ | 272 (25.1%) | 207 (21.8%) |
| Total | 1,082 (100.0%) | 951 (100.0%) |
Earnings by Sex by Educational Attainment in High Bridge borough
Average earnings in High Bridge borough are $67,039 for men and $70,982 for women, a difference of 5.6%. Men with an educational attainment of graduate degree enjoy the highest average annual earnings of $121,319, while those with high school diploma education earn the least with $54,508. Women with an educational attainment of bachelor's degree earn the most with the average annual earnings of $98,235, while those with college or associate's degree education have the smallest earnings of $76,250.
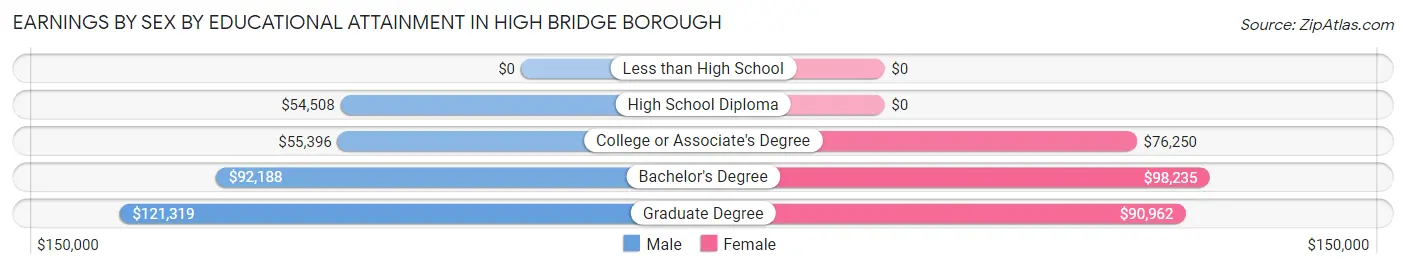
| Educational Attainment | Male Income | Female Income |
| Less than High School | - | - |
| High School Diploma | $54,508 | $0 |
| College or Associate's Degree | $55,396 | $76,250 |
| Bachelor's Degree | $92,188 | $98,235 |
| Graduate Degree | $121,319 | $90,962 |
| Total | $67,039 | $70,982 |
Family Income in High Bridge borough
Family Income Brackets in High Bridge borough
According to the High Bridge borough family income data, there are 245 families falling into the $100,000 to $149,999 income range, which is the most common income bracket and makes up 24.4% of all families.
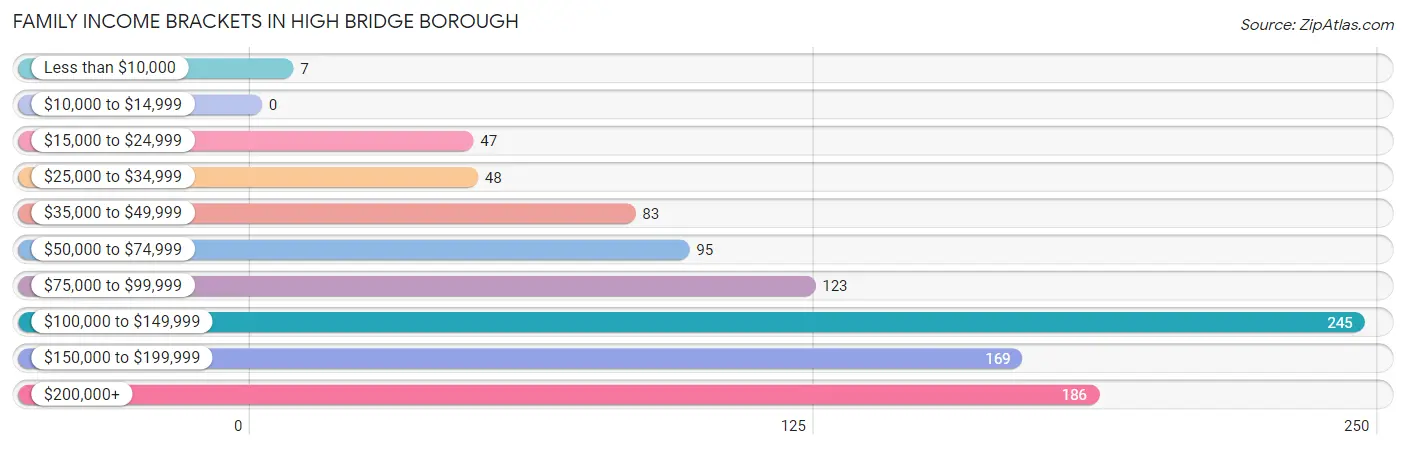
| Income Bracket | # Families | % Families |
| Less than $10,000 | 7 | 0.7% |
| $10,000 to $14,999 | 0 | 0.0% |
| $15,000 to $24,999 | 47 | 4.7% |
| $25,000 to $34,999 | 48 | 4.8% |
| $35,000 to $49,999 | 83 | 8.3% |
| $50,000 to $74,999 | 95 | 9.5% |
| $75,000 to $99,999 | 123 | 12.3% |
| $100,000 to $149,999 | 245 | 24.4% |
| $150,000 to $199,999 | 169 | 16.8% |
| $200,000+ | 186 | 18.5% |
Family Income by Famaliy Size in High Bridge borough
3-person families (183 | 18.2%) account for the highest median family income in High Bridge borough with $126,458 per family, while 2-person families (479 | 47.8%) have the highest median income of $61,292 per family member.
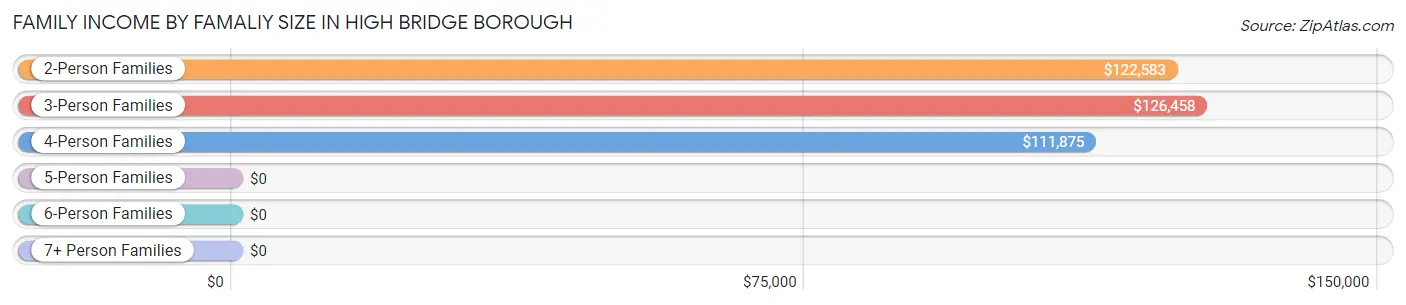
| Income Bracket | # Families | Median Income |
| 2-Person Families | 479 (47.8%) | $122,583 |
| 3-Person Families | 183 (18.2%) | $126,458 |
| 4-Person Families | 214 (21.3%) | $111,875 |
| 5-Person Families | 127 (12.7%) | $0 |
| 6-Person Families | 0 (0.0%) | $0 |
| 7+ Person Families | 0 (0.0%) | $0 |
| Total | 1,003 (100.0%) | $122,431 |
Family Income by Number of Earners in High Bridge borough
The median family income in High Bridge borough is $122,431, with families comprising 3+ earners (91) having the highest median family income of $161,597, while families with no earners (112) have the lowest median family income of $36,667, accounting for 9.1% and 11.2% of families, respectively.
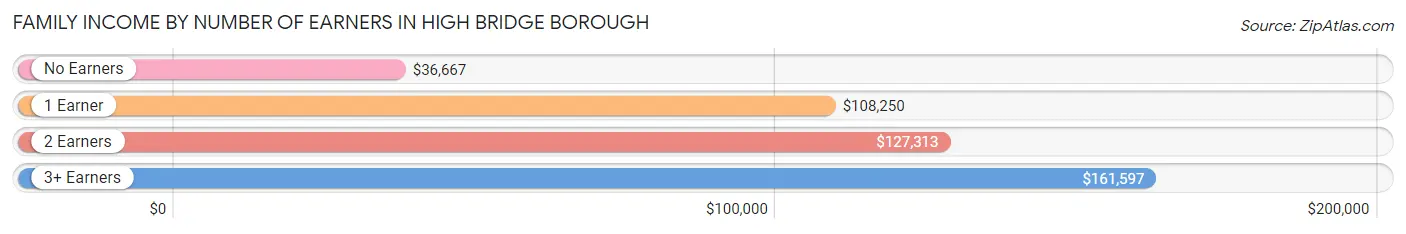
| Number of Earners | # Families | Median Income |
| No Earners | 112 (11.2%) | $36,667 |
| 1 Earner | 280 (27.9%) | $108,250 |
| 2 Earners | 520 (51.8%) | $127,313 |
| 3+ Earners | 91 (9.1%) | $161,597 |
| Total | 1,003 (100.0%) | $122,431 |
Household Income in High Bridge borough
Household Income Brackets in High Bridge borough
With 360 households falling in the category, the $100,000 to $149,999 income range is the most frequent in High Bridge borough, accounting for 25.1% of all households. In contrast, only 9 households (0.6%) fall into the $10,000 to $14,999 income bracket, making it the least populous group.
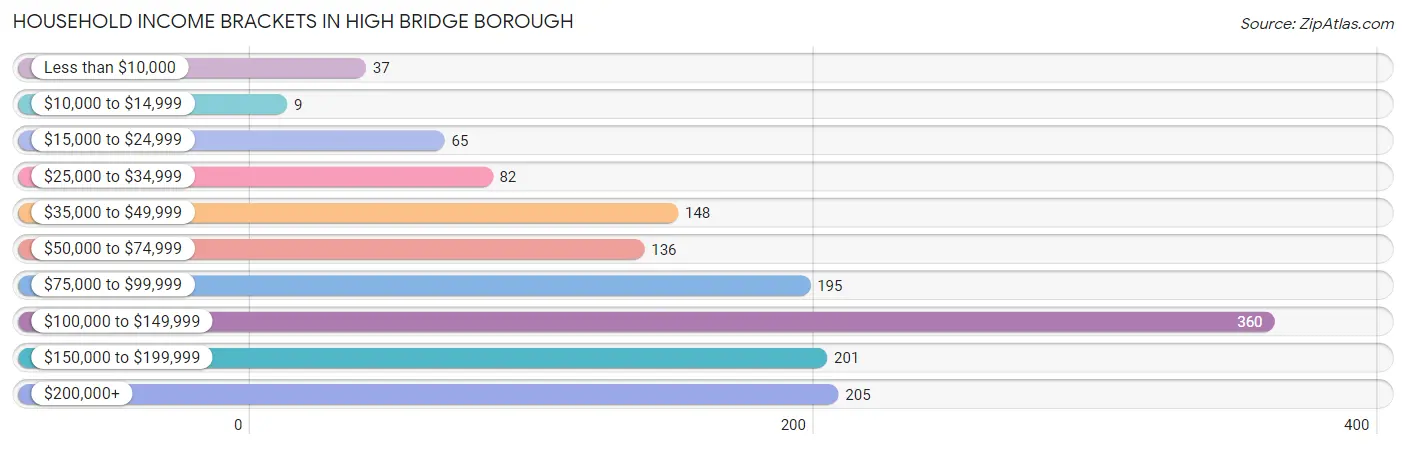
| Income Bracket | # Households | % Households |
| Less than $10,000 | 37 | 2.6% |
| $10,000 to $14,999 | 9 | 0.6% |
| $15,000 to $24,999 | 65 | 4.5% |
| $25,000 to $34,999 | 82 | 5.7% |
| $35,000 to $49,999 | 148 | 10.3% |
| $50,000 to $74,999 | 136 | 9.5% |
| $75,000 to $99,999 | 195 | 13.6% |
| $100,000 to $149,999 | 360 | 25.1% |
| $150,000 to $199,999 | 201 | 14.0% |
| $200,000+ | 205 | 14.3% |
Household Income by Householder Age in High Bridge borough
The median household income in High Bridge borough is $106,111, with the highest median household income of $116,154 found in the 45 to 64 years age bracket for the primary householder. A total of 730 households (50.8%) fall into this category. Meanwhile, the 15 to 24 years age bracket for the primary householder has the lowest median household income of $0, with 11 households (0.8%) in this group.
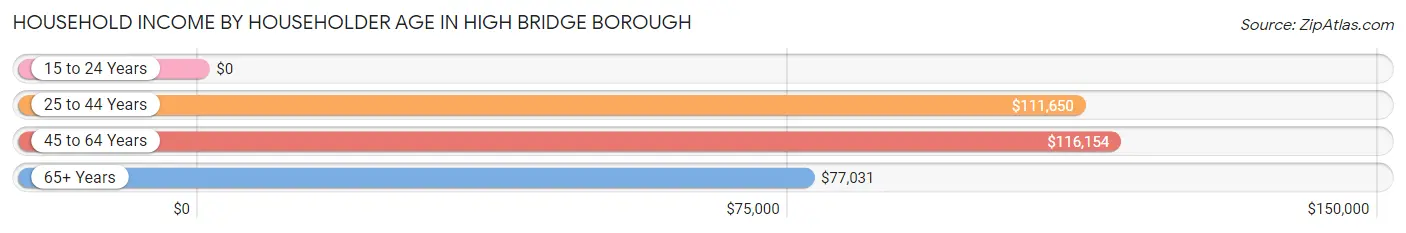
| Income Bracket | # Households | Median Income |
| 15 to 24 Years | 11 (0.8%) | $0 |
| 25 to 44 Years | 438 (30.5%) | $111,650 |
| 45 to 64 Years | 730 (50.8%) | $116,154 |
| 65+ Years | 257 (17.9%) | $77,031 |
| Total | 1,436 (100.0%) | $106,111 |
Poverty in High Bridge borough
Income Below Poverty by Sex and Age in High Bridge borough
With 8.8% poverty level for males and 13.7% for females among the residents of High Bridge borough, 6 to 11 year old males and 15 year old females are the most vulnerable to poverty, with 50 males (41.3%) and 24 females (66.7%) in their respective age groups living below the poverty level.
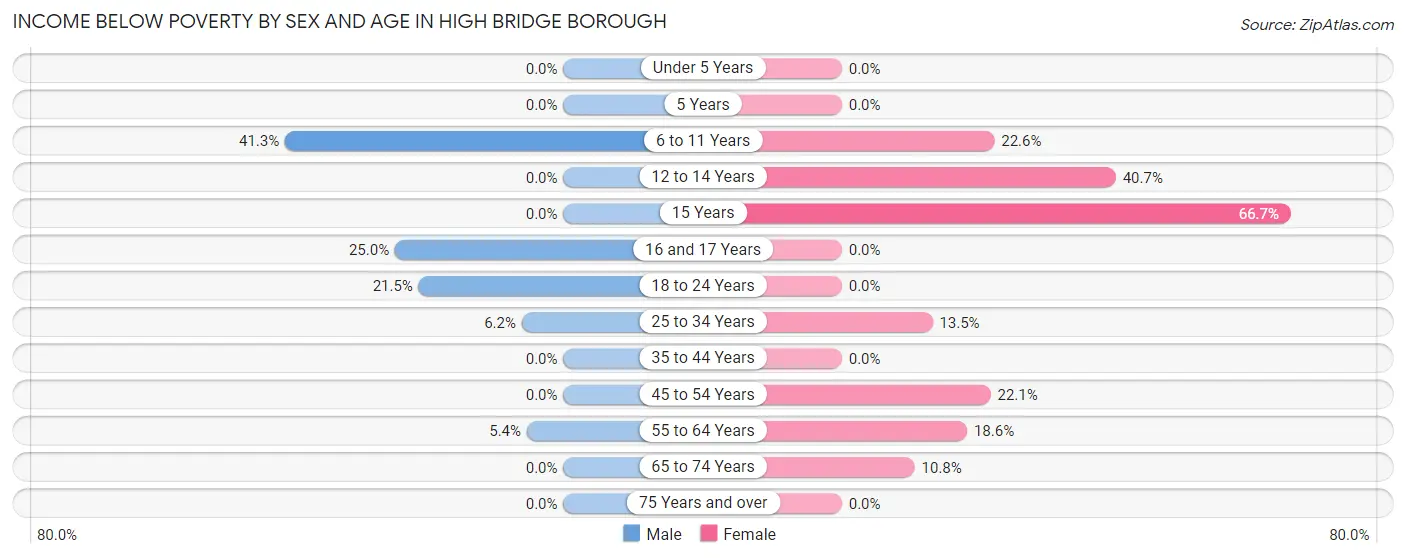
| Age Bracket | Male | Female |
| Under 5 Years | 0 (0.0%) | 0 (0.0%) |
| 5 Years | 0 (0.0%) | 0 (0.0%) |
| 6 to 11 Years | 50 (41.3%) | 24 (22.6%) |
| 12 to 14 Years | 0 (0.0%) | 24 (40.7%) |
| 15 Years | 0 (0.0%) | 24 (66.7%) |
| 16 and 17 Years | 23 (25.0%) | 0 (0.0%) |
| 18 to 24 Years | 61 (21.5%) | 0 (0.0%) |
| 25 to 34 Years | 14 (6.2%) | 21 (13.5%) |
| 35 to 44 Years | 0 (0.0%) | 0 (0.0%) |
| 45 to 54 Years | 0 (0.0%) | 74 (22.1%) |
| 55 to 64 Years | 15 (5.4%) | 50 (18.6%) |
| 65 to 74 Years | 0 (0.0%) | 16 (10.8%) |
| 75 Years and over | 0 (0.0%) | 0 (0.0%) |
| Total | 163 (8.8%) | 233 (13.7%) |
Income Above Poverty by Sex and Age in High Bridge borough
According to the poverty statistics in High Bridge borough, males aged under 5 years and females aged under 5 years are the age groups that are most secure financially, with 100.0% of males and 100.0% of females in these age groups living above the poverty line.
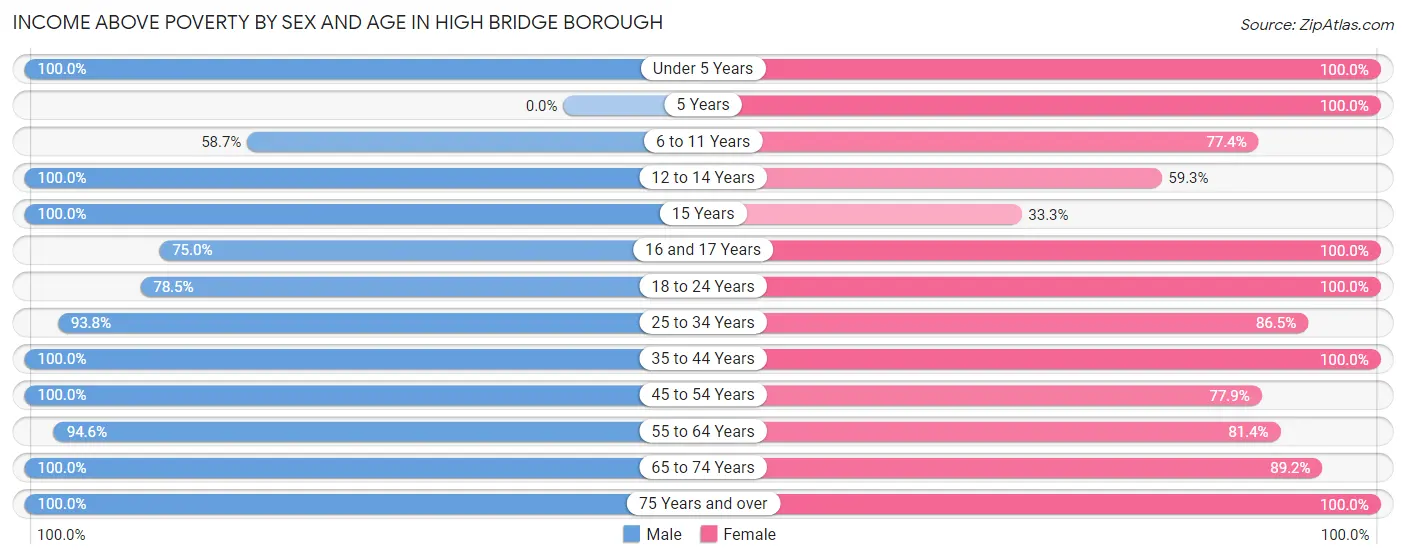
| Age Bracket | Male | Female |
| Under 5 Years | 110 (100.0%) | 58 (100.0%) |
| 5 Years | 0 (0.0%) | 22 (100.0%) |
| 6 to 11 Years | 71 (58.7%) | 82 (77.4%) |
| 12 to 14 Years | 74 (100.0%) | 35 (59.3%) |
| 15 Years | 8 (100.0%) | 12 (33.3%) |
| 16 and 17 Years | 69 (75.0%) | 83 (100.0%) |
| 18 to 24 Years | 223 (78.5%) | 95 (100.0%) |
| 25 to 34 Years | 213 (93.8%) | 135 (86.5%) |
| 35 to 44 Years | 185 (100.0%) | 263 (100.0%) |
| 45 to 54 Years | 303 (100.0%) | 261 (77.9%) |
| 55 to 64 Years | 262 (94.6%) | 219 (81.4%) |
| 65 to 74 Years | 94 (100.0%) | 132 (89.2%) |
| 75 Years and over | 85 (100.0%) | 74 (100.0%) |
| Total | 1,697 (91.2%) | 1,471 (86.3%) |
Income Below Poverty Among Married-Couple Families in High Bridge borough
The poverty statistics for married-couple families in High Bridge borough show that 0.9% or 7 of the total 764 families live below the poverty line. Families with no children have the highest poverty rate of 1.9%, comprising of 7 families. On the other hand, families with 1 or 2 children have the lowest poverty rate of 0.0%, which includes 0 families.
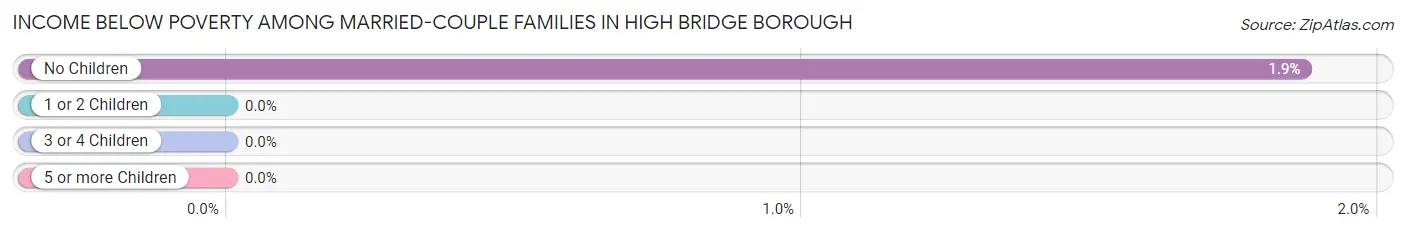
| Children | Above Poverty | Below Poverty |
| No Children | 367 (98.1%) | 7 (1.9%) |
| 1 or 2 Children | 339 (100.0%) | 0 (0.0%) |
| 3 or 4 Children | 51 (100.0%) | 0 (0.0%) |
| 5 or more Children | 0 (0.0%) | 0 (0.0%) |
| Total | 757 (99.1%) | 7 (0.9%) |
Income Below Poverty Among Single-Parent Households in High Bridge borough
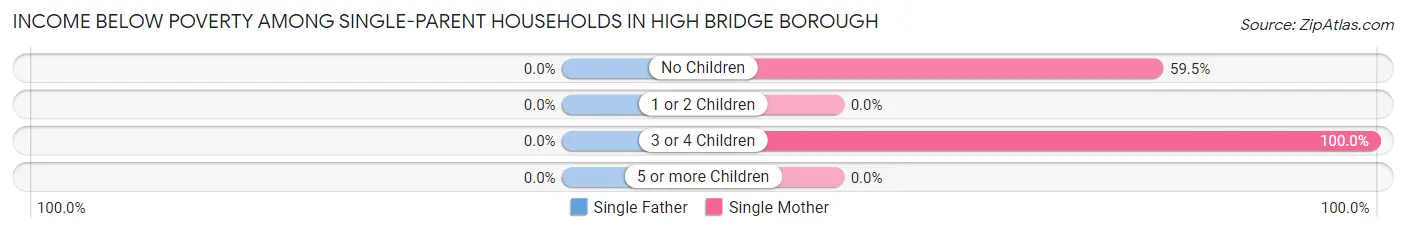
| Children | Single Father | Single Mother |
| No Children | 0 (0.0%) | 47 (59.5%) |
| 1 or 2 Children | 0 (0.0%) | 0 (0.0%) |
| 3 or 4 Children | 0 (0.0%) | 48 (100.0%) |
| 5 or more Children | 0 (0.0%) | 0 (0.0%) |
| Total | 0 (0.0%) | 95 (53.7%) |
Income Below Poverty Among Married-Couple vs Single-Parent Households in High Bridge borough
The poverty data for High Bridge borough shows that 7 of the married-couple family households (0.9%) and 95 of the single-parent households (39.8%) are living below the poverty level. Within the married-couple family households, those with no children have the highest poverty rate, with 7 households (1.9%) falling below the poverty line. Among the single-parent households, those with 3 or 4 children have the highest poverty rate, with 48 household (100.0%) living below poverty.
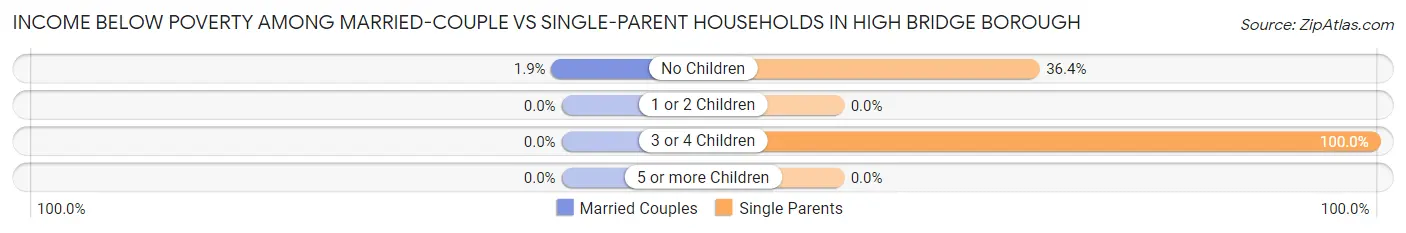
| Children | Married-Couple Families | Single-Parent Households |
| No Children | 7 (1.9%) | 47 (36.4%) |
| 1 or 2 Children | 0 (0.0%) | 0 (0.0%) |
| 3 or 4 Children | 0 (0.0%) | 48 (100.0%) |
| 5 or more Children | 0 (0.0%) | 0 (0.0%) |
| Total | 7 (0.9%) | 95 (39.8%) |
Race in High Bridge borough
The most populous races in High Bridge borough are White / Caucasian (2,782 | 78.1%), Hispanic or Latino (450 | 12.6%), and Asian (308 | 8.6%).
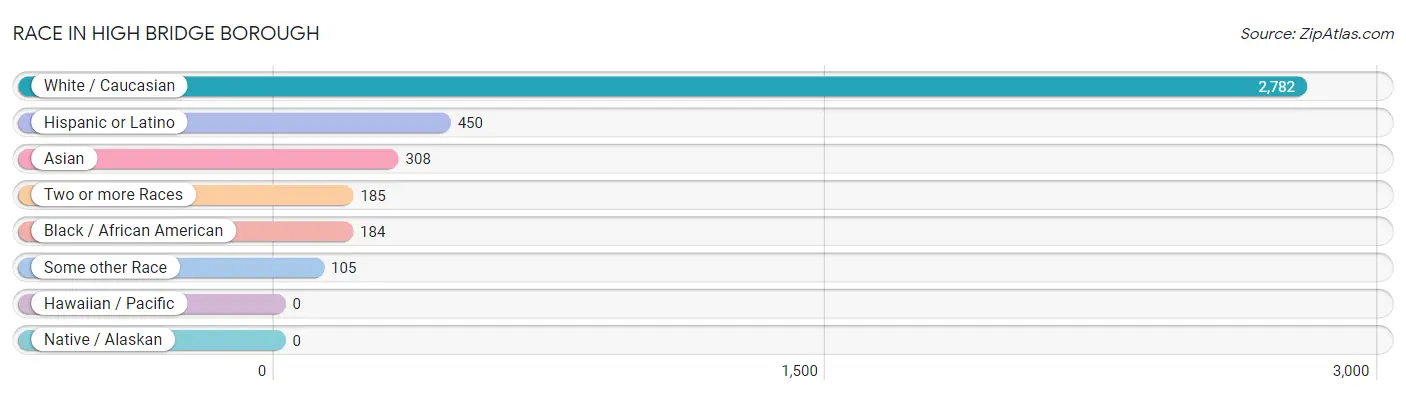
| Race | # Population | % Population |
| Asian | 308 | 8.6% |
| Black / African American | 184 | 5.2% |
| Hawaiian / Pacific | 0 | 0.0% |
| Hispanic or Latino | 450 | 12.6% |
| Native / Alaskan | 0 | 0.0% |
| White / Caucasian | 2,782 | 78.1% |
| Two or more Races | 185 | 5.2% |
| Some other Race | 105 | 2.9% |
| Total | 3,564 | 100.0% |
Ancestry in High Bridge borough
The most populous ancestries reported in High Bridge borough are German (697 | 19.6%), Italian (628 | 17.6%), Irish (555 | 15.6%), English (340 | 9.5%), and Polish (241 | 6.8%), together accounting for 69.1% of all High Bridge borough residents.
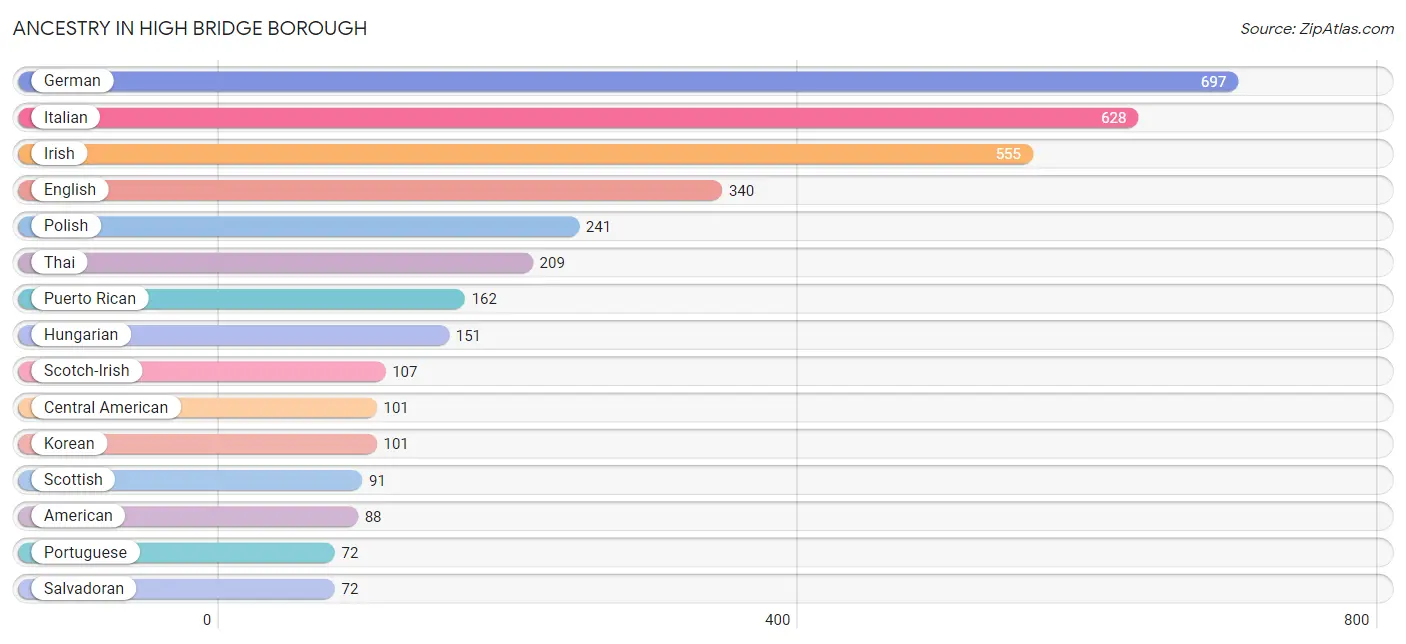
| Ancestry | # Population | % Population |
| American | 88 | 2.5% |
| Arab | 42 | 1.2% |
| Belgian | 10 | 0.3% |
| Brazilian | 9 | 0.3% |
| British | 27 | 0.8% |
| Canadian | 10 | 0.3% |
| Central American | 101 | 2.8% |
| Central American Indian | 15 | 0.4% |
| Colombian | 22 | 0.6% |
| Cuban | 8 | 0.2% |
| Czechoslovakian | 7 | 0.2% |
| Danish | 16 | 0.4% |
| Dutch | 71 | 2.0% |
| Egyptian | 15 | 0.4% |
| English | 340 | 9.5% |
| European | 39 | 1.1% |
| Finnish | 6 | 0.2% |
| French | 42 | 1.2% |
| German | 697 | 19.6% |
| Honduran | 29 | 0.8% |
| Hungarian | 151 | 4.2% |
| Irish | 555 | 15.6% |
| Italian | 628 | 17.6% |
| Korean | 101 | 2.8% |
| Lithuanian | 9 | 0.3% |
| Malaysian | 19 | 0.5% |
| Mexican | 34 | 0.9% |
| Norwegian | 10 | 0.3% |
| Polish | 241 | 6.8% |
| Portuguese | 72 | 2.0% |
| Puerto Rican | 162 | 4.5% |
| Russian | 34 | 0.9% |
| Salvadoran | 72 | 2.0% |
| Scandinavian | 34 | 0.9% |
| Scotch-Irish | 107 | 3.0% |
| Scottish | 91 | 2.5% |
| Slovak | 8 | 0.2% |
| Slovene | 20 | 0.6% |
| South American | 22 | 0.6% |
| Spaniard | 28 | 0.8% |
| Swedish | 7 | 0.2% |
| Swiss | 14 | 0.4% |
| Thai | 209 | 5.9% |
| Ukrainian | 8 | 0.2% |
| Welsh | 23 | 0.6% | View All 45 Rows |
Immigrants in High Bridge borough
The most numerous immigrant groups reported in High Bridge borough came from Asia (299 | 8.4%), India (209 | 5.9%), South Central Asia (209 | 5.9%), Europe (162 | 4.5%), and Latin America (154 | 4.3%), together accounting for 29.0% of all High Bridge borough residents.
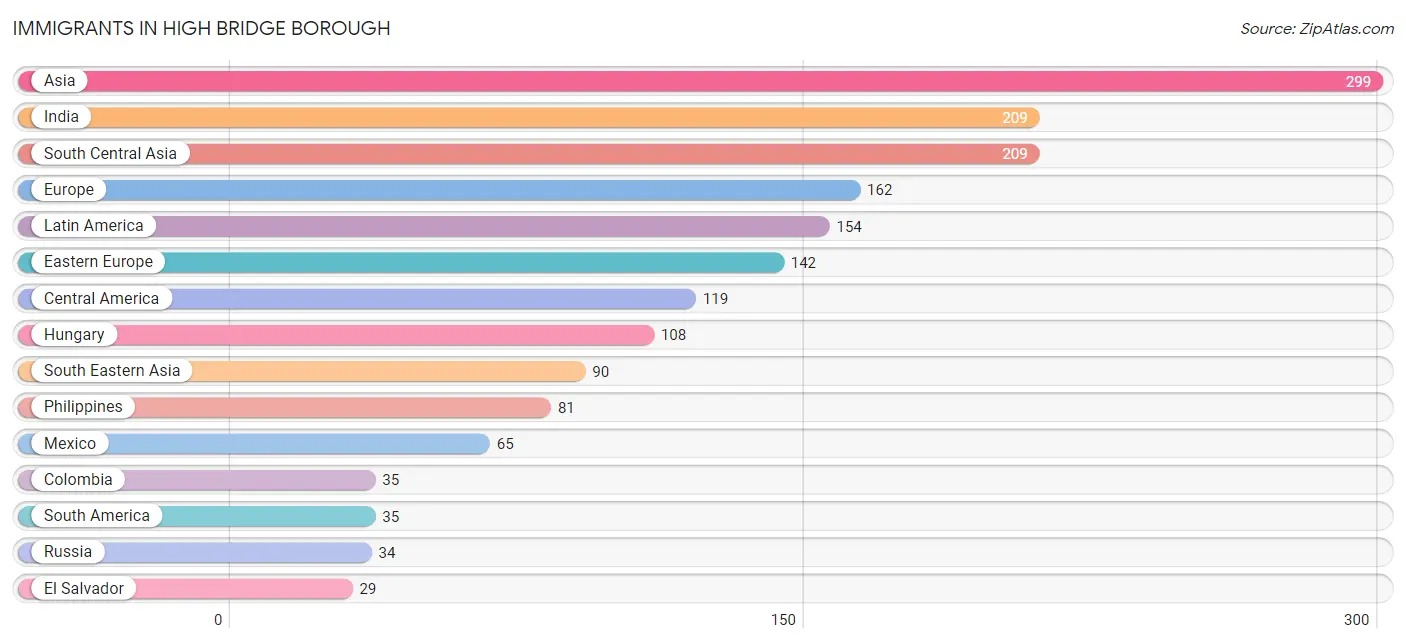
| Immigration Origin | # Population | % Population |
| Africa | 15 | 0.4% |
| Asia | 299 | 8.4% |
| Canada | 10 | 0.3% |
| Central America | 119 | 3.3% |
| Colombia | 35 | 1.0% |
| Eastern Europe | 142 | 4.0% |
| Egypt | 15 | 0.4% |
| El Salvador | 29 | 0.8% |
| Europe | 162 | 4.5% |
| Guatemala | 25 | 0.7% |
| Hungary | 108 | 3.0% |
| India | 209 | 5.9% |
| Laos | 9 | 0.3% |
| Latin America | 154 | 4.3% |
| Mexico | 65 | 1.8% |
| Netherlands | 10 | 0.3% |
| Northern Africa | 15 | 0.4% |
| Northern Europe | 10 | 0.3% |
| Philippines | 81 | 2.3% |
| Russia | 34 | 0.9% |
| South America | 35 | 1.0% |
| South Central Asia | 209 | 5.9% |
| South Eastern Asia | 90 | 2.5% |
| Western Europe | 10 | 0.3% | View All 24 Rows |
Sex and Age in High Bridge borough
Sex and Age in High Bridge borough
The most populous age groups in High Bridge borough are 15 to 19 Years (285 | 15.3%) for men and 35 to 39 Years (180 | 10.6%) for women.
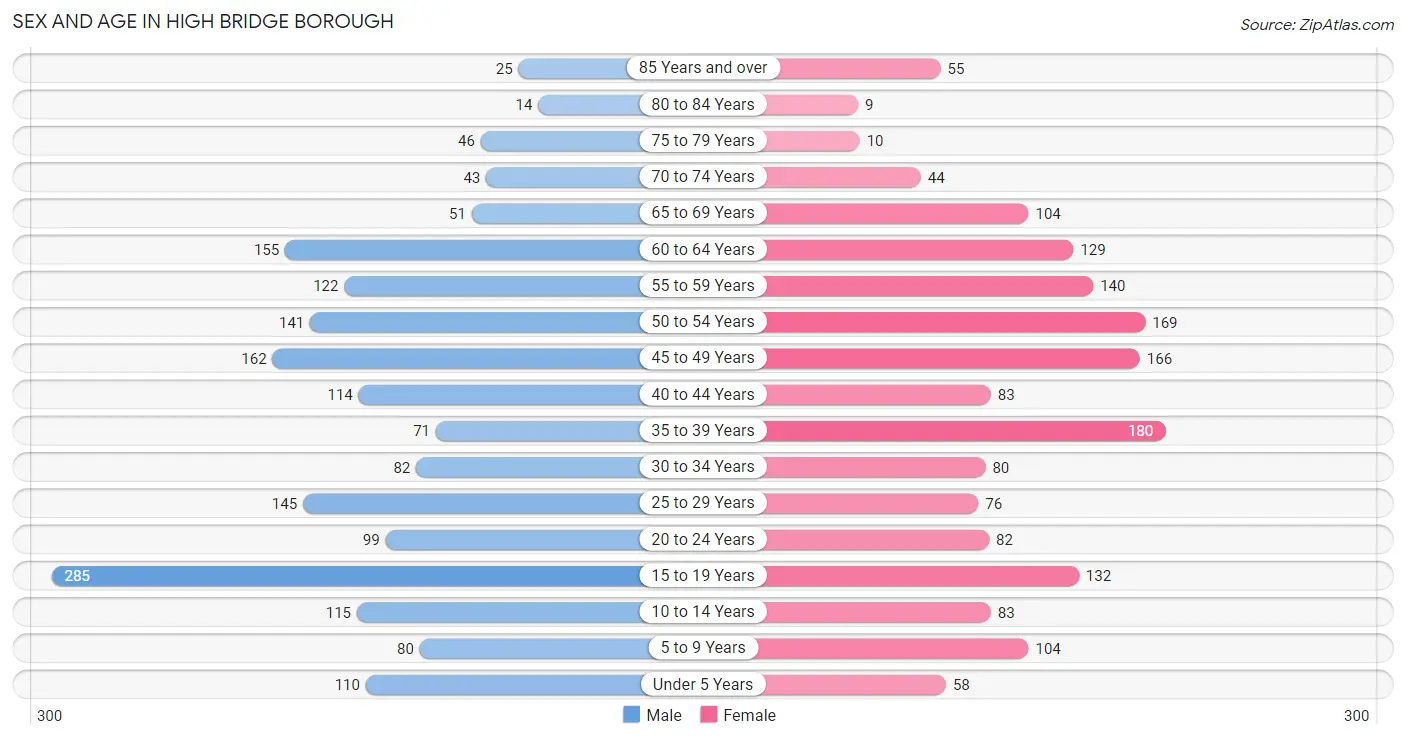
| Age Bracket | Male | Female |
| Under 5 Years | 110 (5.9%) | 58 (3.4%) |
| 5 to 9 Years | 80 (4.3%) | 104 (6.1%) |
| 10 to 14 Years | 115 (6.2%) | 83 (4.9%) |
| 15 to 19 Years | 285 (15.3%) | 132 (7.7%) |
| 20 to 24 Years | 99 (5.3%) | 82 (4.8%) |
| 25 to 29 Years | 145 (7.8%) | 76 (4.5%) |
| 30 to 34 Years | 82 (4.4%) | 80 (4.7%) |
| 35 to 39 Years | 71 (3.8%) | 180 (10.6%) |
| 40 to 44 Years | 114 (6.1%) | 83 (4.9%) |
| 45 to 49 Years | 162 (8.7%) | 166 (9.7%) |
| 50 to 54 Years | 141 (7.6%) | 169 (9.9%) |
| 55 to 59 Years | 122 (6.6%) | 140 (8.2%) |
| 60 to 64 Years | 155 (8.3%) | 129 (7.6%) |
| 65 to 69 Years | 51 (2.7%) | 104 (6.1%) |
| 70 to 74 Years | 43 (2.3%) | 44 (2.6%) |
| 75 to 79 Years | 46 (2.5%) | 10 (0.6%) |
| 80 to 84 Years | 14 (0.7%) | 9 (0.5%) |
| 85 Years and over | 25 (1.3%) | 55 (3.2%) |
| Total | 1,860 (100.0%) | 1,704 (100.0%) |
Families and Households in High Bridge borough
Median Family Size in High Bridge borough
The median family size in High Bridge borough is 2.98 persons per family, with married-couple families (764 | 76.2%) accounting for the largest median family size of 3.06 persons per family. On the other hand, single male/father families (62 | 6.2%) represent the smallest median family size with 2.19 persons per family.
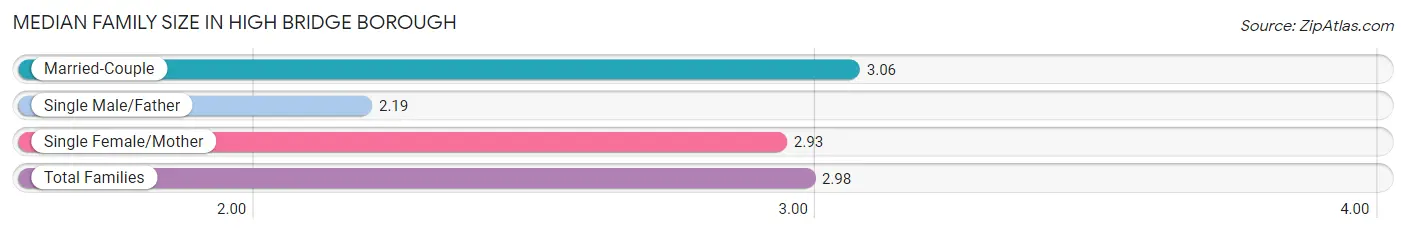
| Family Type | # Families | Family Size |
| Married-Couple | 764 (76.2%) | 3.06 |
| Single Male/Father | 62 (6.2%) | 2.19 |
| Single Female/Mother | 177 (17.6%) | 2.93 |
| Total Families | 1,003 (100.0%) | 2.98 |
Median Household Size in High Bridge borough
The median household size in High Bridge borough is 2.48 persons per household, with single female/mother households (177 | 12.3%) accounting for the largest median household size of 3.1 persons per household. non-family households (433 | 30.1%) represent the smallest median household size with 1.19 persons per household.
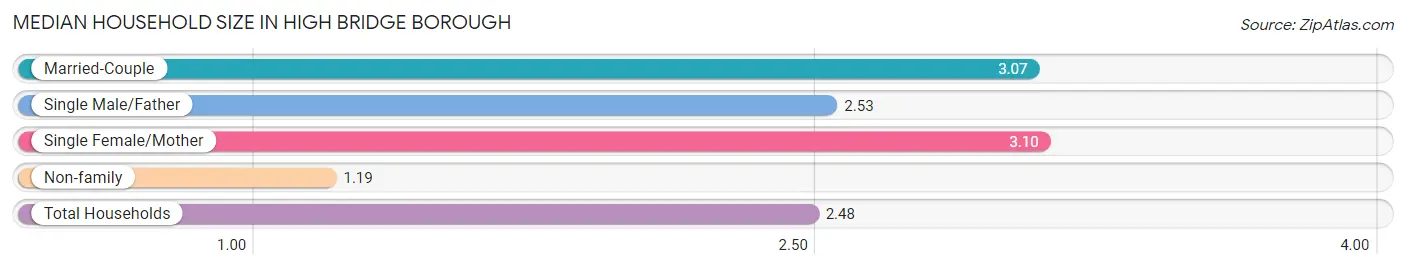
| Household Type | # Households | Household Size |
| Married-Couple | 764 (53.2%) | 3.07 |
| Single Male/Father | 62 (4.3%) | 2.53 |
| Single Female/Mother | 177 (12.3%) | 3.10 |
| Non-family | 433 (30.1%) | 1.19 |
| Total Households | 1,436 (100.0%) | 2.48 |
Household Size by Marriage Status in High Bridge borough
Out of a total of 1,436 households in High Bridge borough, 1,003 (69.9%) are family households, while 433 (30.1%) are nonfamily households. The most numerous type of family households are 2-person households, comprising 416, and the most common type of nonfamily households are 1-person households, comprising 346.
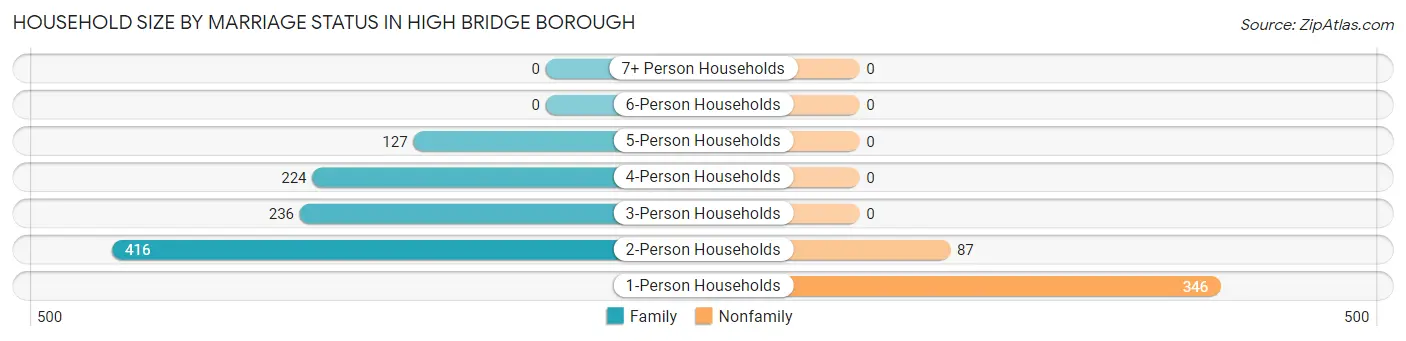
| Household Size | Family Households | Nonfamily Households |
| 1-Person Households | - | 346 (24.1%) |
| 2-Person Households | 416 (29.0%) | 87 (6.1%) |
| 3-Person Households | 236 (16.4%) | 0 (0.0%) |
| 4-Person Households | 224 (15.6%) | 0 (0.0%) |
| 5-Person Households | 127 (8.8%) | 0 (0.0%) |
| 6-Person Households | 0 (0.0%) | 0 (0.0%) |
| 7+ Person Households | 0 (0.0%) | 0 (0.0%) |
| Total | 1,003 (69.9%) | 433 (30.1%) |
Female Fertility in High Bridge borough
Fertility by Age in High Bridge borough
Average fertility rate in High Bridge borough is 13.0 births per 1,000 women. Women in the age bracket of 20 to 34 years have the highest fertility rate with 46.0 births per 1,000 women. Women in the age bracket of 20 to 34 years acount for 100.0% of all women with births.
| Age Bracket | Women with Births | Births / 1,000 Women |
| 15 to 19 years | 0 (0.0%) | 0.0 |
| 20 to 34 years | 11 (100.0%) | 46.0 |
| 35 to 50 years | 0 (0.0%) | 0.0 |
| Total | 11 (100.0%) | 13.0 |
Fertility by Age by Marriage Status in High Bridge borough
| Age Bracket | Married | Unmarried |
| 15 to 19 years | 0 (0.0%) | 0 (0.0%) |
| 20 to 34 years | 11 (100.0%) | 0 (0.0%) |
| 35 to 50 years | 0 (0.0%) | 0 (0.0%) |
| Total | 11 (100.0%) | 0 (0.0%) |
Fertility by Education in High Bridge borough
| Educational Attainment | Women with Births | Births / 1,000 Women |
| Less than High School | 0 (0.0%) | 0.0 |
| High School Diploma | 0 (0.0%) | 0.0 |
| College or Associate's Degree | 5 (45.5%) | 35.0 |
| Bachelor's Degree | 6 (54.5%) | 27.0 |
| Graduate Degree | 0 (0.0%) | 0.0 |
| Total | 11 (100.0%) | 13.0 |
Fertility by Education by Marriage Status in High Bridge borough
| Educational Attainment | Married | Unmarried |
| Less than High School | 0 (0.0%) | 0 (0.0%) |
| High School Diploma | 0 (0.0%) | 0 (0.0%) |
| College or Associate's Degree | 5 (100.0%) | 0 (0.0%) |
| Bachelor's Degree | 6 (100.0%) | 0 (0.0%) |
| Graduate Degree | 0 (0.0%) | 0 (0.0%) |
| Total | 11 (100.0%) | 0 (0.0%) |
Employment Characteristics in High Bridge borough
Employment by Class of Employer in High Bridge borough
Among the 1,851 employed individuals in High Bridge borough, private company employees (1,221 | 66.0%), local government employees (219 | 11.8%), and not-for-profit organizations (165 | 8.9%) make up the most common classes of employment.
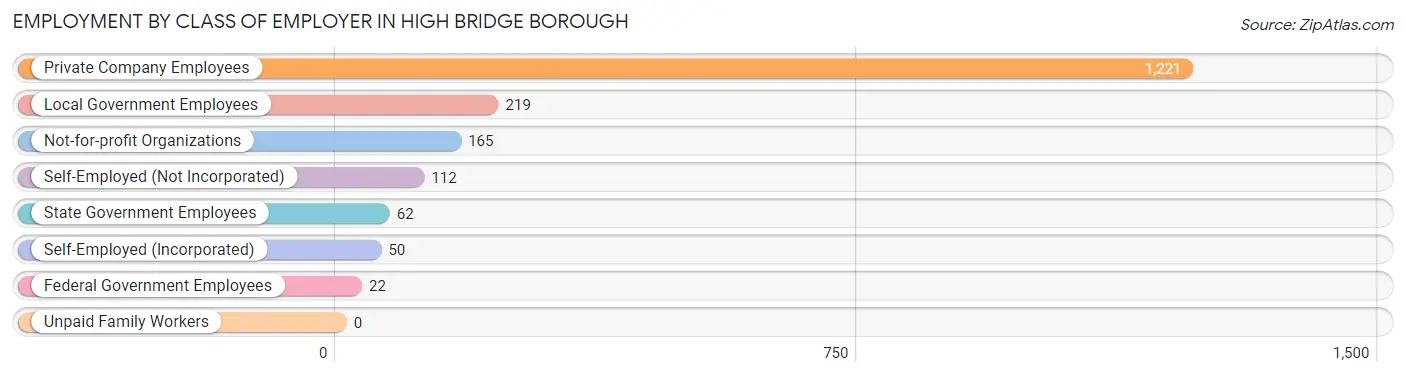
| Employer Class | # Employees | % Employees |
| Private Company Employees | 1,221 | 66.0% |
| Self-Employed (Incorporated) | 50 | 2.7% |
| Self-Employed (Not Incorporated) | 112 | 6.0% |
| Not-for-profit Organizations | 165 | 8.9% |
| Local Government Employees | 219 | 11.8% |
| State Government Employees | 62 | 3.4% |
| Federal Government Employees | 22 | 1.2% |
| Unpaid Family Workers | 0 | 0.0% |
| Total | 1,851 | 100.0% |
Employment Status by Age in High Bridge borough
According to the labor force statistics for High Bridge borough, out of the total population over 16 years of age (2,970), 66.3% or 1,969 individuals are in the labor force, with 6.0% or 118 of them unemployed. The age group with the highest labor force participation rate is 25 to 29 years, with 100.0% or 221 individuals in the labor force. Within the labor force, the 55 to 59 years age range has the highest percentage of unemployed individuals, with 28.2% or 57 of them being unemployed.
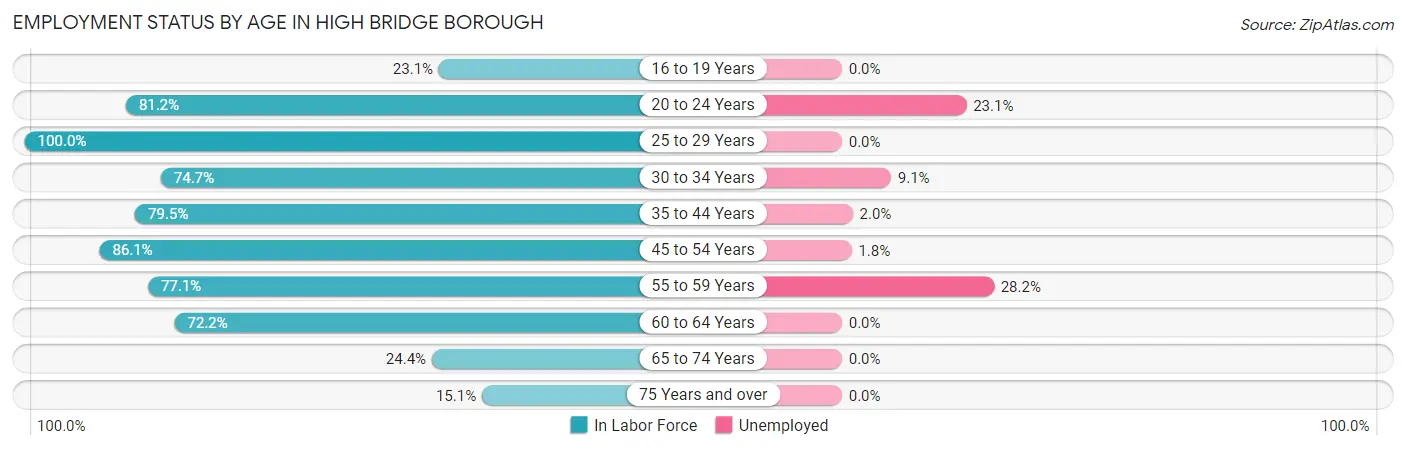
| Age Bracket | In Labor Force | Unemployed |
| 16 to 19 Years | 86 (23.1%) | 0 (0.0%) |
| 20 to 24 Years | 147 (81.2%) | 34 (23.1%) |
| 25 to 29 Years | 221 (100.0%) | 0 (0.0%) |
| 30 to 34 Years | 121 (74.7%) | 11 (9.1%) |
| 35 to 44 Years | 356 (79.5%) | 7 (2.0%) |
| 45 to 54 Years | 549 (86.1%) | 10 (1.8%) |
| 55 to 59 Years | 202 (77.1%) | 57 (28.2%) |
| 60 to 64 Years | 205 (72.2%) | 0 (0.0%) |
| 65 to 74 Years | 59 (24.4%) | 0 (0.0%) |
| 75 Years and over | 24 (15.1%) | 0 (0.0%) |
| Total | 1,969 (66.3%) | 118 (6.0%) |
Employment Status by Educational Attainment in High Bridge borough
According to labor force statistics for High Bridge borough, 82.1% of individuals (1,654) out of the total population between 25 and 64 years of age (2,015) are in the labor force, with 5.1% or 84 of them being unemployed. The group with the highest labor force participation rate are those with the educational attainment of college / associate degree, with 93.6% or 465 individuals in the labor force. Within the labor force, individuals with less than high school education have the highest percentage of unemployment, with 11.9% or 7 of them being unemployed.
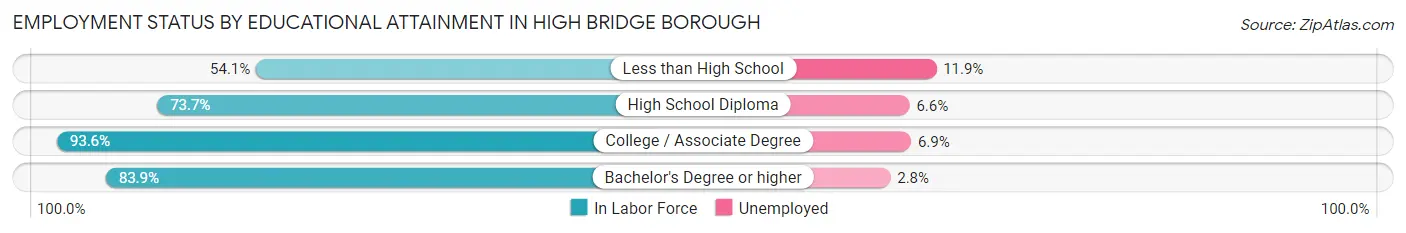
| Educational Attainment | In Labor Force | Unemployed |
| Less than High School | 59 (54.1%) | 13 (11.9%) |
| High School Diploma | 376 (73.7%) | 34 (6.6%) |
| College / Associate Degree | 465 (93.6%) | 34 (6.9%) |
| Bachelor's Degree or higher | 754 (83.9%) | 25 (2.8%) |
| Total | 1,654 (82.1%) | 103 (5.1%) |
Employment Occupations by Sex in High Bridge borough
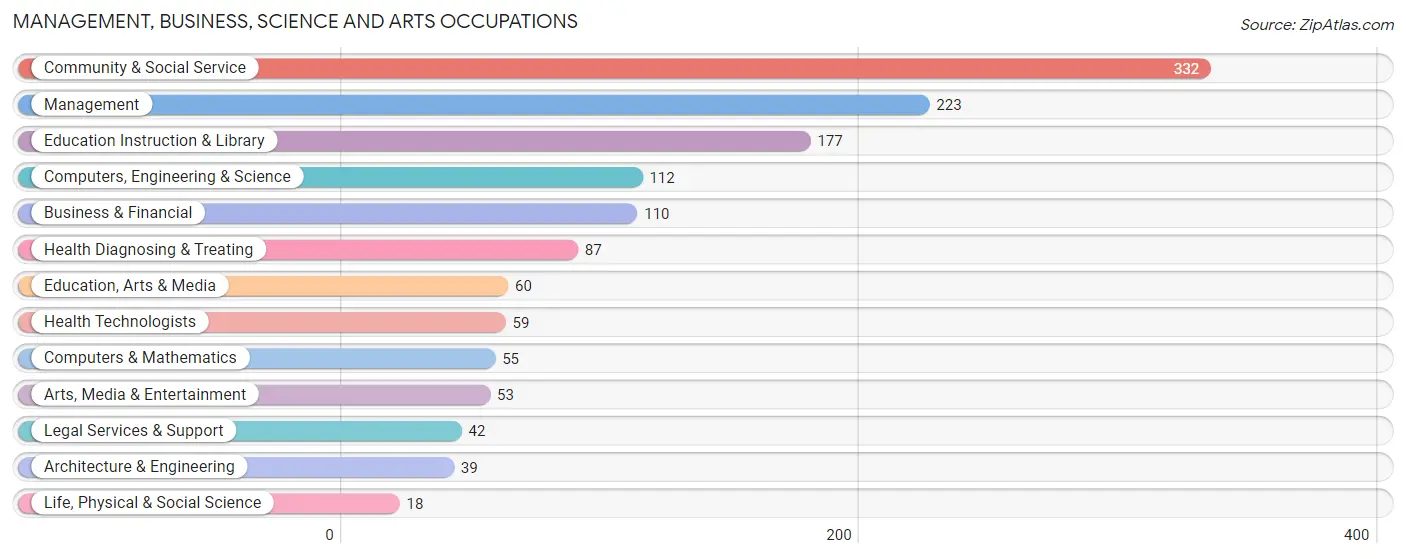
Management, Business, Science and Arts Occupations
The most common Management, Business, Science and Arts occupations in High Bridge borough are Community & Social Service (332 | 17.9%), Management (223 | 12.0%), Education Instruction & Library (177 | 9.6%), Computers, Engineering & Science (112 | 6.0%), and Business & Financial (110 | 5.9%).
Management, Business, Science and Arts Occupations by Sex
Within the Management, Business, Science and Arts occupations in High Bridge borough, the most male-oriented occupations are Architecture & Engineering (100.0%), Arts, Media & Entertainment (86.8%), and Computers, Engineering & Science (78.6%), while the most female-oriented occupations are Legal Services & Support (100.0%), Health Technologists (84.8%), and Health Diagnosing & Treating (77.0%).
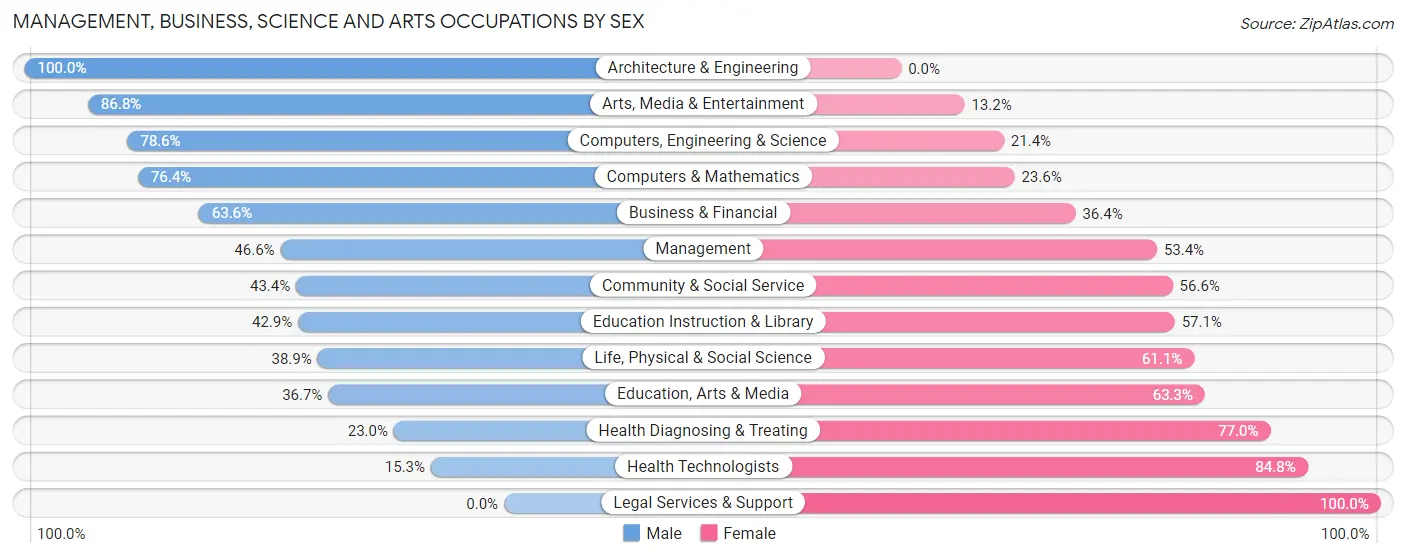
| Occupation | Male | Female |
| Management | 104 (46.6%) | 119 (53.4%) |
| Business & Financial | 70 (63.6%) | 40 (36.4%) |
| Computers, Engineering & Science | 88 (78.6%) | 24 (21.4%) |
| Computers & Mathematics | 42 (76.4%) | 13 (23.6%) |
| Architecture & Engineering | 39 (100.0%) | 0 (0.0%) |
| Life, Physical & Social Science | 7 (38.9%) | 11 (61.1%) |
| Community & Social Service | 144 (43.4%) | 188 (56.6%) |
| Education, Arts & Media | 22 (36.7%) | 38 (63.3%) |
| Legal Services & Support | 0 (0.0%) | 42 (100.0%) |
| Education Instruction & Library | 76 (42.9%) | 101 (57.1%) |
| Arts, Media & Entertainment | 46 (86.8%) | 7 (13.2%) |
| Health Diagnosing & Treating | 20 (23.0%) | 67 (77.0%) |
| Health Technologists | 9 (15.2%) | 50 (84.8%) |
| Total (Category) | 426 (49.3%) | 438 (50.7%) |
| Total (Overall) | 990 (53.5%) | 861 (46.5%) |
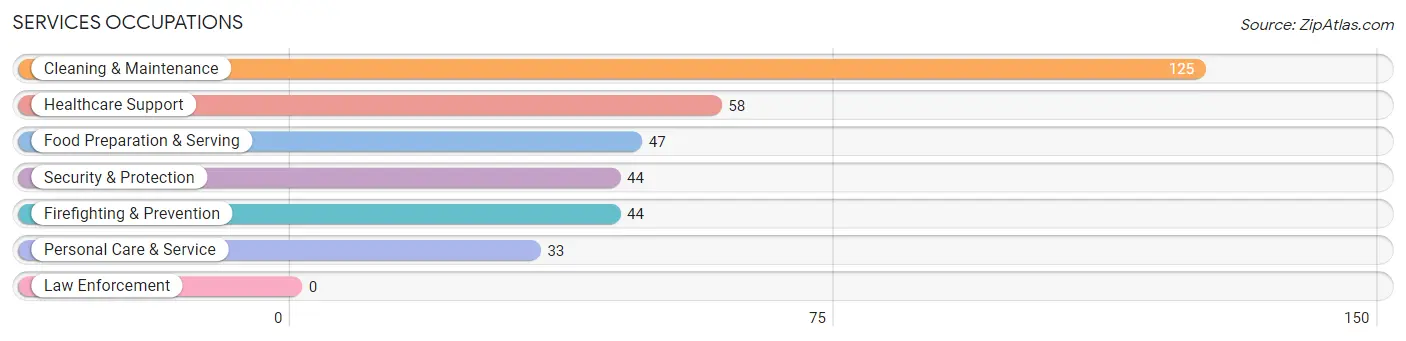
Services Occupations
The most common Services occupations in High Bridge borough are Cleaning & Maintenance (125 | 6.8%), Healthcare Support (58 | 3.1%), Food Preparation & Serving (47 | 2.5%), Security & Protection (44 | 2.4%), and Firefighting & Prevention (44 | 2.4%).
Services Occupations by Sex
Within the Services occupations in High Bridge borough, the most male-oriented occupations are Security & Protection (72.7%), Firefighting & Prevention (72.7%), and Food Preparation & Serving (42.5%), while the most female-oriented occupations are Healthcare Support (100.0%), Personal Care & Service (72.7%), and Cleaning & Maintenance (72.0%).
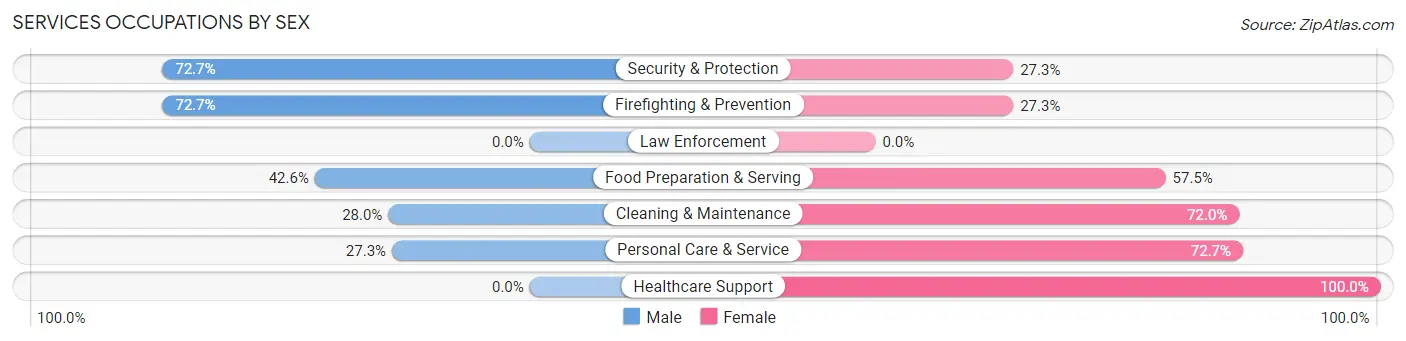
| Occupation | Male | Female |
| Healthcare Support | 0 (0.0%) | 58 (100.0%) |
| Security & Protection | 32 (72.7%) | 12 (27.3%) |
| Firefighting & Prevention | 32 (72.7%) | 12 (27.3%) |
| Law Enforcement | 0 (0.0%) | 0 (0.0%) |
| Food Preparation & Serving | 20 (42.5%) | 27 (57.5%) |
| Cleaning & Maintenance | 35 (28.0%) | 90 (72.0%) |
| Personal Care & Service | 9 (27.3%) | 24 (72.7%) |
| Total (Category) | 96 (31.3%) | 211 (68.7%) |
| Total (Overall) | 990 (53.5%) | 861 (46.5%) |
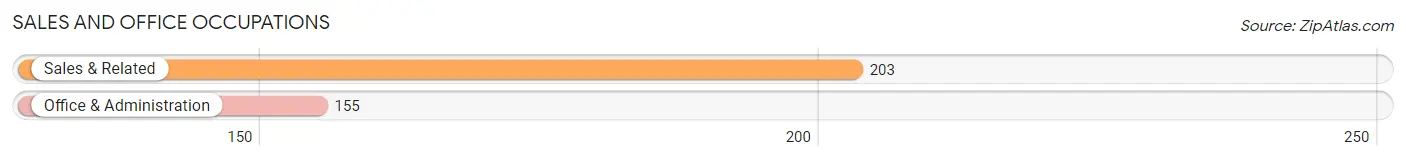
Sales and Office Occupations
The most common Sales and Office occupations in High Bridge borough are Sales & Related (203 | 11.0%), and Office & Administration (155 | 8.4%).
Sales and Office Occupations by Sex
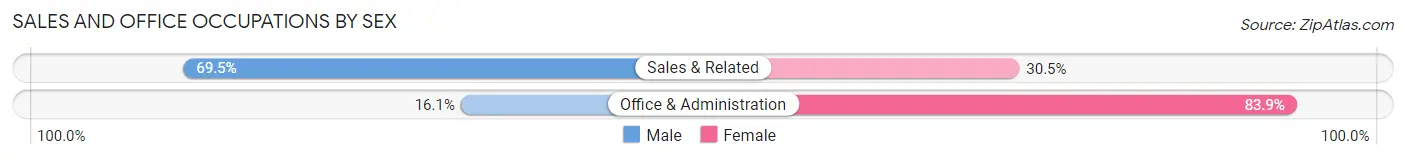
| Occupation | Male | Female |
| Sales & Related | 141 (69.5%) | 62 (30.5%) |
| Office & Administration | 25 (16.1%) | 130 (83.9%) |
| Total (Category) | 166 (46.4%) | 192 (53.6%) |
| Total (Overall) | 990 (53.5%) | 861 (46.5%) |
Natural Resources, Construction and Maintenance Occupations
The most common Natural Resources, Construction and Maintenance occupations in High Bridge borough are Construction & Extraction (93 | 5.0%), Installation, Maintenance & Repair (33 | 1.8%), and Farming, Fishing & Forestry (28 | 1.5%).
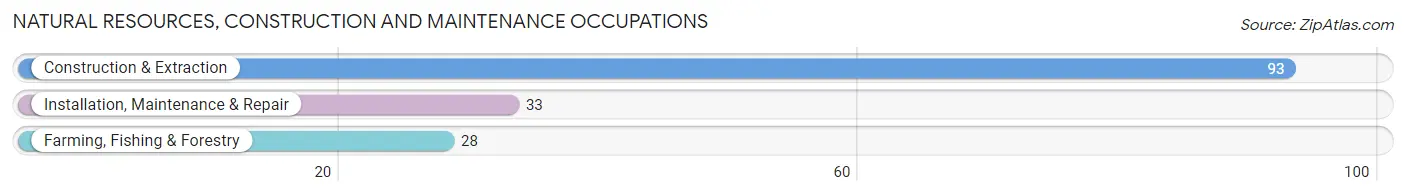
Natural Resources, Construction and Maintenance Occupations by Sex
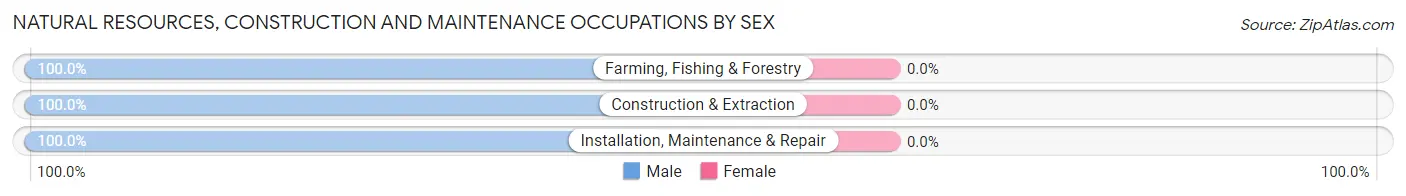
| Occupation | Male | Female |
| Farming, Fishing & Forestry | 28 (100.0%) | 0 (0.0%) |
| Construction & Extraction | 93 (100.0%) | 0 (0.0%) |
| Installation, Maintenance & Repair | 33 (100.0%) | 0 (0.0%) |
| Total (Category) | 154 (100.0%) | 0 (0.0%) |
| Total (Overall) | 990 (53.5%) | 861 (46.5%) |
Production, Transportation and Moving Occupations
The most common Production, Transportation and Moving occupations in High Bridge borough are Transportation (63 | 3.4%), Material Moving (59 | 3.2%), and Production (46 | 2.5%).
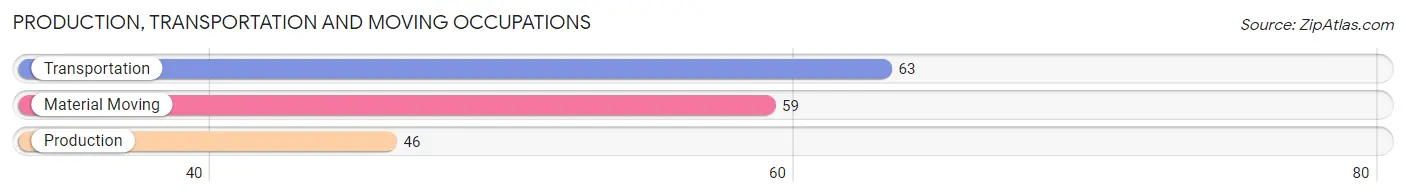
Production, Transportation and Moving Occupations by Sex
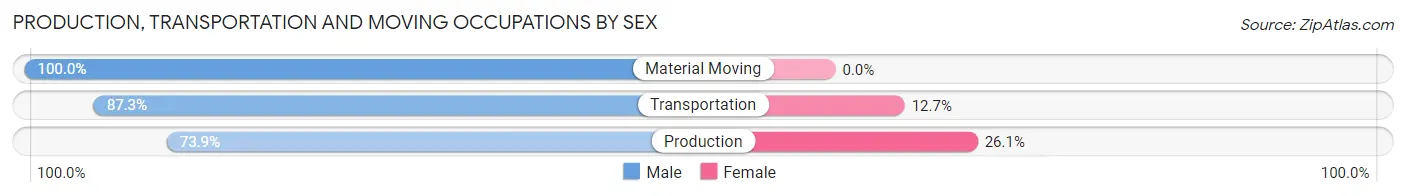
| Occupation | Male | Female |
| Production | 34 (73.9%) | 12 (26.1%) |
| Transportation | 55 (87.3%) | 8 (12.7%) |
| Material Moving | 59 (100.0%) | 0 (0.0%) |
| Total (Category) | 148 (88.1%) | 20 (11.9%) |
| Total (Overall) | 990 (53.5%) | 861 (46.5%) |
Employment Industries by Sex in High Bridge borough
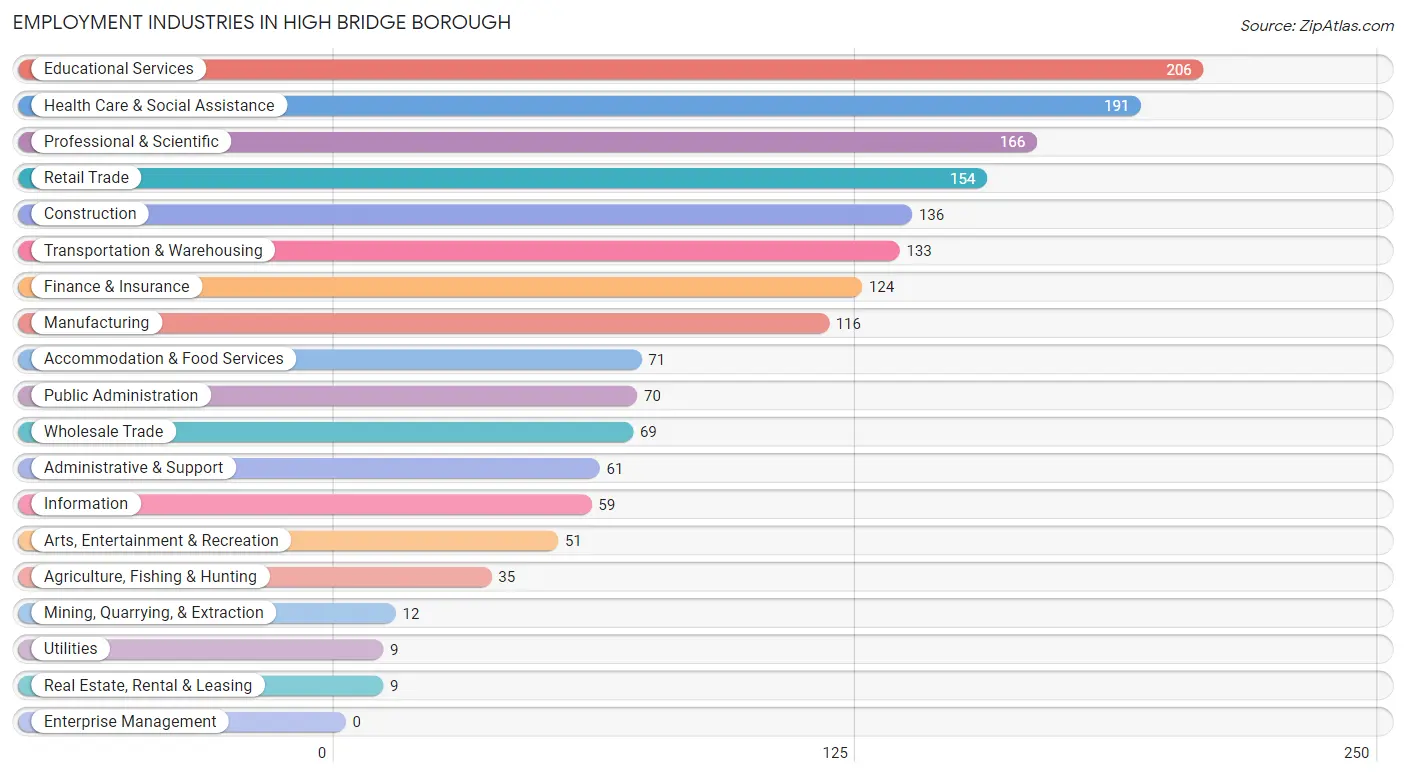
Employment Industries in High Bridge borough
The major employment industries in High Bridge borough include Educational Services (206 | 11.1%), Health Care & Social Assistance (191 | 10.3%), Professional & Scientific (166 | 9.0%), Retail Trade (154 | 8.3%), and Construction (136 | 7.3%).
Employment Industries by Sex in High Bridge borough
The High Bridge borough industries that see more men than women are Agriculture, Fishing & Hunting (100.0%), Construction (100.0%), and Utilities (100.0%), whereas the industries that tend to have a higher number of women are Mining, Quarrying, & Extraction (100.0%), Real Estate, Rental & Leasing (100.0%), and Health Care & Social Assistance (81.1%).
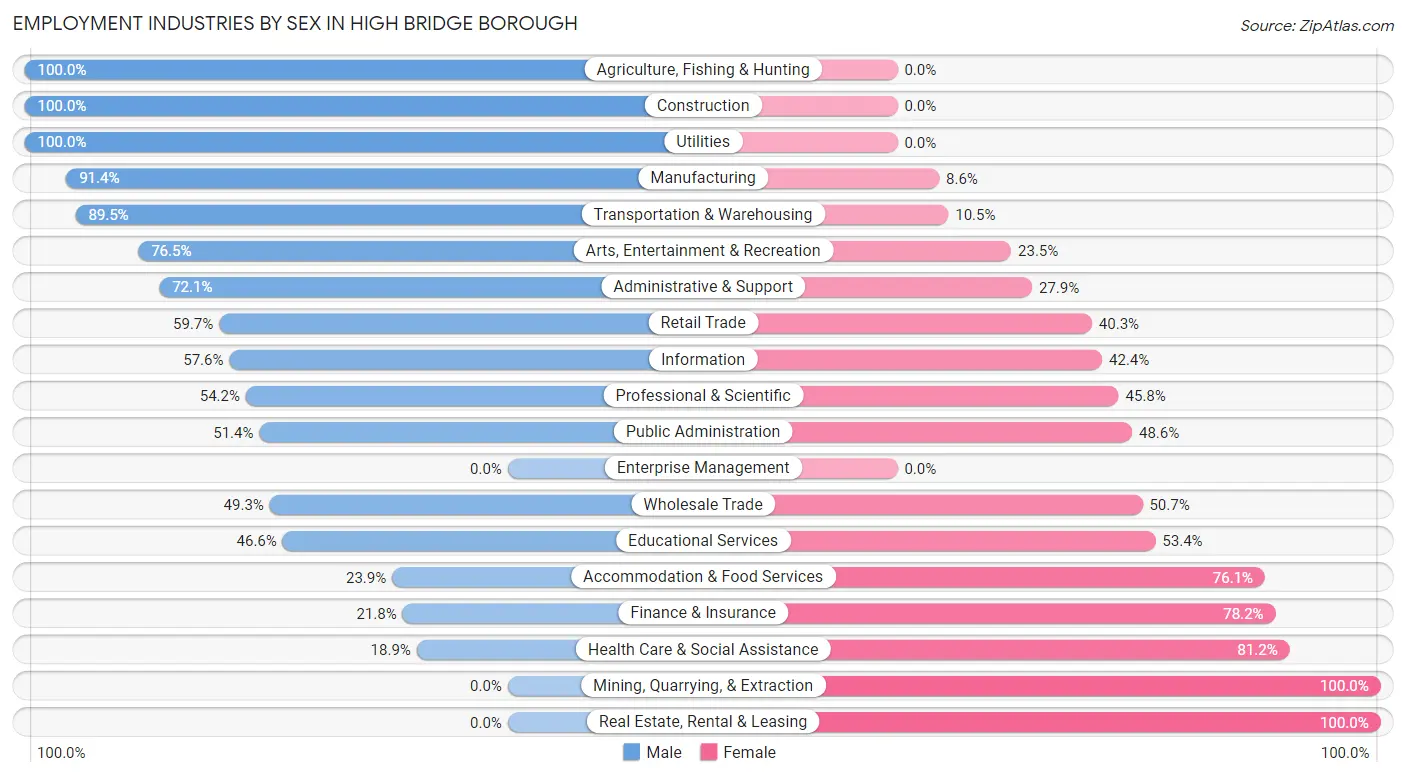
| Industry | Male | Female |
| Agriculture, Fishing & Hunting | 35 (100.0%) | 0 (0.0%) |
| Mining, Quarrying, & Extraction | 0 (0.0%) | 12 (100.0%) |
| Construction | 136 (100.0%) | 0 (0.0%) |
| Manufacturing | 106 (91.4%) | 10 (8.6%) |
| Wholesale Trade | 34 (49.3%) | 35 (50.7%) |
| Retail Trade | 92 (59.7%) | 62 (40.3%) |
| Transportation & Warehousing | 119 (89.5%) | 14 (10.5%) |
| Utilities | 9 (100.0%) | 0 (0.0%) |
| Information | 34 (57.6%) | 25 (42.4%) |
| Finance & Insurance | 27 (21.8%) | 97 (78.2%) |
| Real Estate, Rental & Leasing | 0 (0.0%) | 9 (100.0%) |
| Professional & Scientific | 90 (54.2%) | 76 (45.8%) |
| Enterprise Management | 0 (0.0%) | 0 (0.0%) |
| Administrative & Support | 44 (72.1%) | 17 (27.9%) |
| Educational Services | 96 (46.6%) | 110 (53.4%) |
| Health Care & Social Assistance | 36 (18.9%) | 155 (81.1%) |
| Arts, Entertainment & Recreation | 39 (76.5%) | 12 (23.5%) |
| Accommodation & Food Services | 17 (23.9%) | 54 (76.1%) |
| Public Administration | 36 (51.4%) | 34 (48.6%) |
| Total | 990 (53.5%) | 861 (46.5%) |
Education in High Bridge borough
School Enrollment in High Bridge borough
The most common levels of schooling among the 914 students in High Bridge borough are college / undergraduate (276 | 30.2%), high school (253 | 27.7%), and elementary school (145 | 15.9%).
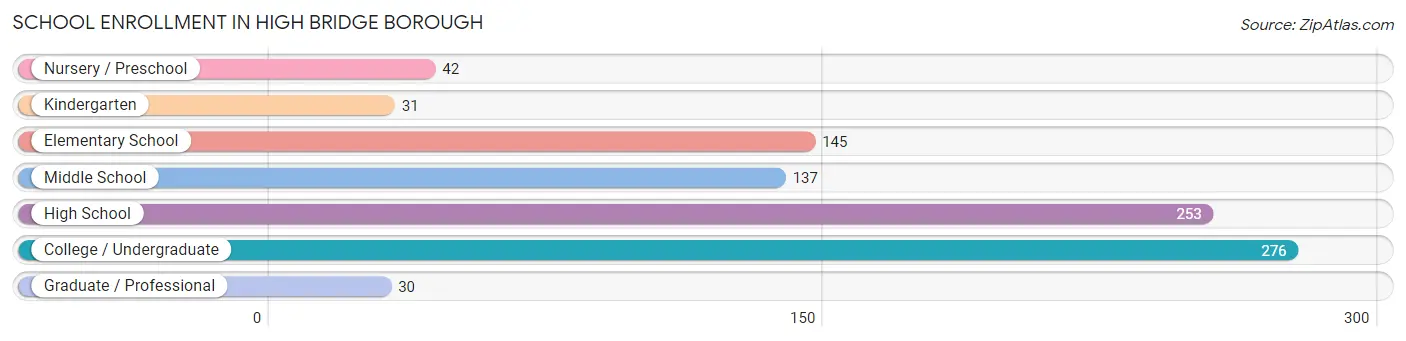
| School Level | # Students | % Students |
| Nursery / Preschool | 42 | 4.6% |
| Kindergarten | 31 | 3.4% |
| Elementary School | 145 | 15.9% |
| Middle School | 137 | 15.0% |
| High School | 253 | 27.7% |
| College / Undergraduate | 276 | 30.2% |
| Graduate / Professional | 30 | 3.3% |
| Total | 914 | 100.0% |
School Enrollment by Age by Funding Source in High Bridge borough
Out of a total of 914 students who are enrolled in schools in High Bridge borough, 203 (22.2%) attend a private institution, while the remaining 711 (77.8%) are enrolled in public schools. The age group of 35 years and over has the highest likelihood of being enrolled in private schools, with 42 (100.0% in the age bracket) enrolled. Conversely, the age group of 18 to 19 year olds has the lowest likelihood of being enrolled in a private school, with 145 (100.0% in the age bracket) attending a public institution.
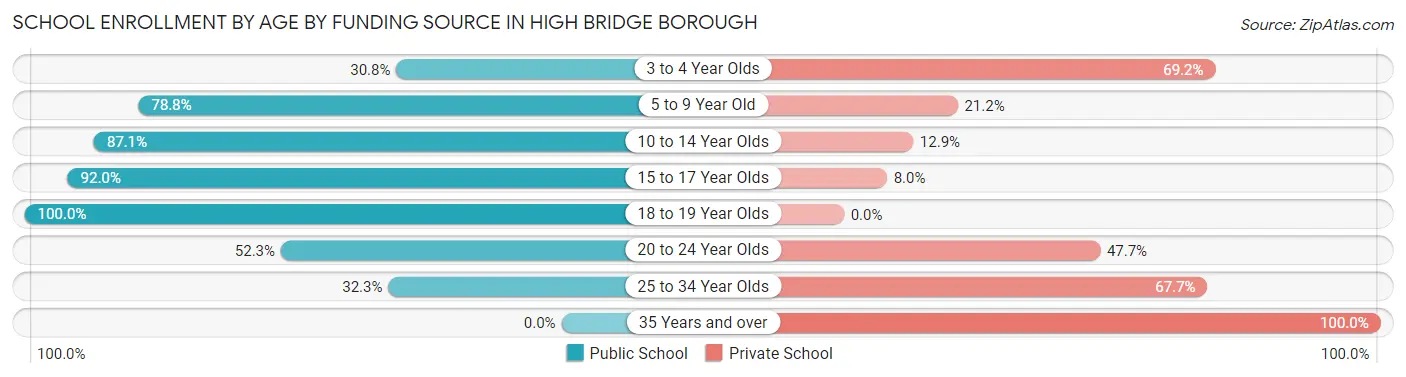
| Age Bracket | Public School | Private School |
| 3 to 4 Year Olds | 8 (30.8%) | 18 (69.2%) |
| 5 to 9 Year Old | 145 (78.8%) | 39 (21.2%) |
| 10 to 14 Year Olds | 162 (87.1%) | 24 (12.9%) |
| 15 to 17 Year Olds | 195 (92.0%) | 17 (8.0%) |
| 18 to 19 Year Olds | 145 (100.0%) | 0 (0.0%) |
| 20 to 24 Year Olds | 46 (52.3%) | 42 (47.7%) |
| 25 to 34 Year Olds | 10 (32.3%) | 21 (67.7%) |
| 35 Years and over | 0 (0.0%) | 42 (100.0%) |
| Total | 711 (77.8%) | 203 (22.2%) |
Educational Attainment by Field of Study in High Bridge borough
Education (161 | 12.9%), business (147 | 11.8%), bio, nature & agricultural (135 | 10.8%), engineering (134 | 10.7%), and physical & health sciences (100 | 8.0%) are the most common fields of study among 1,246 individuals in High Bridge borough who have obtained a bachelor's degree or higher.
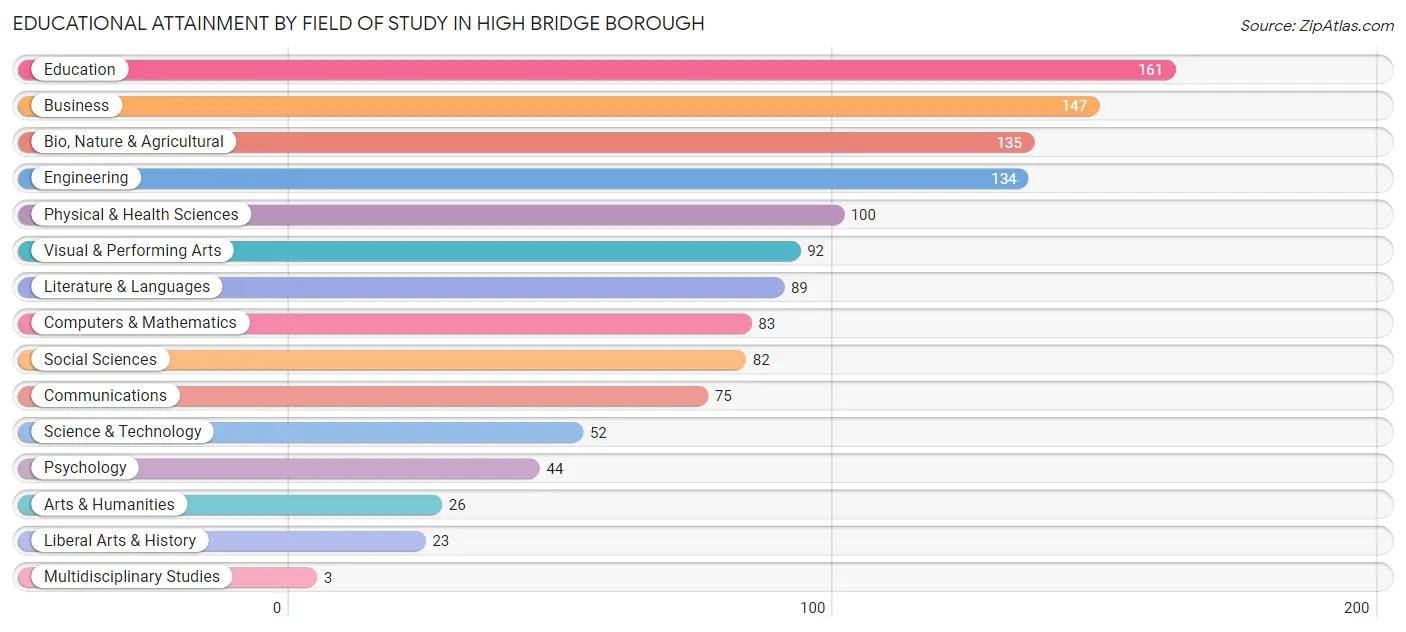
| Field of Study | # Graduates | % Graduates |
| Computers & Mathematics | 83 | 6.7% |
| Bio, Nature & Agricultural | 135 | 10.8% |
| Physical & Health Sciences | 100 | 8.0% |
| Psychology | 44 | 3.5% |
| Social Sciences | 82 | 6.6% |
| Engineering | 134 | 10.7% |
| Multidisciplinary Studies | 3 | 0.2% |
| Science & Technology | 52 | 4.2% |
| Business | 147 | 11.8% |
| Education | 161 | 12.9% |
| Literature & Languages | 89 | 7.1% |
| Liberal Arts & History | 23 | 1.8% |
| Visual & Performing Arts | 92 | 7.4% |
| Communications | 75 | 6.0% |
| Arts & Humanities | 26 | 2.1% |
| Total | 1,246 | 100.0% |
Transportation & Commute in High Bridge borough
Vehicle Availability by Sex in High Bridge borough
The most prevalent vehicle ownership categories in High Bridge borough are males with 2 vehicles (496, accounting for 50.1%) and females with 2 vehicles (359, making up 57.6%).
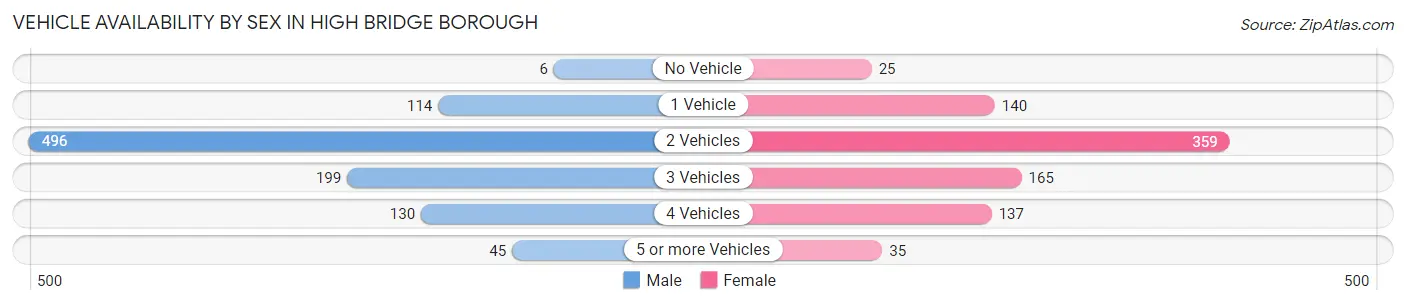
| Vehicles Available | Male | Female |
| No Vehicle | 6 (0.6%) | 25 (2.9%) |
| 1 Vehicle | 114 (11.5%) | 140 (16.3%) |
| 2 Vehicles | 496 (50.1%) | 359 (41.7%) |
| 3 Vehicles | 199 (20.1%) | 165 (19.2%) |
| 4 Vehicles | 130 (13.1%) | 137 (15.9%) |
| 5 or more Vehicles | 45 (4.5%) | 35 (4.1%) |
| Total | 990 (100.0%) | 861 (100.0%) |
Commute Time in High Bridge borough
The most frequently occuring commute durations in High Bridge borough are 45 to 59 minutes (234 commuters, 14.5%), 20 to 24 minutes (214 commuters, 13.2%), and 60 to 89 minutes (199 commuters, 12.3%).
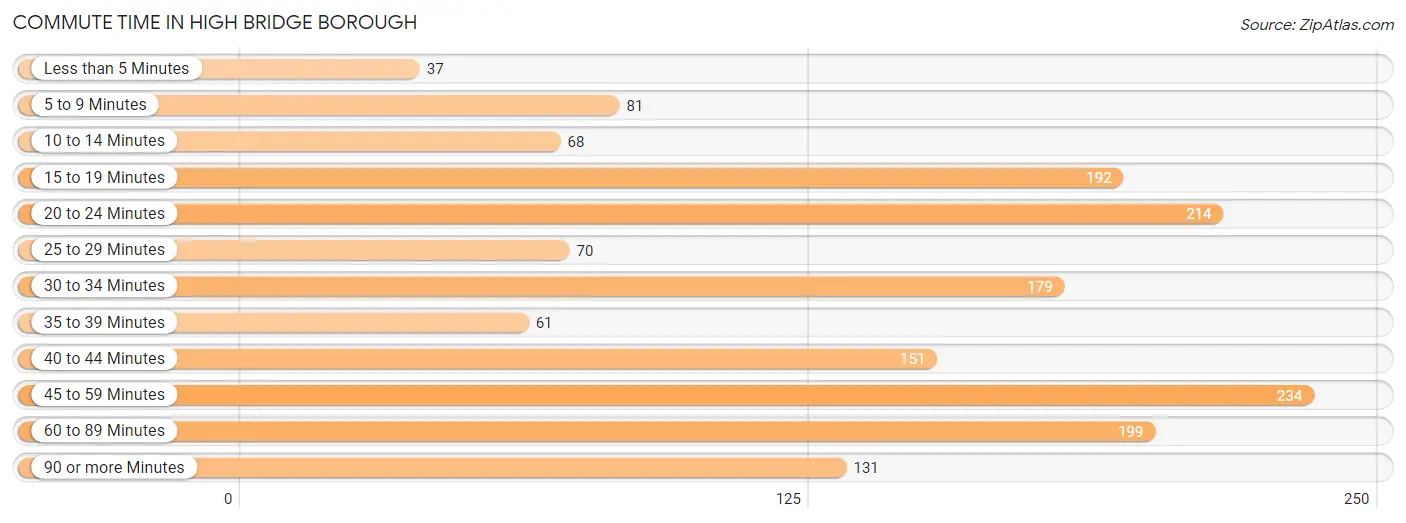
| Commute Time | # Commuters | % Commuters |
| Less than 5 Minutes | 37 | 2.3% |
| 5 to 9 Minutes | 81 | 5.0% |
| 10 to 14 Minutes | 68 | 4.2% |
| 15 to 19 Minutes | 192 | 11.9% |
| 20 to 24 Minutes | 214 | 13.2% |
| 25 to 29 Minutes | 70 | 4.3% |
| 30 to 34 Minutes | 179 | 11.1% |
| 35 to 39 Minutes | 61 | 3.8% |
| 40 to 44 Minutes | 151 | 9.3% |
| 45 to 59 Minutes | 234 | 14.5% |
| 60 to 89 Minutes | 199 | 12.3% |
| 90 or more Minutes | 131 | 8.1% |
Commute Time by Sex in High Bridge borough
The most common commute times in High Bridge borough are 20 to 24 minutes (166 commuters, 18.5%) for males and 60 to 89 minutes (115 commuters, 16.0%) for females.
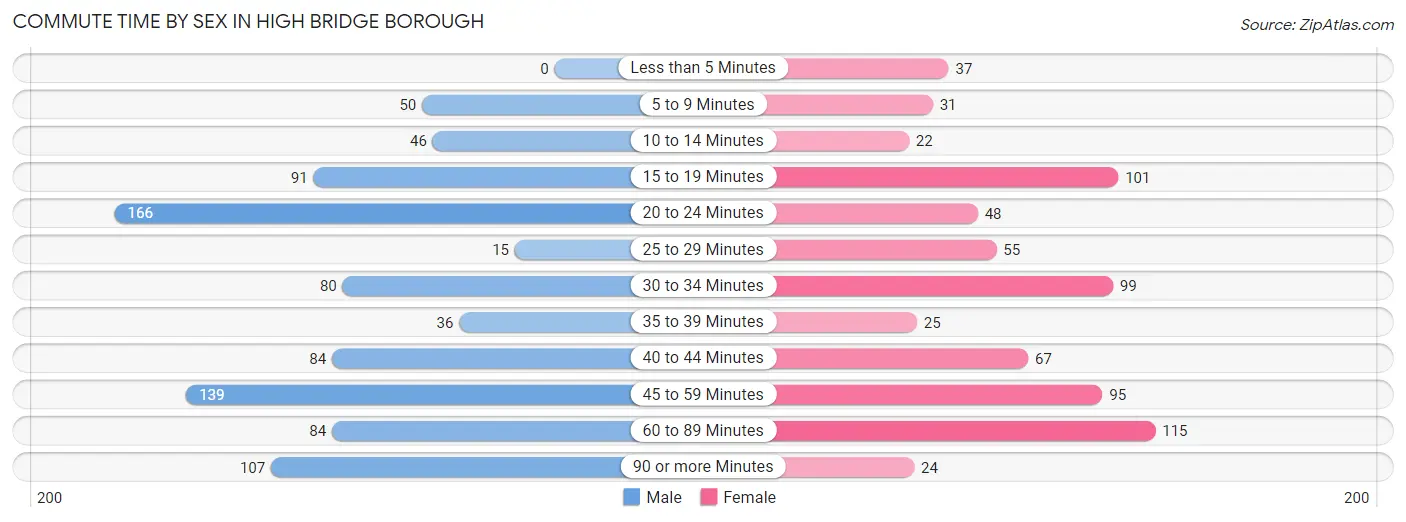
| Commute Time | Male | Female |
| Less than 5 Minutes | 0 (0.0%) | 37 (5.1%) |
| 5 to 9 Minutes | 50 (5.6%) | 31 (4.3%) |
| 10 to 14 Minutes | 46 (5.1%) | 22 (3.1%) |
| 15 to 19 Minutes | 91 (10.1%) | 101 (14.1%) |
| 20 to 24 Minutes | 166 (18.5%) | 48 (6.7%) |
| 25 to 29 Minutes | 15 (1.7%) | 55 (7.6%) |
| 30 to 34 Minutes | 80 (8.9%) | 99 (13.8%) |
| 35 to 39 Minutes | 36 (4.0%) | 25 (3.5%) |
| 40 to 44 Minutes | 84 (9.3%) | 67 (9.3%) |
| 45 to 59 Minutes | 139 (15.5%) | 95 (13.2%) |
| 60 to 89 Minutes | 84 (9.3%) | 115 (16.0%) |
| 90 or more Minutes | 107 (11.9%) | 24 (3.3%) |
Time of Departure to Work by Sex in High Bridge borough
The most frequent times of departure to work in High Bridge borough are 7:00 AM to 7:29 AM (124, 13.8%) for males and 7:30 AM to 7:59 AM (123, 17.1%) for females.
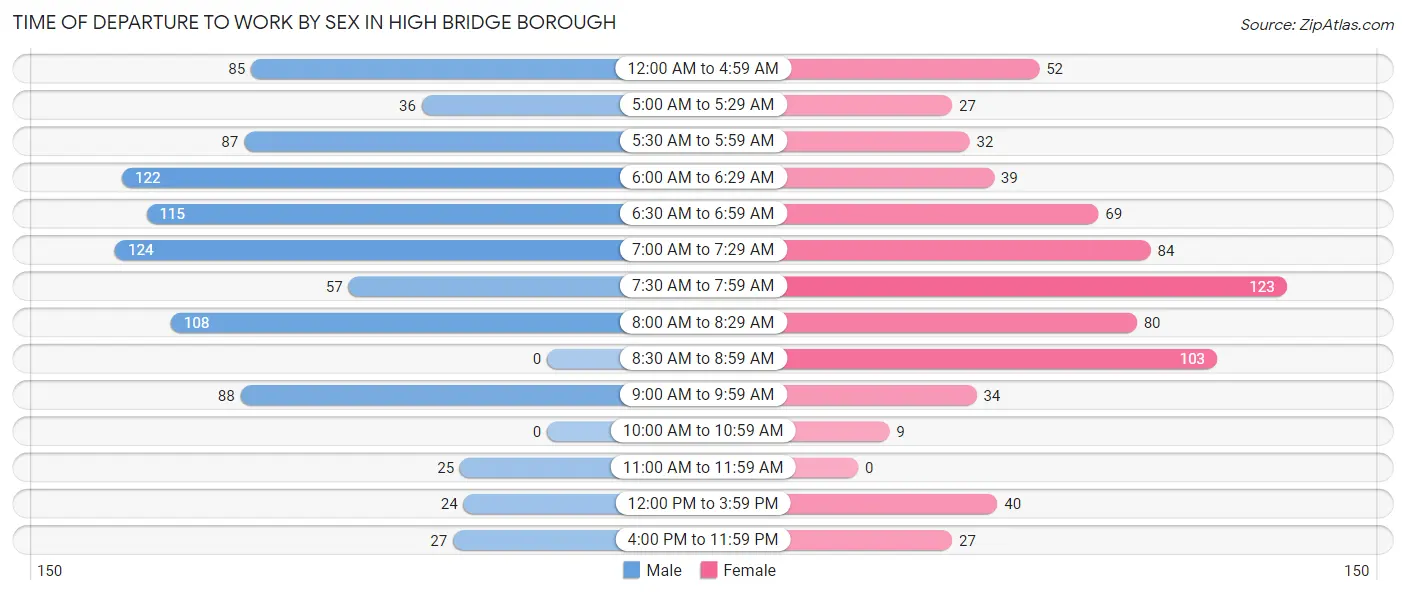
| Time of Departure | Male | Female |
| 12:00 AM to 4:59 AM | 85 (9.5%) | 52 (7.2%) |
| 5:00 AM to 5:29 AM | 36 (4.0%) | 27 (3.8%) |
| 5:30 AM to 5:59 AM | 87 (9.7%) | 32 (4.4%) |
| 6:00 AM to 6:29 AM | 122 (13.6%) | 39 (5.4%) |
| 6:30 AM to 6:59 AM | 115 (12.8%) | 69 (9.6%) |
| 7:00 AM to 7:29 AM | 124 (13.8%) | 84 (11.7%) |
| 7:30 AM to 7:59 AM | 57 (6.4%) | 123 (17.1%) |
| 8:00 AM to 8:29 AM | 108 (12.0%) | 80 (11.1%) |
| 8:30 AM to 8:59 AM | 0 (0.0%) | 103 (14.3%) |
| 9:00 AM to 9:59 AM | 88 (9.8%) | 34 (4.7%) |
| 10:00 AM to 10:59 AM | 0 (0.0%) | 9 (1.3%) |
| 11:00 AM to 11:59 AM | 25 (2.8%) | 0 (0.0%) |
| 12:00 PM to 3:59 PM | 24 (2.7%) | 40 (5.6%) |
| 4:00 PM to 11:59 PM | 27 (3.0%) | 27 (3.8%) |
| Total | 898 (100.0%) | 719 (100.0%) |
Housing Occupancy in High Bridge borough
Occupancy by Ownership in High Bridge borough
Of the total 1,436 dwellings in High Bridge borough, owner-occupied units account for 1,108 (77.2%), while renter-occupied units make up 328 (22.8%).
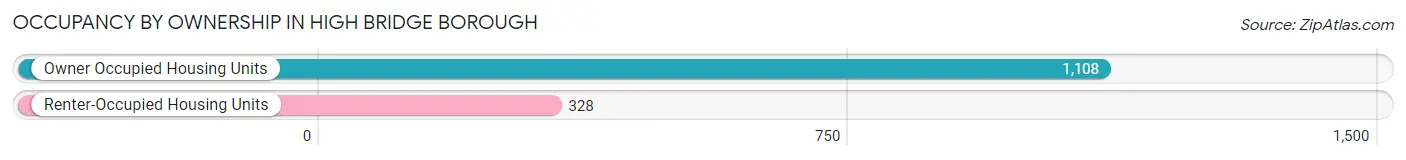
| Occupancy | # Housing Units | % Housing Units |
| Owner Occupied Housing Units | 1,108 | 77.2% |
| Renter-Occupied Housing Units | 328 | 22.8% |
| Total Occupied Housing Units | 1,436 | 100.0% |
Occupancy by Household Size in High Bridge borough
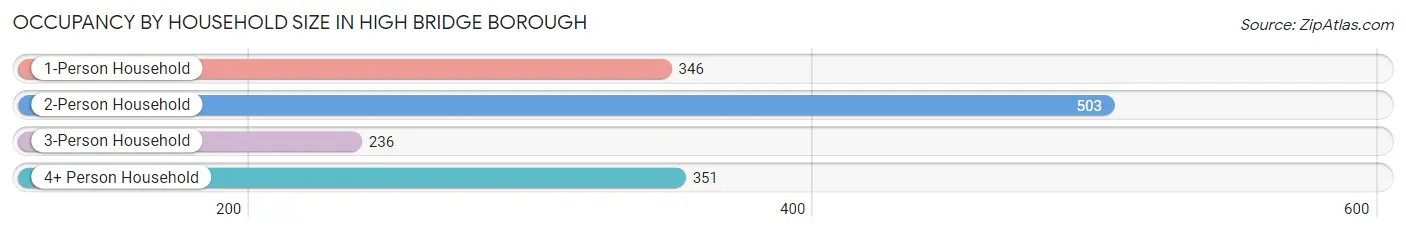
| Household Size | # Housing Units | % Housing Units |
| 1-Person Household | 346 | 24.1% |
| 2-Person Household | 503 | 35.0% |
| 3-Person Household | 236 | 16.4% |
| 4+ Person Household | 351 | 24.4% |
| Total Housing Units | 1,436 | 100.0% |
Occupancy by Ownership by Household Size in High Bridge borough
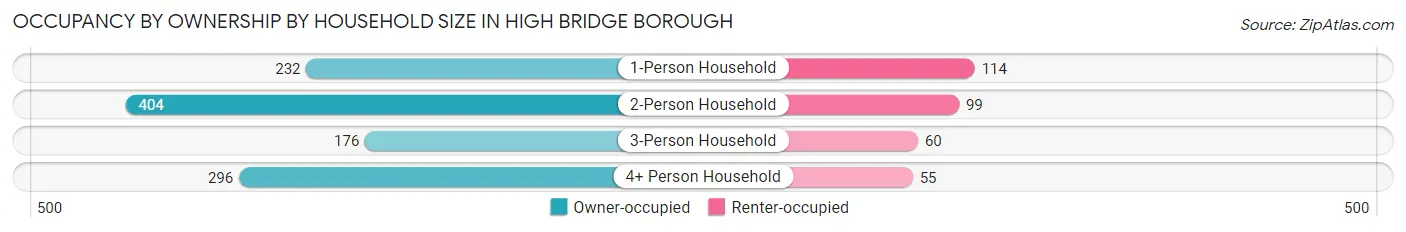
| Household Size | Owner-occupied | Renter-occupied |
| 1-Person Household | 232 (67.0%) | 114 (33.0%) |
| 2-Person Household | 404 (80.3%) | 99 (19.7%) |
| 3-Person Household | 176 (74.6%) | 60 (25.4%) |
| 4+ Person Household | 296 (84.3%) | 55 (15.7%) |
| Total Housing Units | 1,108 (77.2%) | 328 (22.8%) |
Occupancy by Educational Attainment in High Bridge borough
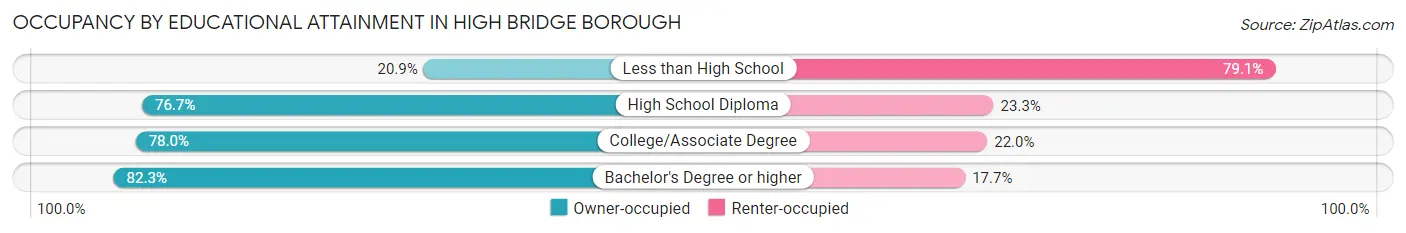
| Household Size | Owner-occupied | Renter-occupied |
| Less than High School | 14 (20.9%) | 53 (79.1%) |
| High School Diploma | 247 (76.7%) | 75 (23.3%) |
| College/Associate Degree | 269 (78.0%) | 76 (22.0%) |
| Bachelor's Degree or higher | 578 (82.3%) | 124 (17.7%) |
Occupancy by Age of Householder in High Bridge borough
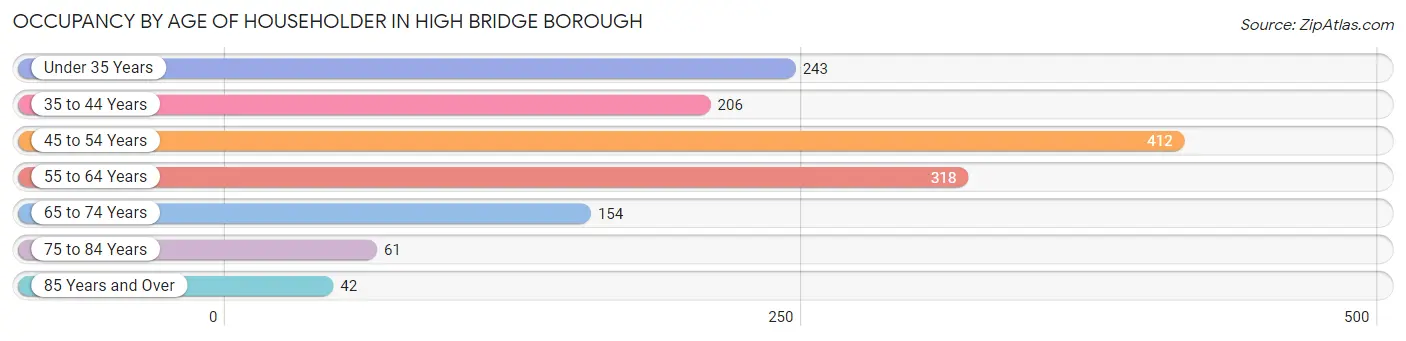
| Age Bracket | # Households | % Households |
| Under 35 Years | 243 | 16.9% |
| 35 to 44 Years | 206 | 14.3% |
| 45 to 54 Years | 412 | 28.7% |
| 55 to 64 Years | 318 | 22.1% |
| 65 to 74 Years | 154 | 10.7% |
| 75 to 84 Years | 61 | 4.3% |
| 85 Years and Over | 42 | 2.9% |
| Total | 1,436 | 100.0% |
Housing Finances in High Bridge borough
Median Income by Occupancy in High Bridge borough
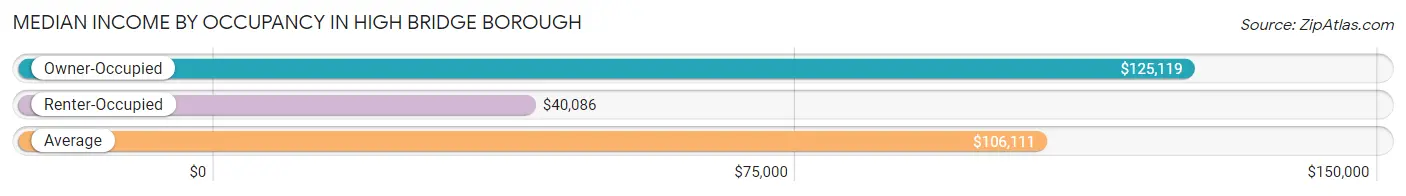
| Occupancy Type | # Households | Median Income |
| Owner-Occupied | 1,108 (77.2%) | $125,119 |
| Renter-Occupied | 328 (22.8%) | $40,086 |
| Average | 1,436 (100.0%) | $106,111 |
Occupancy by Householder Income Bracket in High Bridge borough
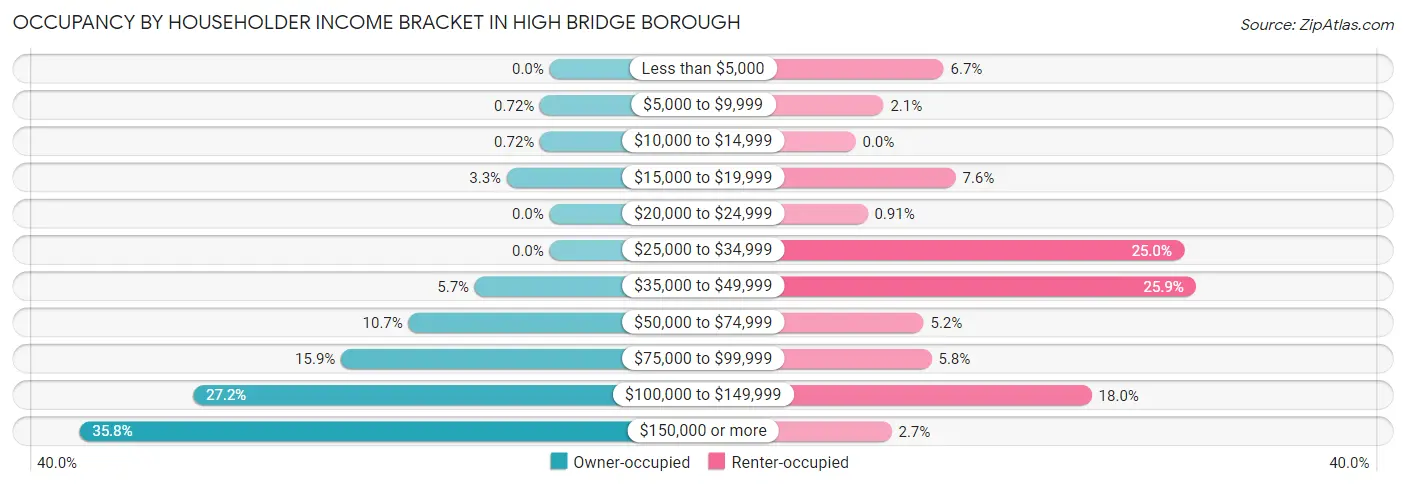
| Income Bracket | Owner-occupied | Renter-occupied |
| Less than $5,000 | 0 (0.0%) | 22 (6.7%) |
| $5,000 to $9,999 | 8 (0.7%) | 7 (2.1%) |
| $10,000 to $14,999 | 8 (0.7%) | 0 (0.0%) |
| $15,000 to $19,999 | 36 (3.3%) | 25 (7.6%) |
| $20,000 to $24,999 | 0 (0.0%) | 3 (0.9%) |
| $25,000 to $34,999 | 0 (0.0%) | 82 (25.0%) |
| $35,000 to $49,999 | 63 (5.7%) | 85 (25.9%) |
| $50,000 to $74,999 | 119 (10.7%) | 17 (5.2%) |
| $75,000 to $99,999 | 176 (15.9%) | 19 (5.8%) |
| $100,000 to $149,999 | 301 (27.2%) | 59 (18.0%) |
| $150,000 or more | 397 (35.8%) | 9 (2.7%) |
| Total | 1,108 (100.0%) | 328 (100.0%) |
Monthly Housing Cost Tiers in High Bridge borough
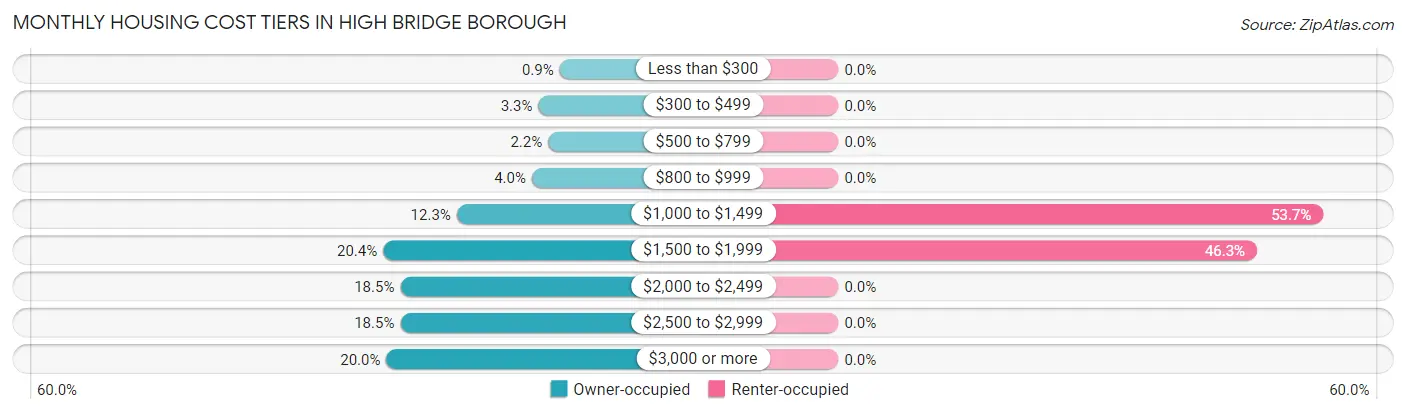
| Monthly Cost | Owner-occupied | Renter-occupied |
| Less than $300 | 10 (0.9%) | 0 (0.0%) |
| $300 to $499 | 36 (3.3%) | 0 (0.0%) |
| $500 to $799 | 24 (2.2%) | 0 (0.0%) |
| $800 to $999 | 44 (4.0%) | 0 (0.0%) |
| $1,000 to $1,499 | 136 (12.3%) | 176 (53.7%) |
| $1,500 to $1,999 | 226 (20.4%) | 152 (46.3%) |
| $2,000 to $2,499 | 205 (18.5%) | 0 (0.0%) |
| $2,500 to $2,999 | 205 (18.5%) | 0 (0.0%) |
| $3,000 or more | 222 (20.0%) | 0 (0.0%) |
| Total | 1,108 (100.0%) | 328 (100.0%) |
Physical Housing Characteristics in High Bridge borough
Housing Structures in High Bridge borough
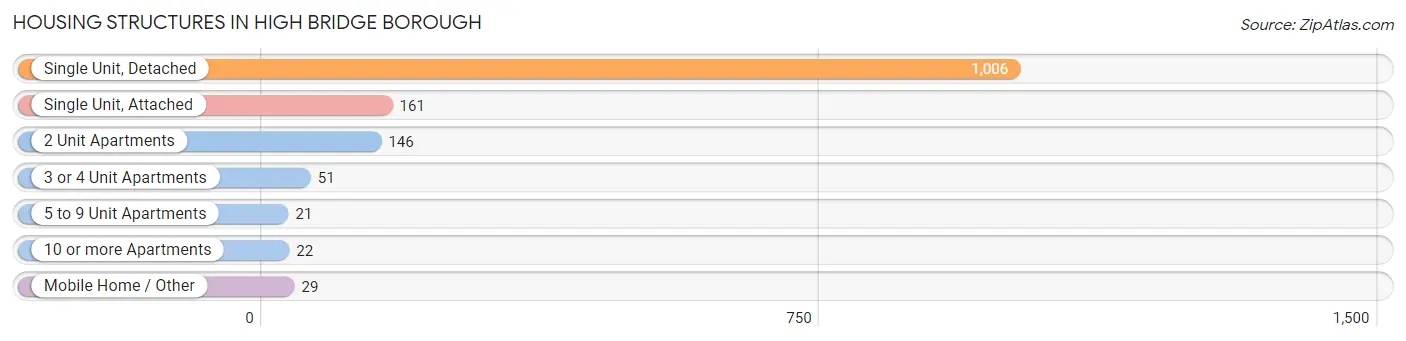
| Structure Type | # Housing Units | % Housing Units |
| Single Unit, Detached | 1,006 | 70.1% |
| Single Unit, Attached | 161 | 11.2% |
| 2 Unit Apartments | 146 | 10.2% |
| 3 or 4 Unit Apartments | 51 | 3.5% |
| 5 to 9 Unit Apartments | 21 | 1.5% |
| 10 or more Apartments | 22 | 1.5% |
| Mobile Home / Other | 29 | 2.0% |
| Total | 1,436 | 100.0% |
Housing Structures by Occupancy in High Bridge borough
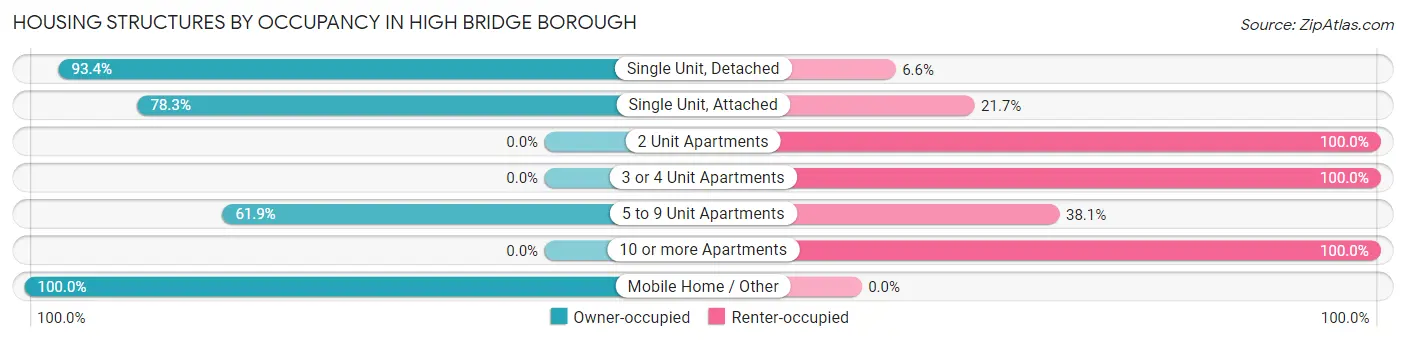
| Structure Type | Owner-occupied | Renter-occupied |
| Single Unit, Detached | 940 (93.4%) | 66 (6.6%) |
| Single Unit, Attached | 126 (78.3%) | 35 (21.7%) |
| 2 Unit Apartments | 0 (0.0%) | 146 (100.0%) |
| 3 or 4 Unit Apartments | 0 (0.0%) | 51 (100.0%) |
| 5 to 9 Unit Apartments | 13 (61.9%) | 8 (38.1%) |
| 10 or more Apartments | 0 (0.0%) | 22 (100.0%) |
| Mobile Home / Other | 29 (100.0%) | 0 (0.0%) |
| Total | 1,108 (77.2%) | 328 (22.8%) |
Housing Structures by Number of Rooms in High Bridge borough
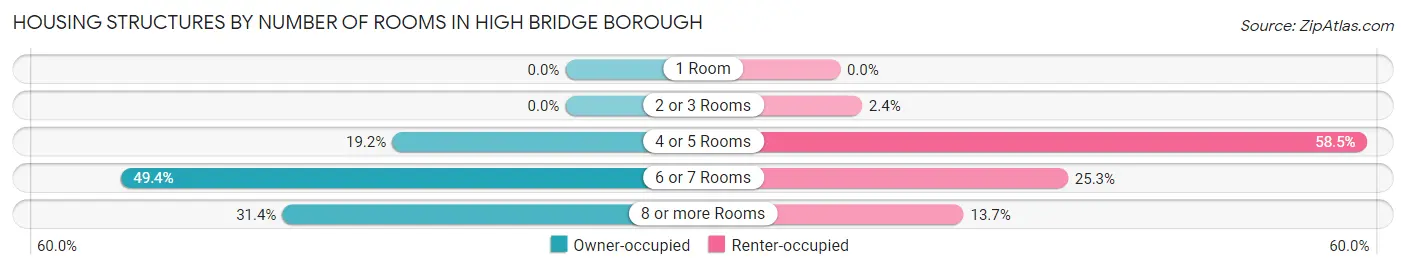
| Number of Rooms | Owner-occupied | Renter-occupied |
| 1 Room | 0 (0.0%) | 0 (0.0%) |
| 2 or 3 Rooms | 0 (0.0%) | 8 (2.4%) |
| 4 or 5 Rooms | 213 (19.2%) | 192 (58.5%) |
| 6 or 7 Rooms | 547 (49.4%) | 83 (25.3%) |
| 8 or more Rooms | 348 (31.4%) | 45 (13.7%) |
| Total | 1,108 (100.0%) | 328 (100.0%) |
Housing Structure by Heating Type in High Bridge borough
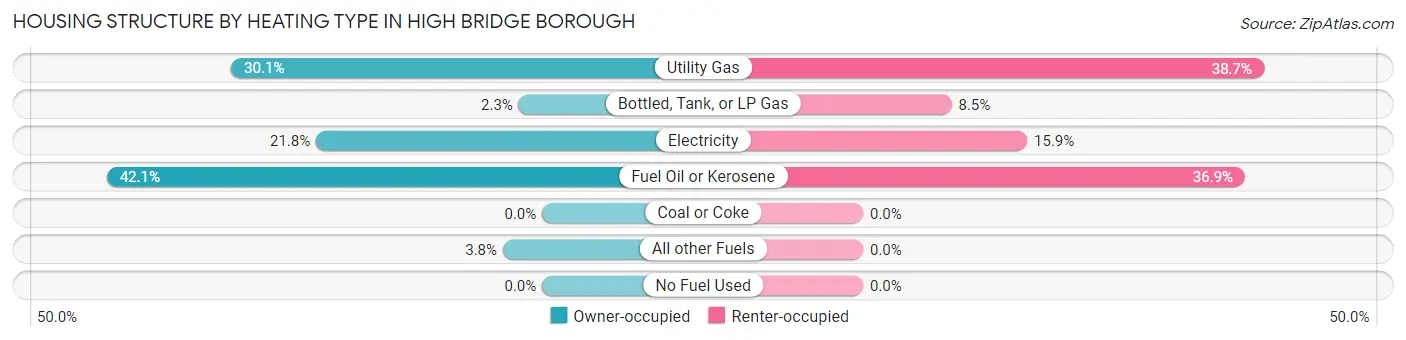
| Heating Type | Owner-occupied | Renter-occupied |
| Utility Gas | 333 (30.0%) | 127 (38.7%) |
| Bottled, Tank, or LP Gas | 25 (2.3%) | 28 (8.5%) |
| Electricity | 242 (21.8%) | 52 (15.9%) |
| Fuel Oil or Kerosene | 466 (42.1%) | 121 (36.9%) |
| Coal or Coke | 0 (0.0%) | 0 (0.0%) |
| All other Fuels | 42 (3.8%) | 0 (0.0%) |
| No Fuel Used | 0 (0.0%) | 0 (0.0%) |
| Total | 1,108 (100.0%) | 328 (100.0%) |
Household Vehicle Usage in High Bridge borough
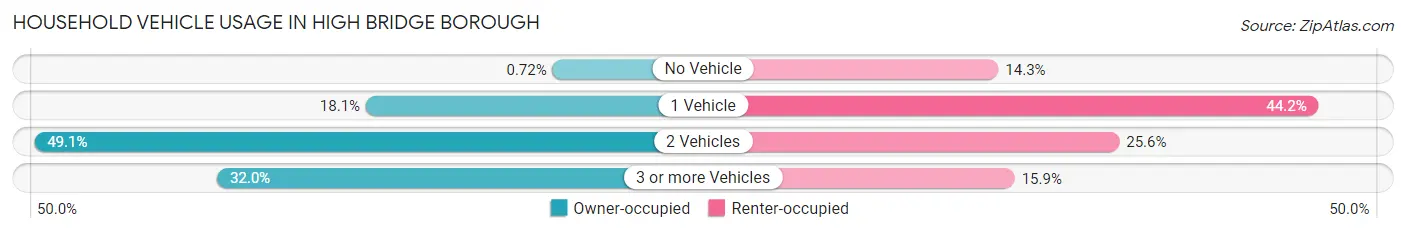
| Vehicles per Household | Owner-occupied | Renter-occupied |
| No Vehicle | 8 (0.7%) | 47 (14.3%) |
| 1 Vehicle | 201 (18.1%) | 145 (44.2%) |
| 2 Vehicles | 544 (49.1%) | 84 (25.6%) |
| 3 or more Vehicles | 355 (32.0%) | 52 (15.9%) |
| Total | 1,108 (100.0%) | 328 (100.0%) |
Real Estate & Mortgages in High Bridge borough
Real Estate and Mortgage Overview in High Bridge borough
| Characteristic | Without Mortgage | With Mortgage |
| Housing Units | 253 | 855 |
| Median Property Value | $308,100 | $294,000 |
| Median Household Income | $95,750 | $333 |
| Monthly Housing Costs | $1,233 | $222 |
| Real Estate Taxes | $10,000 | $25 |
Property Value by Mortgage Status in High Bridge borough
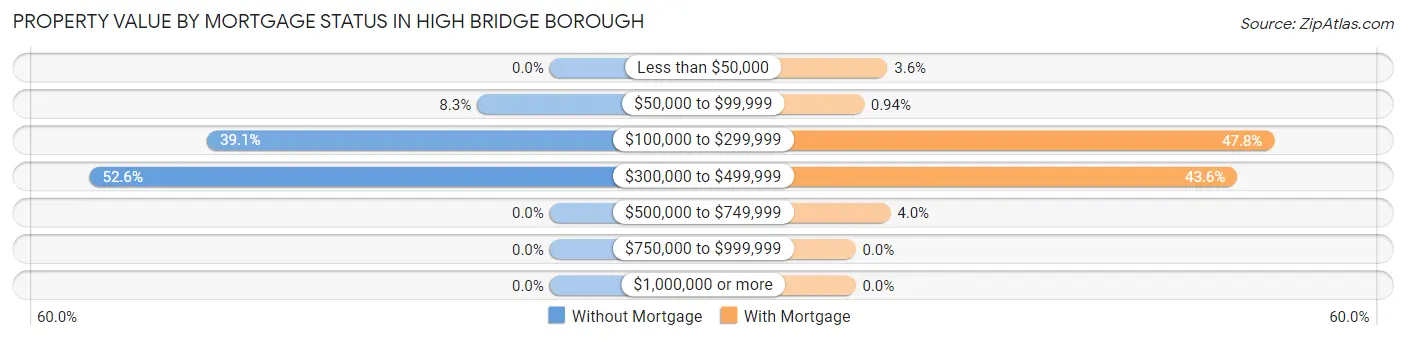
| Property Value | Without Mortgage | With Mortgage |
| Less than $50,000 | 0 (0.0%) | 31 (3.6%) |
| $50,000 to $99,999 | 21 (8.3%) | 8 (0.9%) |
| $100,000 to $299,999 | 99 (39.1%) | 409 (47.8%) |
| $300,000 to $499,999 | 133 (52.6%) | 373 (43.6%) |
| $500,000 to $749,999 | 0 (0.0%) | 34 (4.0%) |
| $750,000 to $999,999 | 0 (0.0%) | 0 (0.0%) |
| $1,000,000 or more | 0 (0.0%) | 0 (0.0%) |
| Total | 253 (100.0%) | 855 (100.0%) |
Household Income by Mortgage Status in High Bridge borough
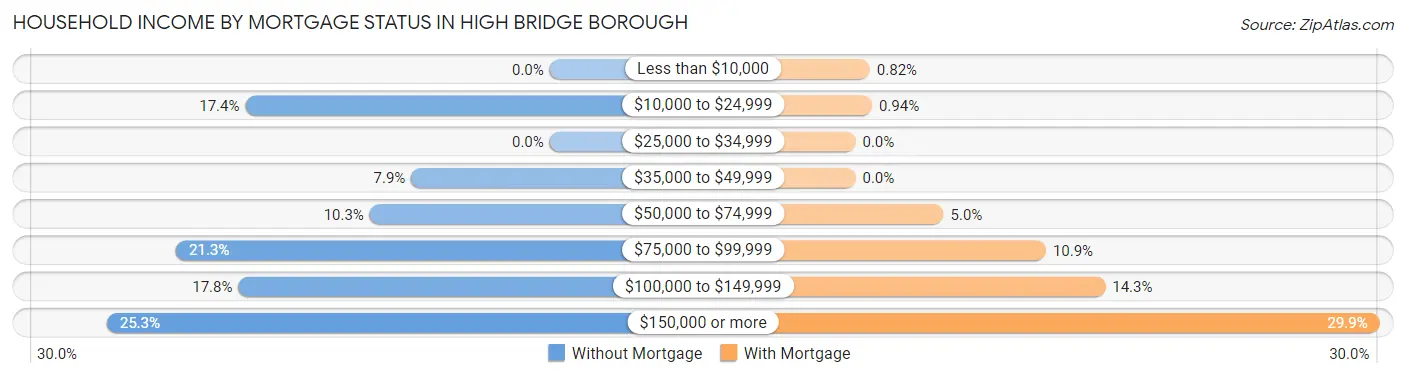
| Household Income | Without Mortgage | With Mortgage |
| Less than $10,000 | 0 (0.0%) | 7 (0.8%) |
| $10,000 to $24,999 | 44 (17.4%) | 8 (0.9%) |
| $25,000 to $34,999 | 0 (0.0%) | 0 (0.0%) |
| $35,000 to $49,999 | 20 (7.9%) | 0 (0.0%) |
| $50,000 to $74,999 | 26 (10.3%) | 43 (5.0%) |
| $75,000 to $99,999 | 54 (21.3%) | 93 (10.9%) |
| $100,000 to $149,999 | 45 (17.8%) | 122 (14.3%) |
| $150,000 or more | 64 (25.3%) | 256 (29.9%) |
| Total | 253 (100.0%) | 855 (100.0%) |
Property Value to Household Income Ratio in High Bridge borough
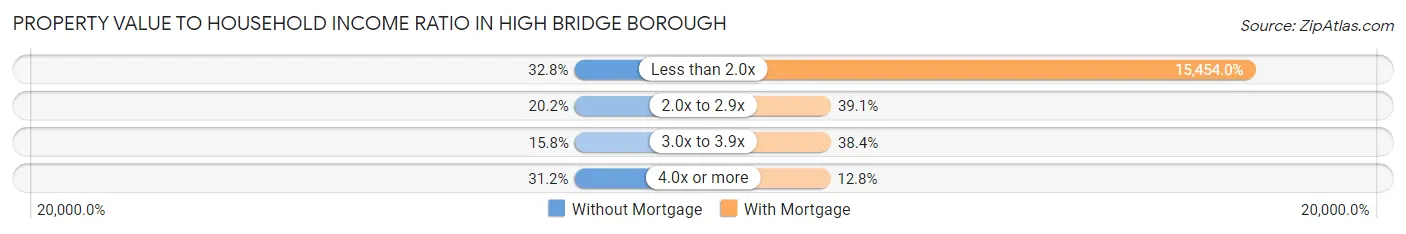
| Value-to-Income Ratio | Without Mortgage | With Mortgage |
| Less than 2.0x | 83 (32.8%) | 132,132 (15,454.0%) |
| 2.0x to 2.9x | 51 (20.2%) | 334 (39.1%) |
| 3.0x to 3.9x | 40 (15.8%) | 328 (38.4%) |
| 4.0x or more | 79 (31.2%) | 109 (12.8%) |
| Total | 253 (100.0%) | 855 (100.0%) |
Real Estate Taxes by Mortgage Status in High Bridge borough
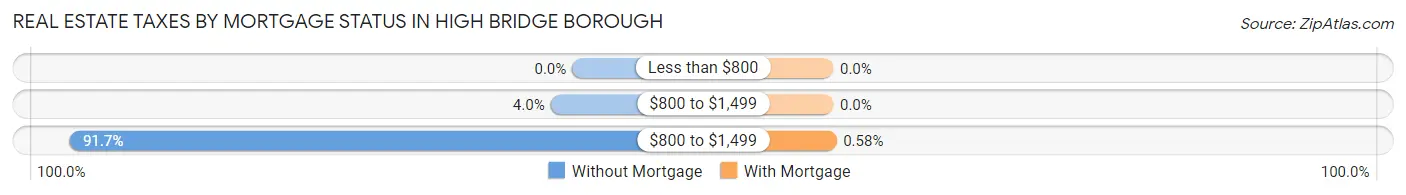
| Property Taxes | Without Mortgage | With Mortgage |
| Less than $800 | 0 (0.0%) | 0 (0.0%) |
| $800 to $1,499 | 10 (4.0%) | 0 (0.0%) |
| $800 to $1,499 | 232 (91.7%) | 5 (0.6%) |
| Total | 253 (100.0%) | 855 (100.0%) |
Health & Disability in High Bridge borough
Health Insurance Coverage by Age in High Bridge borough
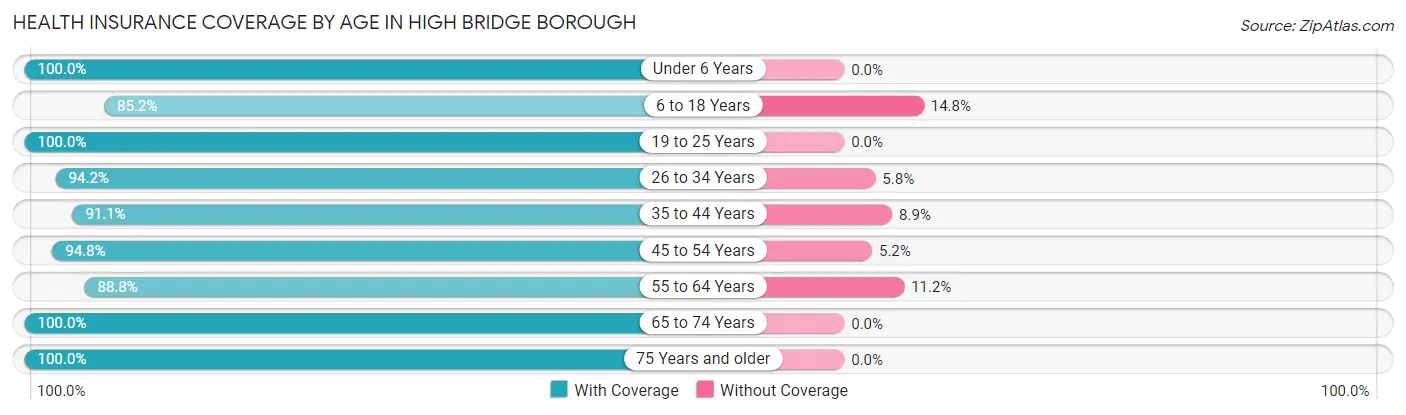
| Age Bracket | With Coverage | Without Coverage |
| Under 6 Years | 190 (100.0%) | 0 (0.0%) |
| 6 to 18 Years | 540 (85.2%) | 94 (14.8%) |
| 19 to 25 Years | 362 (100.0%) | 0 (0.0%) |
| 26 to 34 Years | 325 (94.2%) | 20 (5.8%) |
| 35 to 44 Years | 408 (91.1%) | 40 (8.9%) |
| 45 to 54 Years | 605 (94.8%) | 33 (5.2%) |
| 55 to 64 Years | 485 (88.8%) | 61 (11.2%) |
| 65 to 74 Years | 242 (100.0%) | 0 (0.0%) |
| 75 Years and older | 159 (100.0%) | 0 (0.0%) |
| Total | 3,316 (93.0%) | 248 (7.0%) |
Health Insurance Coverage by Citizenship Status in High Bridge borough
| Citizenship Status | With Coverage | Without Coverage |
| Native Born | 190 (100.0%) | 0 (0.0%) |
| Foreign Born, Citizen | 540 (85.2%) | 94 (14.8%) |
| Foreign Born, not a Citizen | 362 (100.0%) | 0 (0.0%) |
Health Insurance Coverage by Household Income in High Bridge borough
| Household Income | With Coverage | Without Coverage |
| Under $25,000 | 94 (77.0%) | 28 (23.0%) |
| $25,000 to $49,999 | 458 (85.1%) | 80 (14.9%) |
| $50,000 to $74,999 | 385 (91.4%) | 36 (8.6%) |
| $75,000 to $99,999 | 330 (81.3%) | 76 (18.7%) |
| $100,000 and over | 2,049 (98.7%) | 28 (1.3%) |
Public vs Private Health Insurance Coverage by Age in High Bridge borough
| Age Bracket | Public Insurance | Private Insurance |
| Under 6 | 52 (27.4%) | 138 (72.6%) |
| 6 to 18 Years | 197 (31.1%) | 361 (56.9%) |
| 19 to 25 Years | 34 (9.4%) | 328 (90.6%) |
| 25 to 34 Years | 84 (24.3%) | 241 (69.9%) |
| 35 to 44 Years | 33 (7.4%) | 400 (89.3%) |
| 45 to 54 Years | 71 (11.1%) | 580 (90.9%) |
| 55 to 64 Years | 77 (14.1%) | 445 (81.5%) |
| 65 to 74 Years | 216 (89.3%) | 121 (50.0%) |
| 75 Years and over | 159 (100.0%) | 128 (80.5%) |
| Total | 923 (25.9%) | 2,742 (76.9%) |
Disability Status by Sex by Age in High Bridge borough
| Age Bracket | Male | Female |
| Under 5 Years | 0 (0.0%) | 0 (0.0%) |
| 5 to 17 Years | 13 (4.4%) | 10 (3.3%) |
| 18 to 34 Years | 59 (11.6%) | 48 (19.1%) |
| 35 to 64 Years | 73 (9.5%) | 15 (1.7%) |
| 65 to 74 Years | 17 (18.1%) | 17 (11.5%) |
| 75 Years and over | 35 (41.2%) | 36 (48.6%) |
Disability Class by Sex by Age in High Bridge borough
Disability Class: Hearing Difficulty
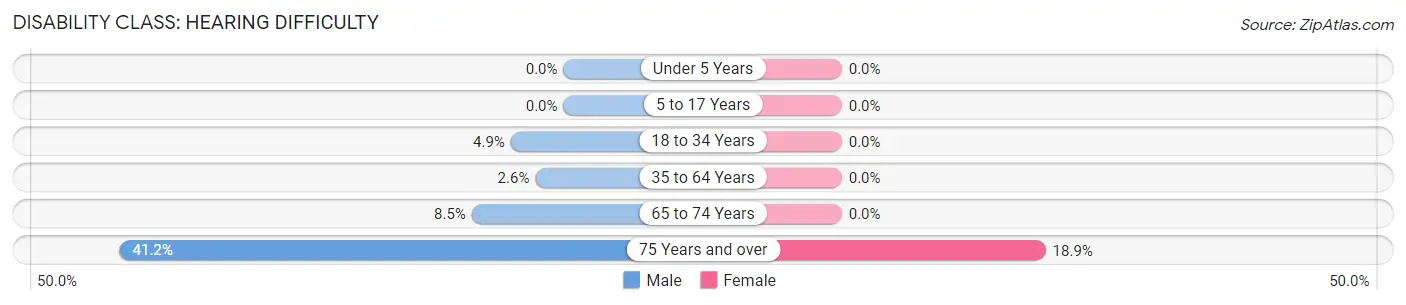
| Age Bracket | Male | Female |
| Under 5 Years | 0 (0.0%) | 0 (0.0%) |
| 5 to 17 Years | 0 (0.0%) | 0 (0.0%) |
| 18 to 34 Years | 25 (4.9%) | 0 (0.0%) |
| 35 to 64 Years | 20 (2.6%) | 0 (0.0%) |
| 65 to 74 Years | 8 (8.5%) | 0 (0.0%) |
| 75 Years and over | 35 (41.2%) | 14 (18.9%) |
Disability Class: Vision Difficulty
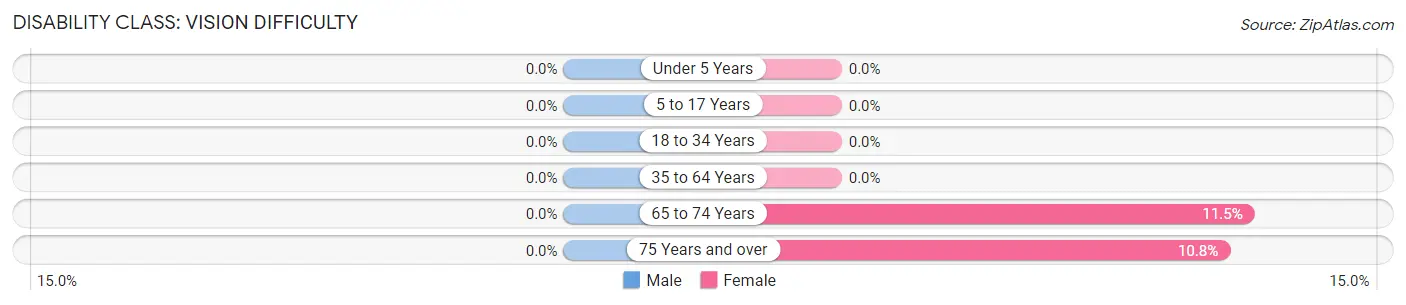
| Age Bracket | Male | Female |
| Under 5 Years | 0 (0.0%) | 0 (0.0%) |
| 5 to 17 Years | 0 (0.0%) | 0 (0.0%) |
| 18 to 34 Years | 0 (0.0%) | 0 (0.0%) |
| 35 to 64 Years | 0 (0.0%) | 0 (0.0%) |
| 65 to 74 Years | 0 (0.0%) | 17 (11.5%) |
| 75 Years and over | 0 (0.0%) | 8 (10.8%) |
Disability Class: Cognitive Difficulty
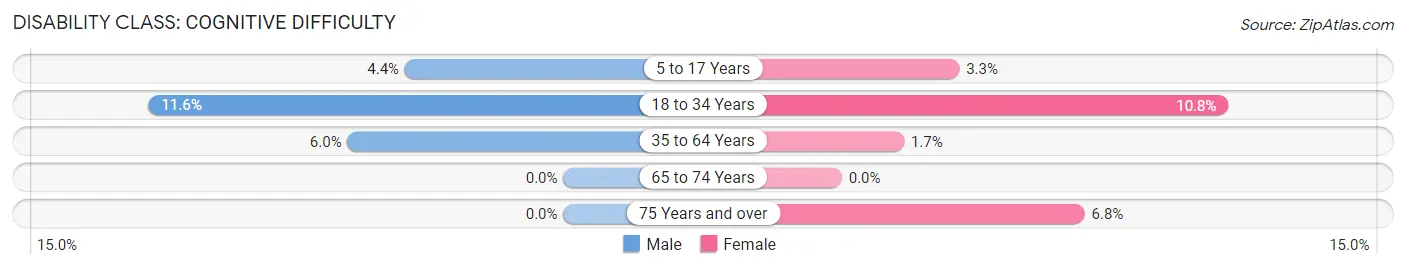
| Age Bracket | Male | Female |
| 5 to 17 Years | 13 (4.4%) | 10 (3.3%) |
| 18 to 34 Years | 59 (11.6%) | 27 (10.8%) |
| 35 to 64 Years | 46 (6.0%) | 15 (1.7%) |
| 65 to 74 Years | 0 (0.0%) | 0 (0.0%) |
| 75 Years and over | 0 (0.0%) | 5 (6.8%) |
Disability Class: Ambulatory Difficulty
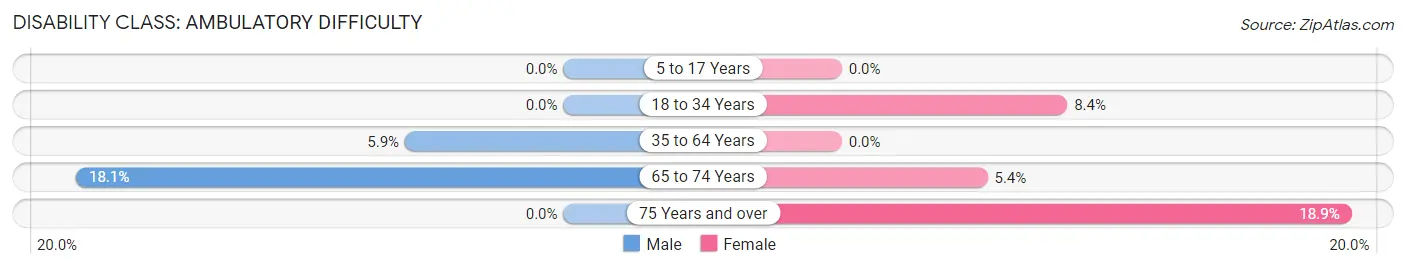
| Age Bracket | Male | Female |
| 5 to 17 Years | 0 (0.0%) | 0 (0.0%) |
| 18 to 34 Years | 0 (0.0%) | 21 (8.4%) |
| 35 to 64 Years | 45 (5.9%) | 0 (0.0%) |
| 65 to 74 Years | 17 (18.1%) | 8 (5.4%) |
| 75 Years and over | 0 (0.0%) | 14 (18.9%) |
Disability Class: Self-Care Difficulty
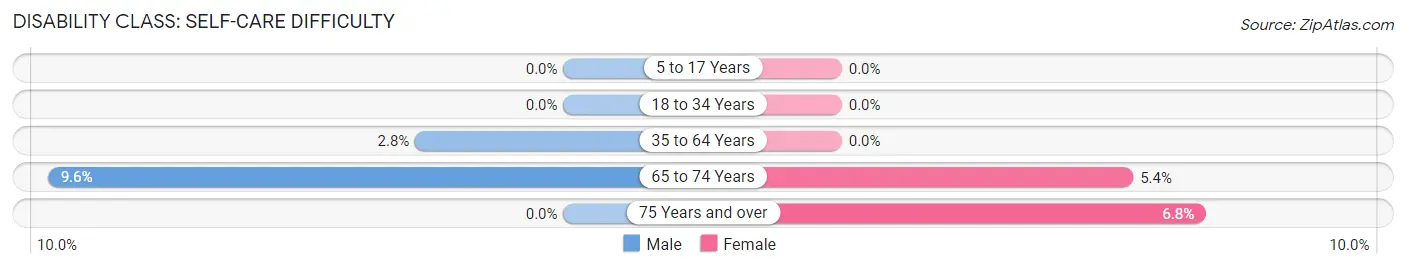
| Age Bracket | Male | Female |
| 5 to 17 Years | 0 (0.0%) | 0 (0.0%) |
| 18 to 34 Years | 0 (0.0%) | 0 (0.0%) |
| 35 to 64 Years | 21 (2.8%) | 0 (0.0%) |
| 65 to 74 Years | 9 (9.6%) | 8 (5.4%) |
| 75 Years and over | 0 (0.0%) | 5 (6.8%) |
Technology Access in High Bridge borough
Computing Device Access in High Bridge borough
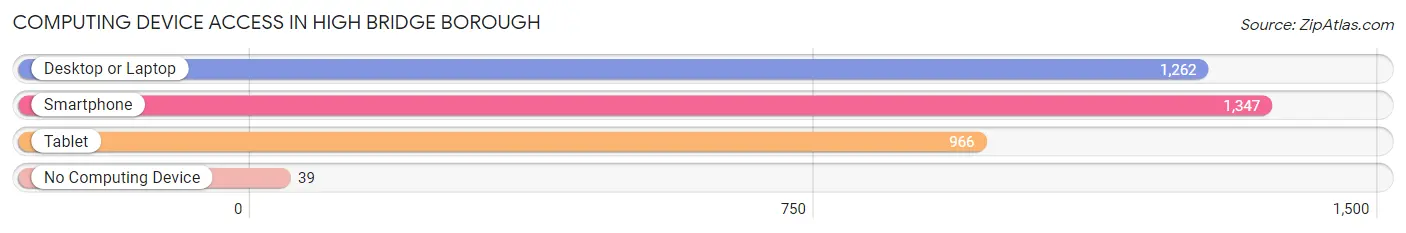
| Device Type | # Households | % Households |
| Desktop or Laptop | 1,262 | 87.9% |
| Smartphone | 1,347 | 93.8% |
| Tablet | 966 | 67.3% |
| No Computing Device | 39 | 2.7% |
| Total | 1,436 | 100.0% |
Internet Access in High Bridge borough
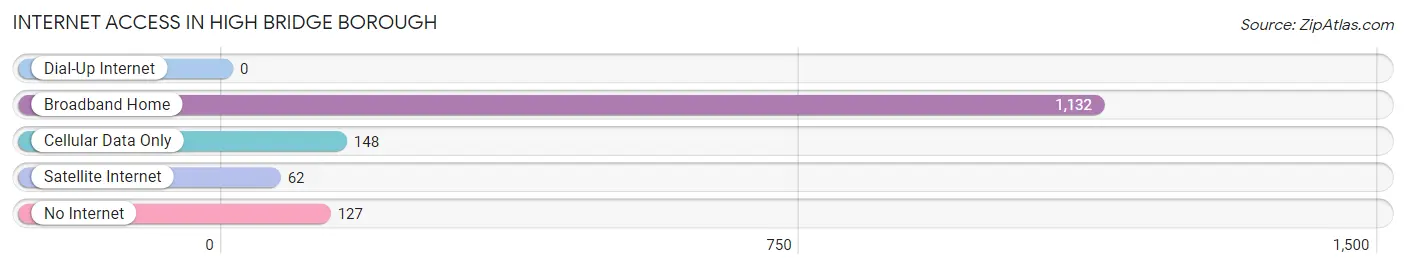
| Internet Type | # Households | % Households |
| Dial-Up Internet | 0 | 0.0% |
| Broadband Home | 1,132 | 78.8% |
| Cellular Data Only | 148 | 10.3% |
| Satellite Internet | 62 | 4.3% |
| No Internet | 127 | 8.8% |
| Total | 1,436 | 100.0% |
High Bridge borough Summary
High Bridge Borough is a small borough located in Hunterdon County, New Jersey. It is situated on the banks of the South Branch of the Raritan River and is part of the larger Raritan Valley region. The borough is home to a population of approximately 3,000 people and covers an area of 1.3 square miles.
History
High Bridge Borough was originally part of Clinton Township, which was established in 1841. In 1871, the area was incorporated as a separate borough and named after the High Bridge, which was built in 1839 to span the South Branch of the Raritan River. The bridge was built to provide a connection between the Morris Canal and the Central Railroad of New Jersey.
The borough was an important industrial center in the late 19th and early 20th centuries. It was home to several factories, including the High Bridge Iron Works, which produced iron products for the railroad industry. The borough also had a thriving agricultural industry, with many farms producing dairy products, fruits, and vegetables.
In the late 20th century, the borough experienced a decline in its industrial base. Many of the factories closed and the agricultural industry also declined. However, the borough has seen a resurgence in recent years, with the opening of several new businesses and the revitalization of its downtown area.
Geography
High Bridge Borough is located in the Raritan Valley region of New Jersey. It is situated on the banks of the South Branch of the Raritan River and is bordered by Clinton Township to the north, Lebanon Township to the east, and Tewksbury Township to the south and west. The borough covers an area of 1.3 square miles and is home to a population of approximately 3,000 people.
The borough is located in a rural area and is surrounded by rolling hills and farmland. The borough is also home to several parks, including High Bridge Park, which offers a variety of recreational activities, including hiking, fishing, and picnicking.
Economy
High Bridge Borough has a diverse economy. The borough is home to several small businesses, including restaurants, retail stores, and professional services. The borough also has a thriving agricultural industry, with many farms producing dairy products, fruits, and vegetables.
The borough is also home to several manufacturing companies, including High Bridge Iron Works, which produces iron products for the railroad industry. The borough is also home to several transportation companies, including the High Bridge Bus Company, which provides bus service to the surrounding area.
Demographics
High Bridge Borough has a population of approximately 3,000 people. The population is predominantly white (90.3%), with small percentages of African American (3.2%), Asian (2.2%), and Hispanic (2.2%) residents. The median household income is $76,944 and the median home value is $323,400.
The borough is served by the High Bridge School District, which consists of two elementary schools, one middle school, and one high school. The borough is also home to several churches, including the High Bridge Presbyterian Church and the High Bridge United Methodist Church.
High Bridge Borough is a small borough with a rich history and a diverse economy. The borough is home to a population of approximately 3,000 people and is surrounded by rolling hills and farmland. The borough is home to several small businesses, manufacturing companies, and transportation companies, as well as a thriving agricultural industry. The borough is served by the High Bridge School District and is home to several churches.
Common Questions
What is Per Capita Income in High Bridge borough?
Per Capita income in High Bridge borough is $47,457.
What is the Median Family Income in High Bridge borough?
Median Family Income in High Bridge borough is $122,431.
What is the Median Household income in High Bridge borough?
Median Household Income in High Bridge borough is $106,111.
What is Income or Wage Gap in High Bridge borough?
Income or Wage Gap in High Bridge borough is 11.0%.
Women in High Bridge borough earn 89.0 cents for every dollar earned by a man.
What is Inequality or Gini Index in High Bridge borough?
Inequality or Gini Index in High Bridge borough is 0.38.
What is the Total Population of High Bridge borough?
Total Population of High Bridge borough is 3,564.
What is the Total Male Population of High Bridge borough?
Total Male Population of High Bridge borough is 1,860.
What is the Total Female Population of High Bridge borough?
Total Female Population of High Bridge borough is 1,704.
What is the Ratio of Males per 100 Females in High Bridge borough?
There are 109.15 Males per 100 Females in High Bridge borough.
What is the Ratio of Females per 100 Males in High Bridge borough?
There are 91.61 Females per 100 Males in High Bridge borough.
What is the Median Population Age in High Bridge borough?
Median Population Age in High Bridge borough is 40.0 Years.
What is the Average Family Size in High Bridge borough
Average Family Size in High Bridge borough is 3.0 People.
What is the Average Household Size in High Bridge borough
Average Household Size in High Bridge borough is 2.5 People.
How Large is the Labor Force in High Bridge borough?
There are 1,969 People in the Labor Forcein in High Bridge borough.
What is the Percentage of People in the Labor Force in High Bridge borough?
66.3% of People are in the Labor Force in High Bridge borough.
What is the Unemployment Rate in High Bridge borough?
Unemployment Rate in High Bridge borough is 6.0%.