Holiday City South, NJ Map & Demographics
Holiday City South Map
Holiday City South Overview
$75,527
PER CAPITA INCOME
$66,677
AVG FAMILY INCOME
$54,875
AVG HOUSEHOLD INCOME
24.9%
WAGE / INCOME GAP [ % ]
75.1¢/ $1
WAGE / INCOME GAP [ $ ]
0.66
INEQUALITY / GINI INDEX
4,412
TOTAL POPULATION
1,821
MALE POPULATION
2,591
FEMALE POPULATION
70.28
MALES / 100 FEMALES
142.28
FEMALES / 100 MALES
69.2
MEDIAN AGE
2.3
AVG FAMILY SIZE
1.8
AVG HOUSEHOLD SIZE
1,464
LABOR FORCE [ PEOPLE ]
34.1%
PERCENT IN LABOR FORCE
2.9%
UNEMPLOYMENT RATE
Income in Holiday City South
Income Overview in Holiday City South
Per Capita Income in Holiday City South is $75,527, while median incomes of families and households are $66,677 and $54,875 respectively.
| Characteristic | Number | Measure |
| Per Capita Income | 4,412 | $75,527 |
| Median Family Income | 1,279 | $66,677 |
| Mean Family Income | 1,279 | $89,446 |
| Median Household Income | 2,468 | $54,875 |
| Mean Household Income | 2,468 | $134,195 |
| Income Deficit | 1,279 | $0 |
| Wage / Income Gap (%) | 4,412 | 24.90% |
| Wage / Income Gap ($) | 4,412 | 75.10¢ per $1 |
| Gini / Inequality Index | 4,412 | 0.66 |
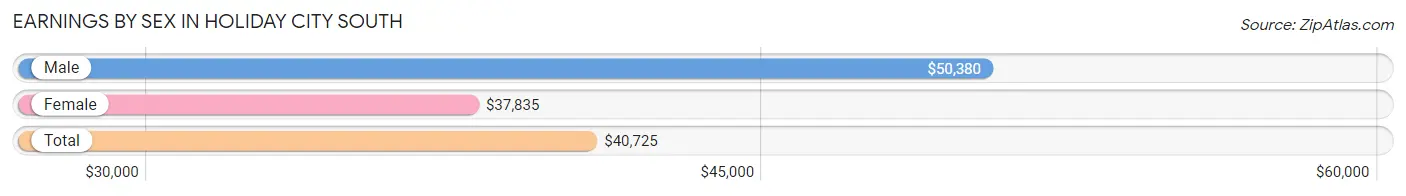
Earnings by Sex in Holiday City South
Average Earnings in Holiday City South are $40,725, $50,380 for men and $37,835 for women, a difference of 24.9%.
| Sex | Number | Average Earnings |
| Male | 746 (48.6%) | $50,380 |
| Female | 788 (51.4%) | $37,835 |
| Total | 1,534 (100.0%) | $40,725 |
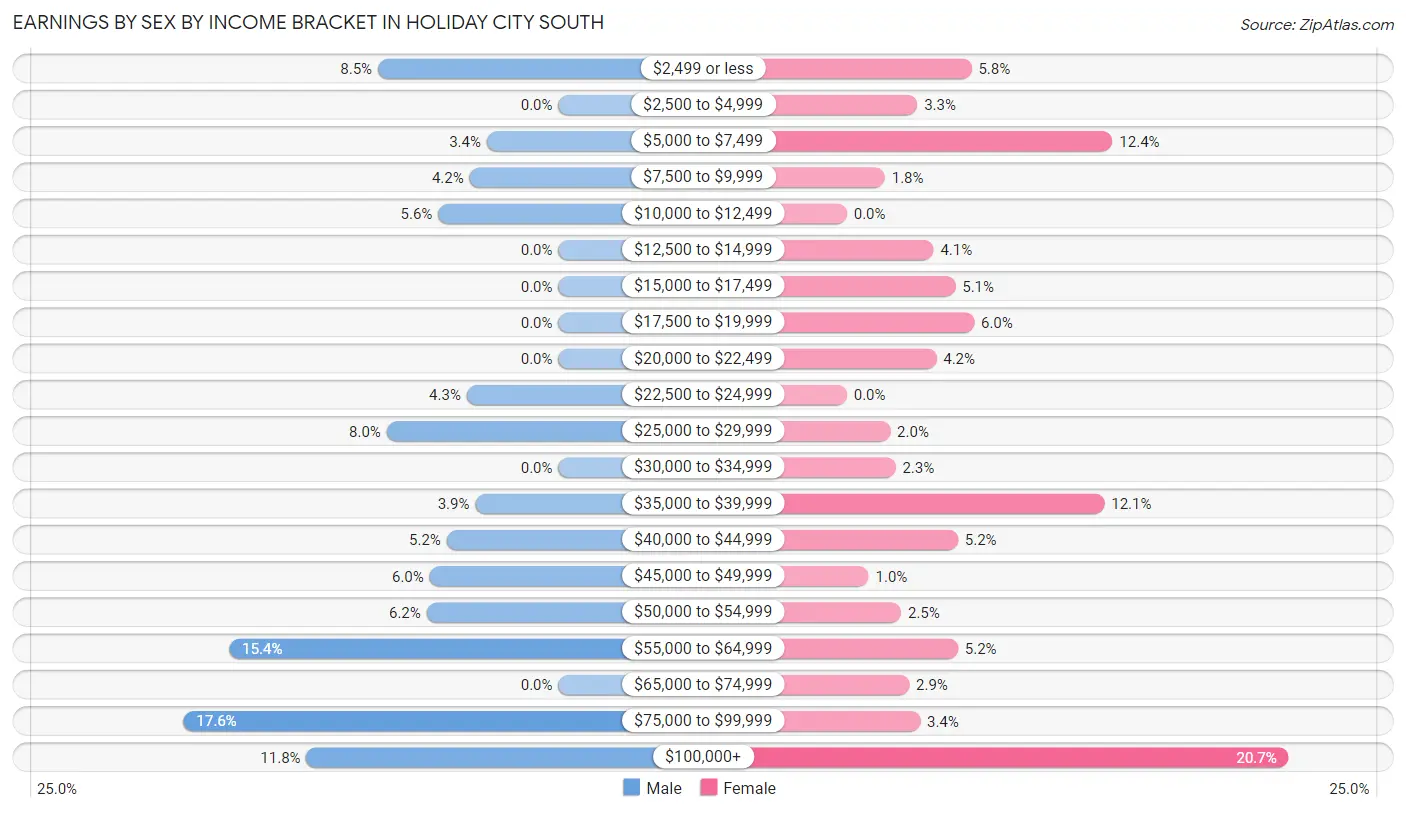
Earnings by Sex by Income Bracket in Holiday City South
The most common earnings brackets in Holiday City South are $75,000 to $99,999 for men (131 | 17.6%) and $100,000+ for women (163 | 20.7%).
| Income | Male | Female |
| $2,499 or less | 63 (8.5%) | 46 (5.8%) |
| $2,500 to $4,999 | 0 (0.0%) | 26 (3.3%) |
| $5,000 to $7,499 | 25 (3.4%) | 98 (12.4%) |
| $7,500 to $9,999 | 31 (4.2%) | 14 (1.8%) |
| $10,000 to $12,499 | 42 (5.6%) | 0 (0.0%) |
| $12,500 to $14,999 | 0 (0.0%) | 32 (4.1%) |
| $15,000 to $17,499 | 0 (0.0%) | 40 (5.1%) |
| $17,500 to $19,999 | 0 (0.0%) | 47 (6.0%) |
| $20,000 to $22,499 | 0 (0.0%) | 33 (4.2%) |
| $22,500 to $24,999 | 32 (4.3%) | 0 (0.0%) |
| $25,000 to $29,999 | 60 (8.0%) | 16 (2.0%) |
| $30,000 to $34,999 | 0 (0.0%) | 18 (2.3%) |
| $35,000 to $39,999 | 29 (3.9%) | 95 (12.1%) |
| $40,000 to $44,999 | 39 (5.2%) | 41 (5.2%) |
| $45,000 to $49,999 | 45 (6.0%) | 8 (1.0%) |
| $50,000 to $54,999 | 46 (6.2%) | 20 (2.5%) |
| $55,000 to $64,999 | 115 (15.4%) | 41 (5.2%) |
| $65,000 to $74,999 | 0 (0.0%) | 23 (2.9%) |
| $75,000 to $99,999 | 131 (17.6%) | 27 (3.4%) |
| $100,000+ | 88 (11.8%) | 163 (20.7%) |
| Total | 746 (100.0%) | 788 (100.0%) |
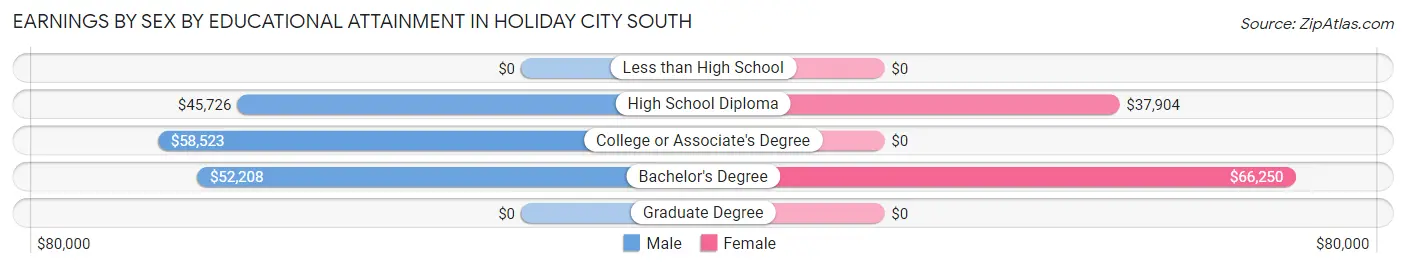
Earnings by Sex by Educational Attainment in Holiday City South
Average earnings in Holiday City South are $51,060 for men and $37,912 for women, a difference of 25.8%. Men with an educational attainment of college or associate's degree enjoy the highest average annual earnings of $58,523, while those with high school diploma education earn the least with $45,726. Women with an educational attainment of bachelor's degree earn the most with the average annual earnings of $66,250, while those with high school diploma education have the smallest earnings of $37,904.
| Educational Attainment | Male Income | Female Income |
| Less than High School | - | - |
| High School Diploma | $45,726 | $37,904 |
| College or Associate's Degree | $58,523 | $0 |
| Bachelor's Degree | $52,208 | $66,250 |
| Graduate Degree | - | - |
| Total | $51,060 | $37,912 |
Family Income in Holiday City South
Family Income Brackets in Holiday City South
According to the Holiday City South family income data, there are 327 families falling into the $50,000 to $74,999 income range, which is the most common income bracket and makes up 25.6% of all families. Conversely, the less than $10,000 income bracket is the least frequent group with only 19 families (1.5%) belonging to this category.

| Income Bracket | # Families | % Families |
| Less than $10,000 | 19 | 1.5% |
| $10,000 to $14,999 | 41 | 3.2% |
| $15,000 to $24,999 | 69 | 5.4% |
| $25,000 to $34,999 | 73 | 5.7% |
| $35,000 to $49,999 | 211 | 16.5% |
| $50,000 to $74,999 | 327 | 25.6% |
| $75,000 to $99,999 | 83 | 6.5% |
| $100,000 to $149,999 | 303 | 23.7% |
| $150,000 to $199,999 | 52 | 4.1% |
| $200,000+ | 100 | 7.8% |
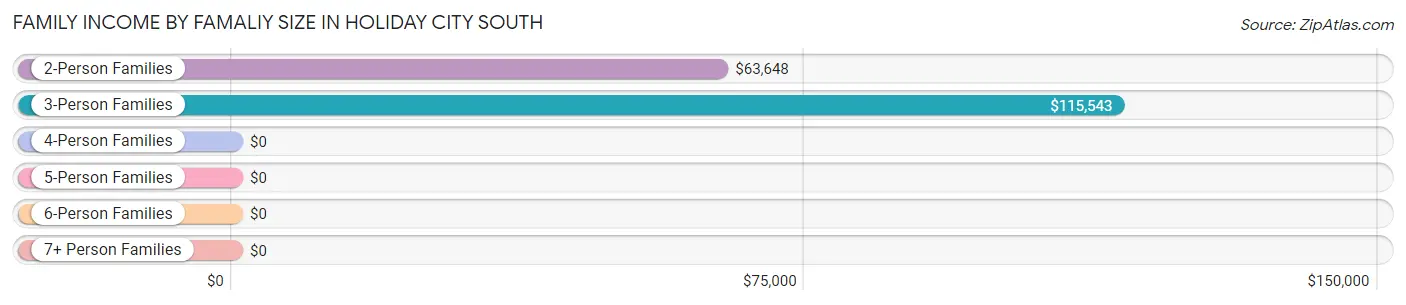
Family Income by Famaliy Size in Holiday City South
3-person families (176 | 13.8%) account for the highest median family income in Holiday City South with $115,543 per family, while 3-person families (176 | 13.8%) have the highest median income of $38,514 per family member.
| Income Bracket | # Families | Median Income |
| 2-Person Families | 1,039 (81.2%) | $63,648 |
| 3-Person Families | 176 (13.8%) | $115,543 |
| 4-Person Families | 40 (3.1%) | $0 |
| 5-Person Families | 13 (1.0%) | $0 |
| 6-Person Families | 6 (0.5%) | $0 |
| 7+ Person Families | 5 (0.4%) | $0 |
| Total | 1,279 (100.0%) | $66,677 |
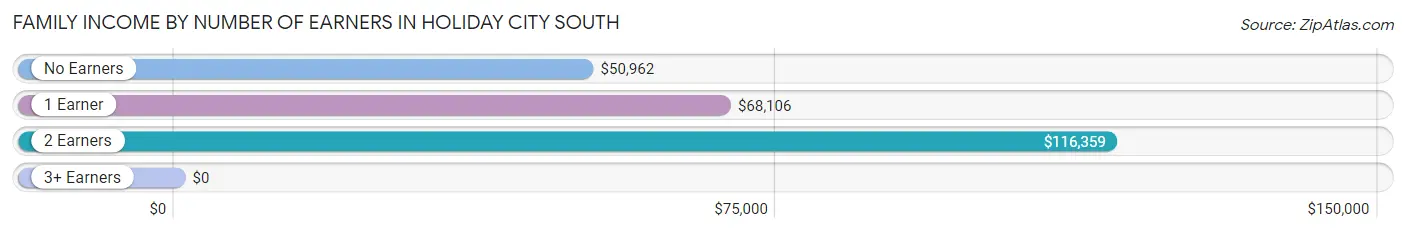
Family Income by Number of Earners in Holiday City South
| Number of Earners | # Families | Median Income |
| No Earners | 476 (37.2%) | $50,962 |
| 1 Earner | 548 (42.8%) | $68,106 |
| 2 Earners | 235 (18.4%) | $116,359 |
| 3+ Earners | 20 (1.6%) | $0 |
| Total | 1,279 (100.0%) | $66,677 |
Household Income in Holiday City South
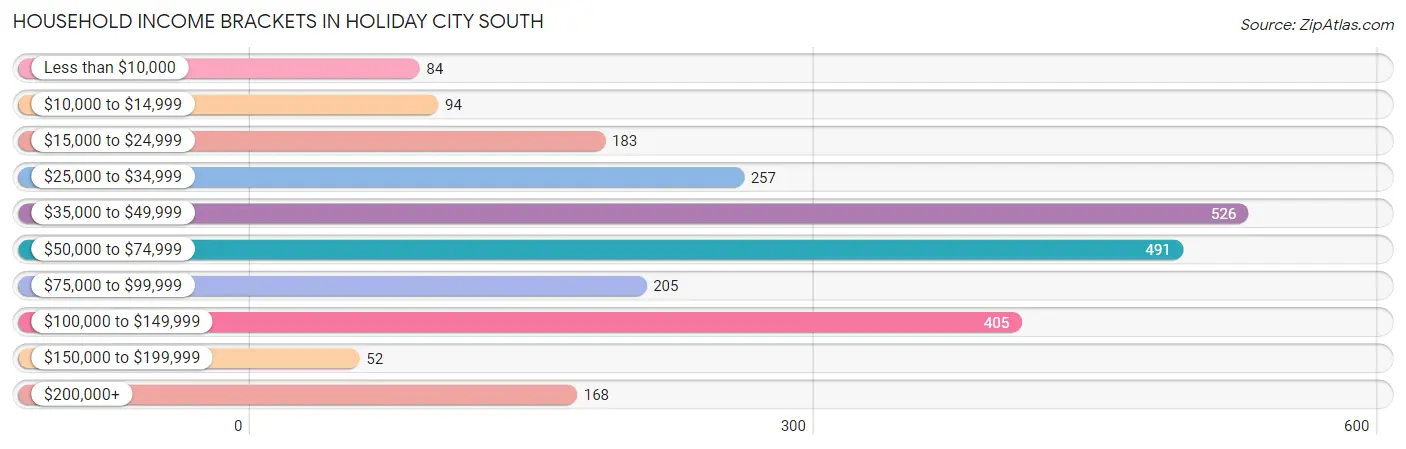
Household Income Brackets in Holiday City South
With 526 households falling in the category, the $35,000 to $49,999 income range is the most frequent in Holiday City South, accounting for 21.3% of all households. In contrast, only 52 households (2.1%) fall into the $150,000 to $199,999 income bracket, making it the least populous group.
| Income Bracket | # Households | % Households |
| Less than $10,000 | 84 | 3.4% |
| $10,000 to $14,999 | 94 | 3.8% |
| $15,000 to $24,999 | 183 | 7.4% |
| $25,000 to $34,999 | 257 | 10.4% |
| $35,000 to $49,999 | 526 | 21.3% |
| $50,000 to $74,999 | 491 | 19.9% |
| $75,000 to $99,999 | 205 | 8.3% |
| $100,000 to $149,999 | 405 | 16.4% |
| $150,000 to $199,999 | 52 | 2.1% |
| $200,000+ | 168 | 6.8% |
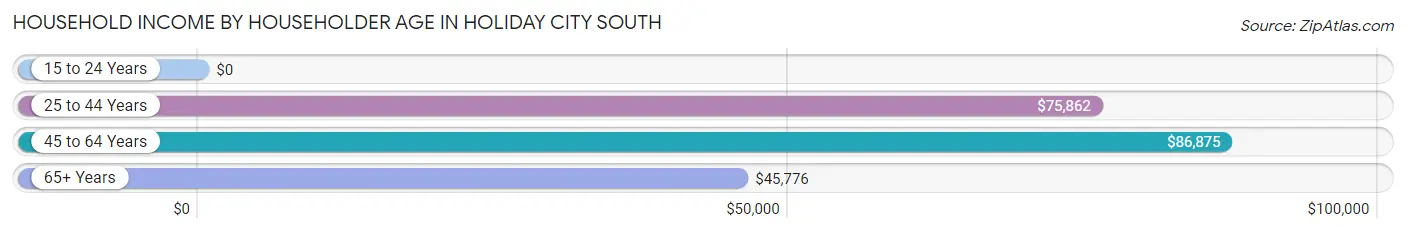
Household Income by Householder Age in Holiday City South
The median household income in Holiday City South is $54,875, with the highest median household income of $86,875 found in the 45 to 64 years age bracket for the primary householder. A total of 548 households (22.2%) fall into this category.
| Income Bracket | # Households | Median Income |
| 15 to 24 Years | 0 (0.0%) | $0 |
| 25 to 44 Years | 112 (4.5%) | $75,862 |
| 45 to 64 Years | 548 (22.2%) | $86,875 |
| 65+ Years | 1,808 (73.3%) | $45,776 |
| Total | 2,468 (100.0%) | $54,875 |
Poverty in Holiday City South
Income Below Poverty by Sex and Age in Holiday City South
With 6.8% poverty level for males and 10.5% for females among the residents of Holiday City South, 65 to 74 year old males and 75 year old and over females are the most vulnerable to poverty, with 67 males (13.6%) and 184 females (20.8%) in their respective age groups living below the poverty level.
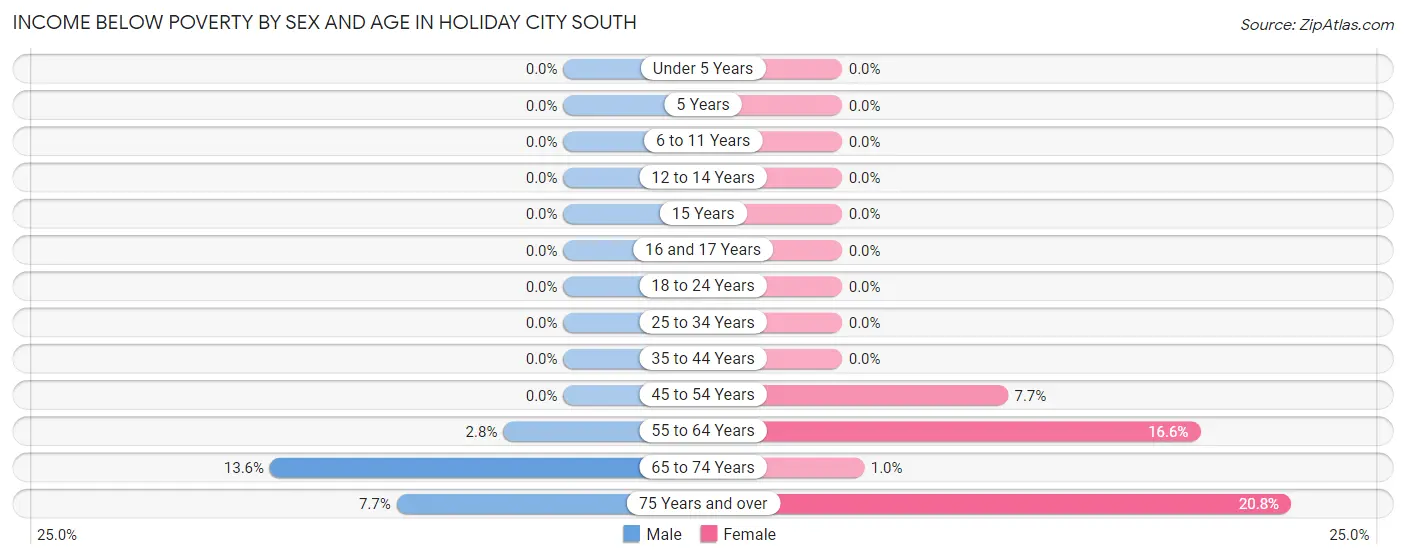
| Age Bracket | Male | Female |
| Under 5 Years | 0 (0.0%) | 0 (0.0%) |
| 5 Years | 0 (0.0%) | 0 (0.0%) |
| 6 to 11 Years | 0 (0.0%) | 0 (0.0%) |
| 12 to 14 Years | 0 (0.0%) | 0 (0.0%) |
| 15 Years | 0 (0.0%) | 0 (0.0%) |
| 16 and 17 Years | 0 (0.0%) | 0 (0.0%) |
| 18 to 24 Years | 0 (0.0%) | 0 (0.0%) |
| 25 to 34 Years | 0 (0.0%) | 0 (0.0%) |
| 35 to 44 Years | 0 (0.0%) | 0 (0.0%) |
| 45 to 54 Years | 0 (0.0%) | 13 (7.7%) |
| 55 to 64 Years | 10 (2.8%) | 67 (16.6%) |
| 65 to 74 Years | 67 (13.6%) | 9 (1.0%) |
| 75 Years and over | 47 (7.7%) | 184 (20.8%) |
| Total | 124 (6.8%) | 273 (10.5%) |
Income Above Poverty by Sex and Age in Holiday City South
According to the poverty statistics in Holiday City South, males aged under 5 years and females aged under 5 years are the age groups that are most secure financially, with 100.0% of males and 100.0% of females in these age groups living above the poverty line.
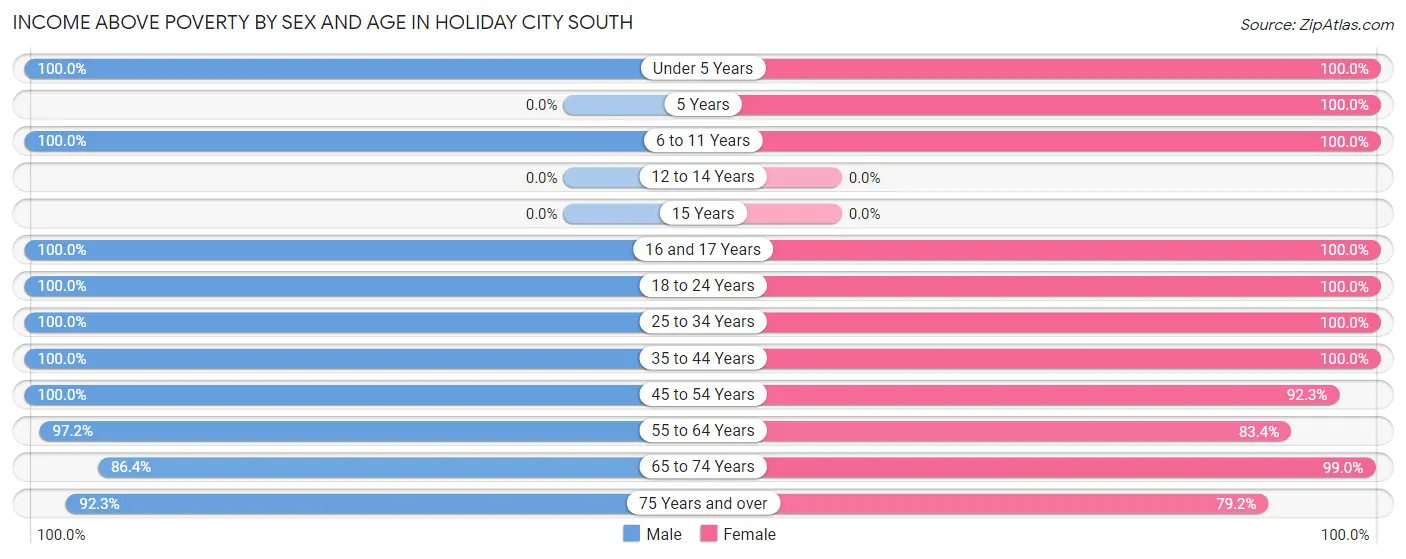
| Age Bracket | Male | Female |
| Under 5 Years | 27 (100.0%) | 50 (100.0%) |
| 5 Years | 0 (0.0%) | 12 (100.0%) |
| 6 to 11 Years | 5 (100.0%) | 24 (100.0%) |
| 12 to 14 Years | 0 (0.0%) | 0 (0.0%) |
| 15 Years | 0 (0.0%) | 0 (0.0%) |
| 16 and 17 Years | 4 (100.0%) | 18 (100.0%) |
| 18 to 24 Years | 25 (100.0%) | 29 (100.0%) |
| 25 to 34 Years | 156 (100.0%) | 77 (100.0%) |
| 35 to 44 Years | 84 (100.0%) | 41 (100.0%) |
| 45 to 54 Years | 62 (100.0%) | 156 (92.3%) |
| 55 to 64 Years | 349 (97.2%) | 336 (83.4%) |
| 65 to 74 Years | 425 (86.4%) | 876 (99.0%) |
| 75 Years and over | 560 (92.3%) | 699 (79.2%) |
| Total | 1,697 (93.2%) | 2,318 (89.5%) |
Income Below Poverty Among Married-Couple Families in Holiday City South
The poverty statistics for married-couple families in Holiday City South show that 5.4% or 50 of the total 925 families live below the poverty line. Families with no children have the highest poverty rate of 5.7%, comprising of 50 families. On the other hand, families with 1 or 2 children have the lowest poverty rate of 0.0%, which includes 0 families.
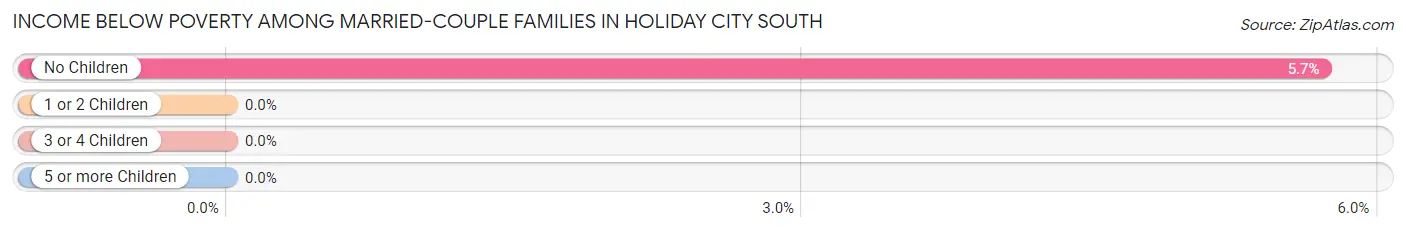
| Children | Above Poverty | Below Poverty |
| No Children | 826 (94.3%) | 50 (5.7%) |
| 1 or 2 Children | 43 (100.0%) | 0 (0.0%) |
| 3 or 4 Children | 6 (100.0%) | 0 (0.0%) |
| 5 or more Children | 0 (0.0%) | 0 (0.0%) |
| Total | 875 (94.6%) | 50 (5.4%) |
Income Below Poverty Among Single-Parent Households in Holiday City South
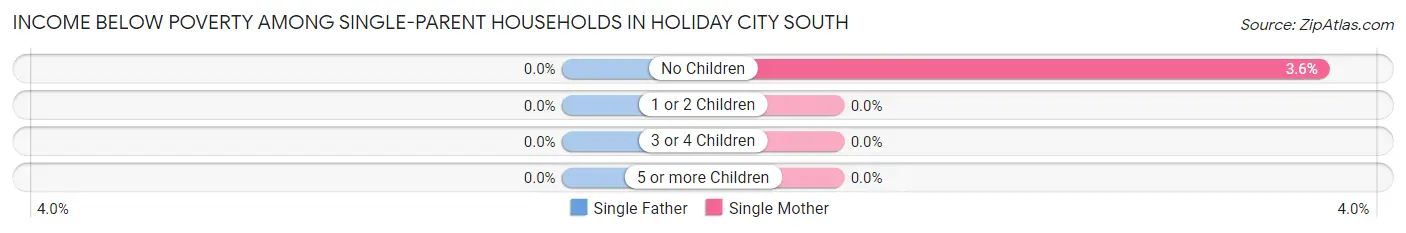
| Children | Single Father | Single Mother |
| No Children | 0 (0.0%) | 10 (3.6%) |
| 1 or 2 Children | 0 (0.0%) | 0 (0.0%) |
| 3 or 4 Children | 0 (0.0%) | 0 (0.0%) |
| 5 or more Children | 0 (0.0%) | 0 (0.0%) |
| Total | 0 (0.0%) | 10 (3.6%) |
Income Below Poverty Among Married-Couple vs Single-Parent Households in Holiday City South
The poverty data for Holiday City South shows that 50 of the married-couple family households (5.4%) and 10 of the single-parent households (2.8%) are living below the poverty level. Within the married-couple family households, those with no children have the highest poverty rate, with 50 households (5.7%) falling below the poverty line. Among the single-parent households, those with no children have the highest poverty rate, with 10 household (3.0%) living below poverty.
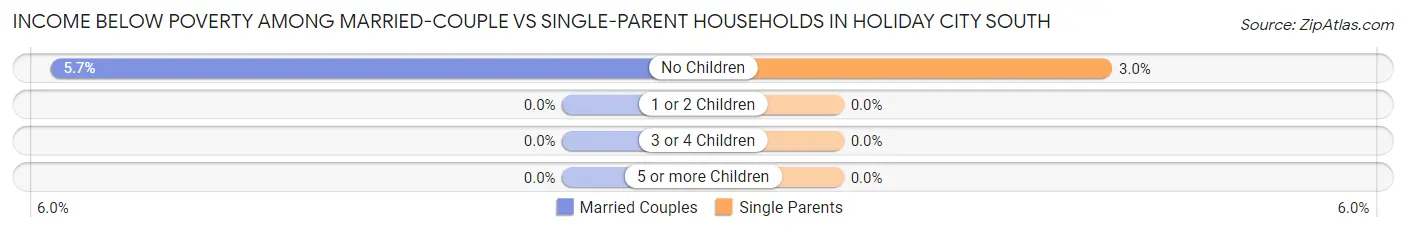
| Children | Married-Couple Families | Single-Parent Households |
| No Children | 50 (5.7%) | 10 (3.0%) |
| 1 or 2 Children | 0 (0.0%) | 0 (0.0%) |
| 3 or 4 Children | 0 (0.0%) | 0 (0.0%) |
| 5 or more Children | 0 (0.0%) | 0 (0.0%) |
| Total | 50 (5.4%) | 10 (2.8%) |
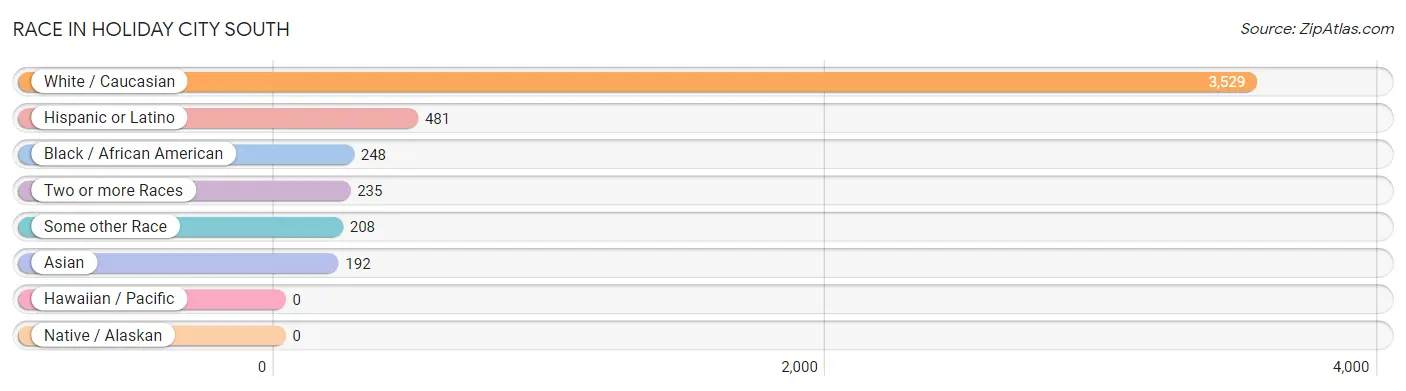
Race in Holiday City South
The most populous races in Holiday City South are White / Caucasian (3,529 | 80.0%), Hispanic or Latino (481 | 10.9%), and Black / African American (248 | 5.6%).
| Race | # Population | % Population |
| Asian | 192 | 4.3% |
| Black / African American | 248 | 5.6% |
| Hawaiian / Pacific | 0 | 0.0% |
| Hispanic or Latino | 481 | 10.9% |
| Native / Alaskan | 0 | 0.0% |
| White / Caucasian | 3,529 | 80.0% |
| Two or more Races | 235 | 5.3% |
| Some other Race | 208 | 4.7% |
| Total | 4,412 | 100.0% |
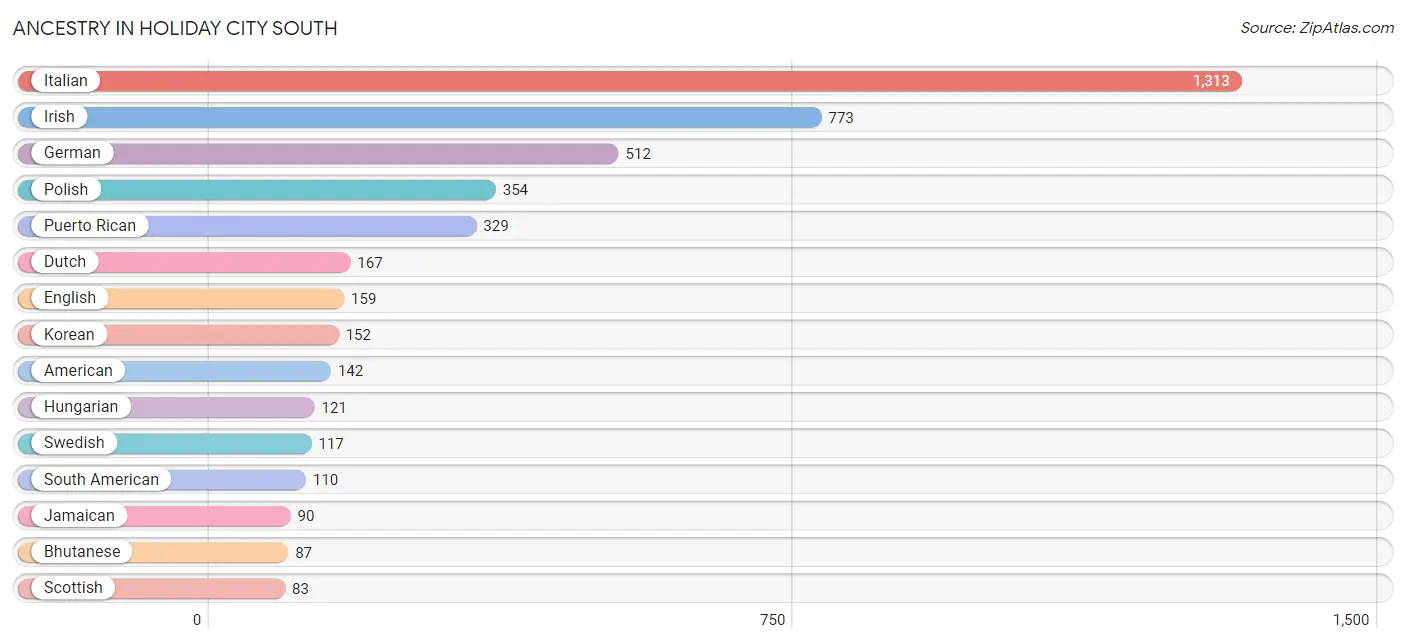
Ancestry in Holiday City South
The most populous ancestries reported in Holiday City South are Italian (1,313 | 29.8%), Irish (773 | 17.5%), German (512 | 11.6%), Polish (354 | 8.0%), and Puerto Rican (329 | 7.5%), together accounting for 74.4% of all Holiday City South residents.
| Ancestry | # Population | % Population |
| African | 11 | 0.3% |
| American | 142 | 3.2% |
| Arab | 9 | 0.2% |
| Bhutanese | 87 | 2.0% |
| Canadian | 20 | 0.4% |
| Colombian | 82 | 1.9% |
| Croatian | 14 | 0.3% |
| Cuban | 42 | 0.9% |
| Dutch | 167 | 3.8% |
| English | 159 | 3.6% |
| European | 32 | 0.7% |
| Finnish | 11 | 0.3% |
| French | 74 | 1.7% |
| German | 512 | 11.6% |
| Greek | 39 | 0.9% |
| Hungarian | 121 | 2.7% |
| Irish | 773 | 17.5% |
| Italian | 1,313 | 29.8% |
| Jamaican | 90 | 2.0% |
| Korean | 152 | 3.5% |
| Lebanese | 9 | 0.2% |
| Maltese | 14 | 0.3% |
| Native Hawaiian | 47 | 1.1% |
| Navajo | 49 | 1.1% |
| Norwegian | 11 | 0.3% |
| Polish | 354 | 8.0% |
| Portuguese | 36 | 0.8% |
| Puerto Rican | 329 | 7.5% |
| Romanian | 24 | 0.5% |
| Russian | 34 | 0.8% |
| Scotch-Irish | 13 | 0.3% |
| Scottish | 83 | 1.9% |
| Slavic | 9 | 0.2% |
| South American | 110 | 2.5% |
| Subsaharan African | 11 | 0.3% |
| Swedish | 117 | 2.6% |
| Tlingit-Haida | 12 | 0.3% |
| Ukrainian | 24 | 0.5% |
| Venezuelan | 28 | 0.6% | View All 39 Rows |
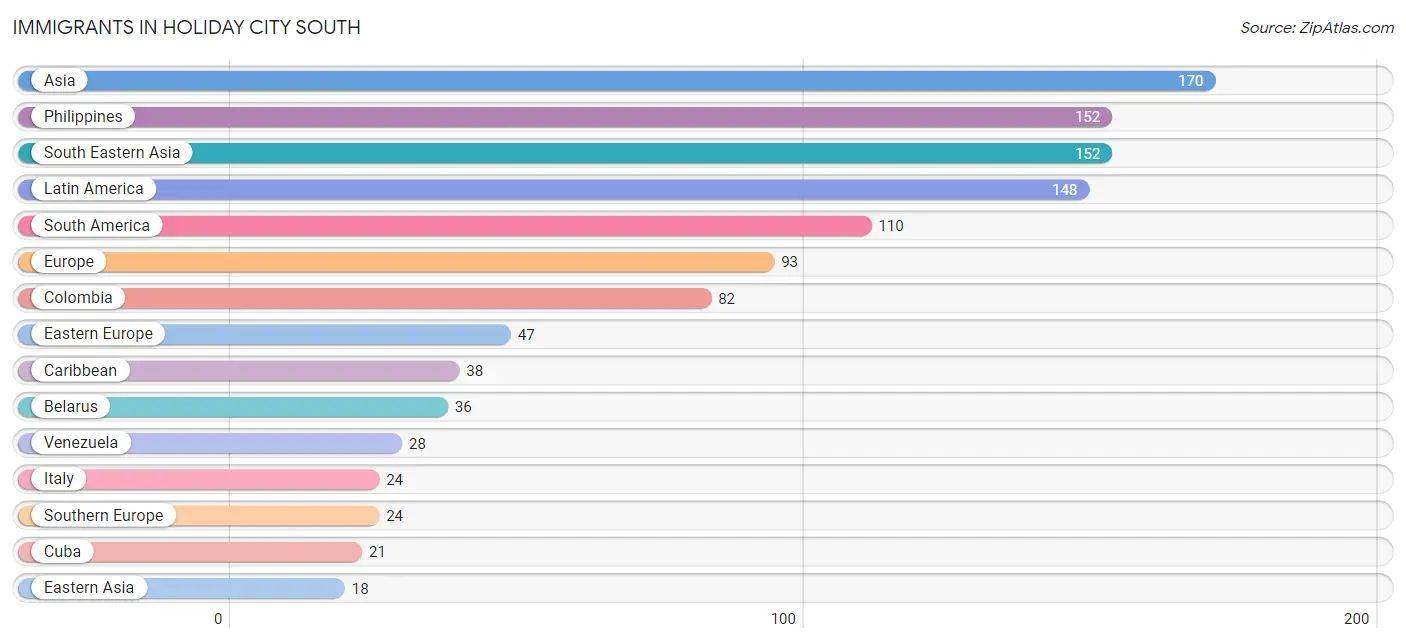
Immigrants in Holiday City South
The most numerous immigrant groups reported in Holiday City South came from Asia (170 | 3.8%), Philippines (152 | 3.5%), South Eastern Asia (152 | 3.5%), Latin America (148 | 3.4%), and South America (110 | 2.5%), together accounting for 16.6% of all Holiday City South residents.
| Immigration Origin | # Population | % Population |
| Africa | 11 | 0.3% |
| Asia | 170 | 3.8% |
| Austria | 9 | 0.2% |
| Belarus | 36 | 0.8% |
| Canada | 16 | 0.4% |
| Caribbean | 38 | 0.9% |
| Colombia | 82 | 1.9% |
| Cuba | 21 | 0.5% |
| Eastern Asia | 18 | 0.4% |
| Eastern Europe | 47 | 1.1% |
| Europe | 93 | 2.1% |
| Italy | 24 | 0.5% |
| Jamaica | 17 | 0.4% |
| Japan | 18 | 0.4% |
| Latin America | 148 | 3.4% |
| Northern Europe | 13 | 0.3% |
| Philippines | 152 | 3.5% |
| Romania | 11 | 0.3% |
| Scotland | 13 | 0.3% |
| South America | 110 | 2.5% |
| South Eastern Asia | 152 | 3.5% |
| Southern Europe | 24 | 0.5% |
| Venezuela | 28 | 0.6% |
| Western Europe | 9 | 0.2% | View All 24 Rows |
Sex and Age in Holiday City South
Sex and Age in Holiday City South
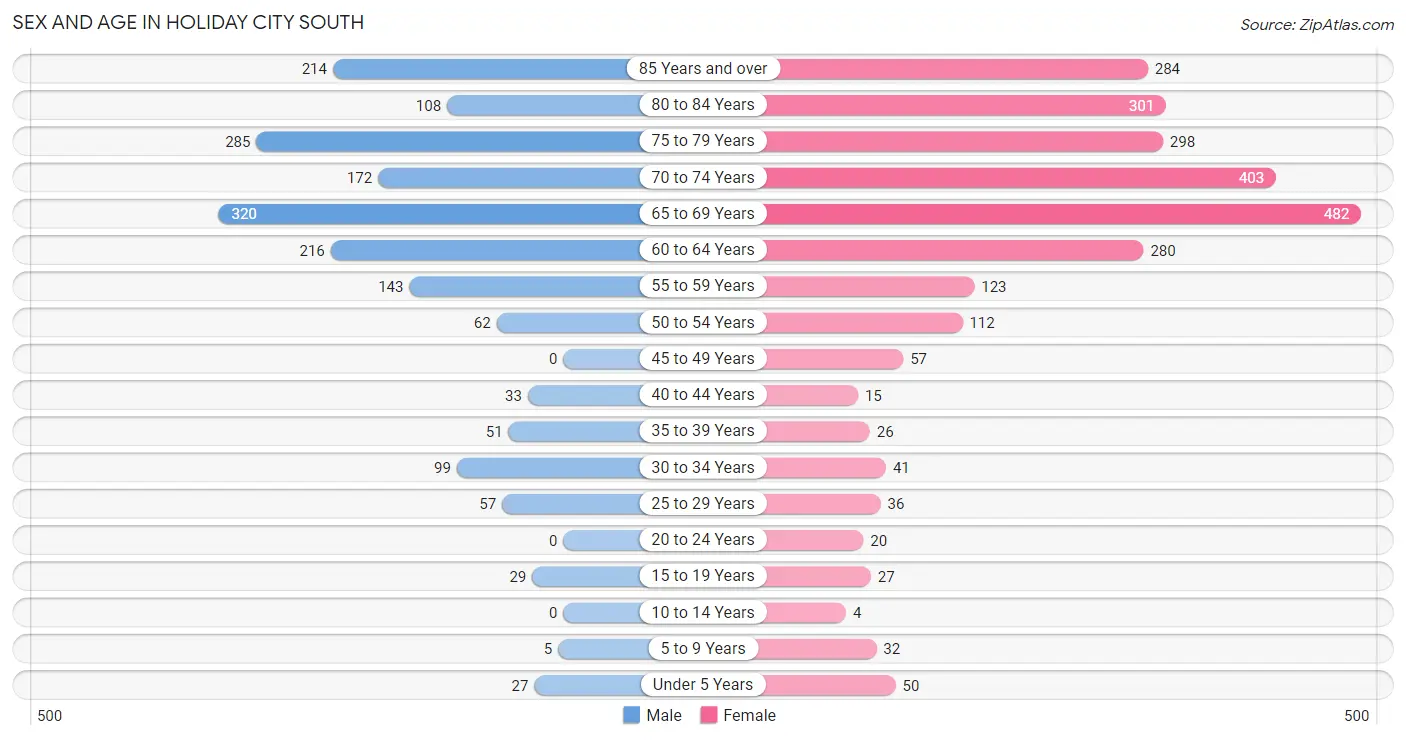
The most populous age groups in Holiday City South are 65 to 69 Years (320 | 17.6%) for men and 65 to 69 Years (482 | 18.6%) for women.
| Age Bracket | Male | Female |
| Under 5 Years | 27 (1.5%) | 50 (1.9%) |
| 5 to 9 Years | 5 (0.3%) | 32 (1.2%) |
| 10 to 14 Years | 0 (0.0%) | 4 (0.2%) |
| 15 to 19 Years | 29 (1.6%) | 27 (1.0%) |
| 20 to 24 Years | 0 (0.0%) | 20 (0.8%) |
| 25 to 29 Years | 57 (3.1%) | 36 (1.4%) |
| 30 to 34 Years | 99 (5.4%) | 41 (1.6%) |
| 35 to 39 Years | 51 (2.8%) | 26 (1.0%) |
| 40 to 44 Years | 33 (1.8%) | 15 (0.6%) |
| 45 to 49 Years | 0 (0.0%) | 57 (2.2%) |
| 50 to 54 Years | 62 (3.4%) | 112 (4.3%) |
| 55 to 59 Years | 143 (7.9%) | 123 (4.8%) |
| 60 to 64 Years | 216 (11.9%) | 280 (10.8%) |
| 65 to 69 Years | 320 (17.6%) | 482 (18.6%) |
| 70 to 74 Years | 172 (9.5%) | 403 (15.5%) |
| 75 to 79 Years | 285 (15.7%) | 298 (11.5%) |
| 80 to 84 Years | 108 (5.9%) | 301 (11.6%) |
| 85 Years and over | 214 (11.7%) | 284 (11.0%) |
| Total | 1,821 (100.0%) | 2,591 (100.0%) |
Families and Households in Holiday City South
Median Family Size in Holiday City South
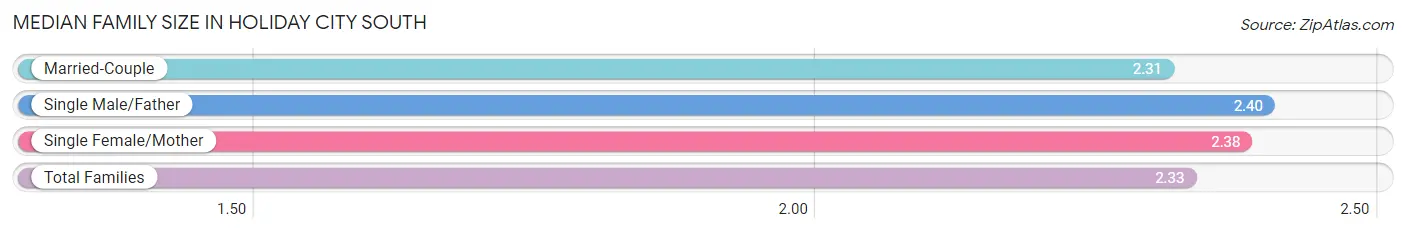
The median family size in Holiday City South is 2.33 persons per family, with single male/father families (73 | 5.7%) accounting for the largest median family size of 2.4 persons per family. On the other hand, married-couple families (925 | 72.3%) represent the smallest median family size with 2.31 persons per family.
| Family Type | # Families | Family Size |
| Married-Couple | 925 (72.3%) | 2.31 |
| Single Male/Father | 73 (5.7%) | 2.40 |
| Single Female/Mother | 281 (22.0%) | 2.38 |
| Total Families | 1,279 (100.0%) | 2.33 |
Median Household Size in Holiday City South
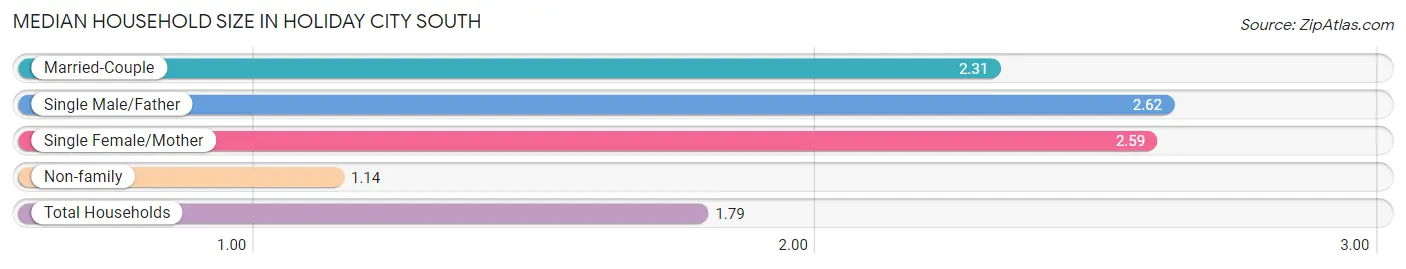
The median household size in Holiday City South is 1.79 persons per household, with single male/father households (73 | 3.0%) accounting for the largest median household size of 2.62 persons per household. non-family households (1,189 | 48.2%) represent the smallest median household size with 1.14 persons per household.
| Household Type | # Households | Household Size |
| Married-Couple | 925 (37.5%) | 2.31 |
| Single Male/Father | 73 (3.0%) | 2.62 |
| Single Female/Mother | 281 (11.4%) | 2.59 |
| Non-family | 1,189 (48.2%) | 1.14 |
| Total Households | 2,468 (100.0%) | 1.79 |
Household Size by Marriage Status in Holiday City South
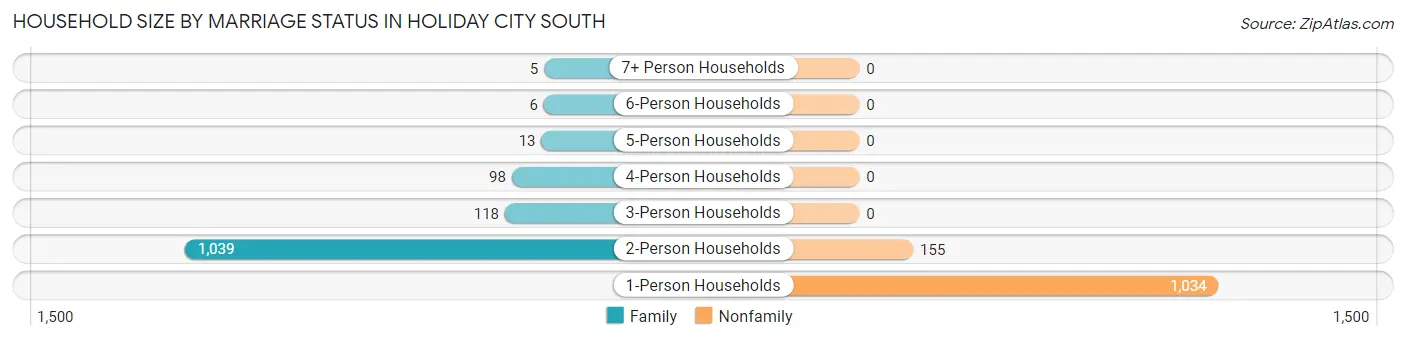
Out of a total of 2,468 households in Holiday City South, 1,279 (51.8%) are family households, while 1,189 (48.2%) are nonfamily households. The most numerous type of family households are 2-person households, comprising 1,039, and the most common type of nonfamily households are 1-person households, comprising 1,034.
| Household Size | Family Households | Nonfamily Households |
| 1-Person Households | - | 1,034 (41.9%) |
| 2-Person Households | 1,039 (42.1%) | 155 (6.3%) |
| 3-Person Households | 118 (4.8%) | 0 (0.0%) |
| 4-Person Households | 98 (4.0%) | 0 (0.0%) |
| 5-Person Households | 13 (0.5%) | 0 (0.0%) |
| 6-Person Households | 6 (0.2%) | 0 (0.0%) |
| 7+ Person Households | 5 (0.2%) | 0 (0.0%) |
| Total | 1,279 (51.8%) | 1,189 (48.2%) |
Female Fertility in Holiday City South
Fertility by Age in Holiday City South
Average fertility rate in Holiday City South is 20.0 births per 1,000 women. Women in the age bracket of 20 to 34 years have the highest fertility rate with 62.0 births per 1,000 women. Women in the age bracket of 20 to 34 years acount for 100.0% of all women with births.
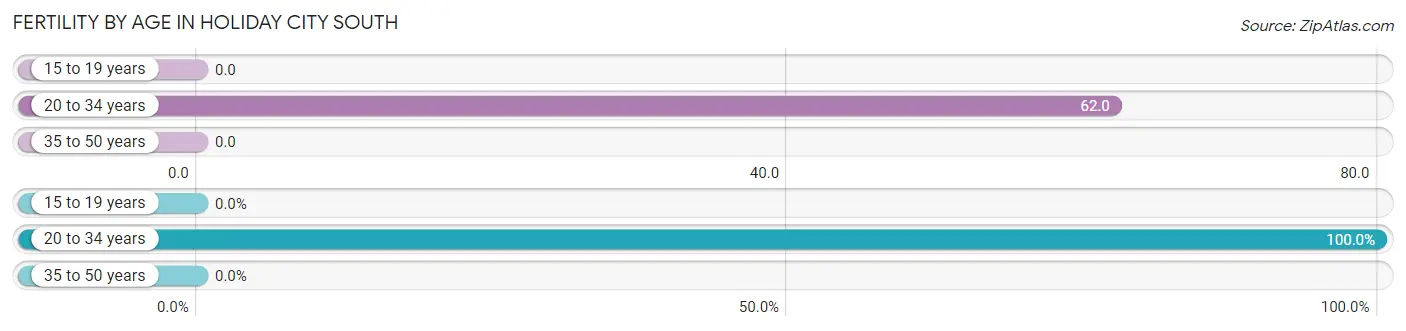
| Age Bracket | Women with Births | Births / 1,000 Women |
| 15 to 19 years | 0 (0.0%) | 0.0 |
| 20 to 34 years | 6 (100.0%) | 62.0 |
| 35 to 50 years | 0 (0.0%) | 0.0 |
| Total | 6 (100.0%) | 20.0 |
Fertility by Age by Marriage Status in Holiday City South
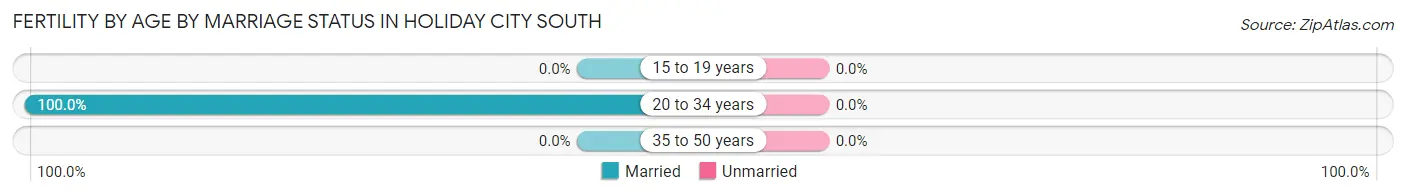
| Age Bracket | Married | Unmarried |
| 15 to 19 years | 0 (0.0%) | 0 (0.0%) |
| 20 to 34 years | 6 (100.0%) | 0 (0.0%) |
| 35 to 50 years | 0 (0.0%) | 0 (0.0%) |
| Total | 6 (100.0%) | 0 (0.0%) |
Fertility by Education in Holiday City South
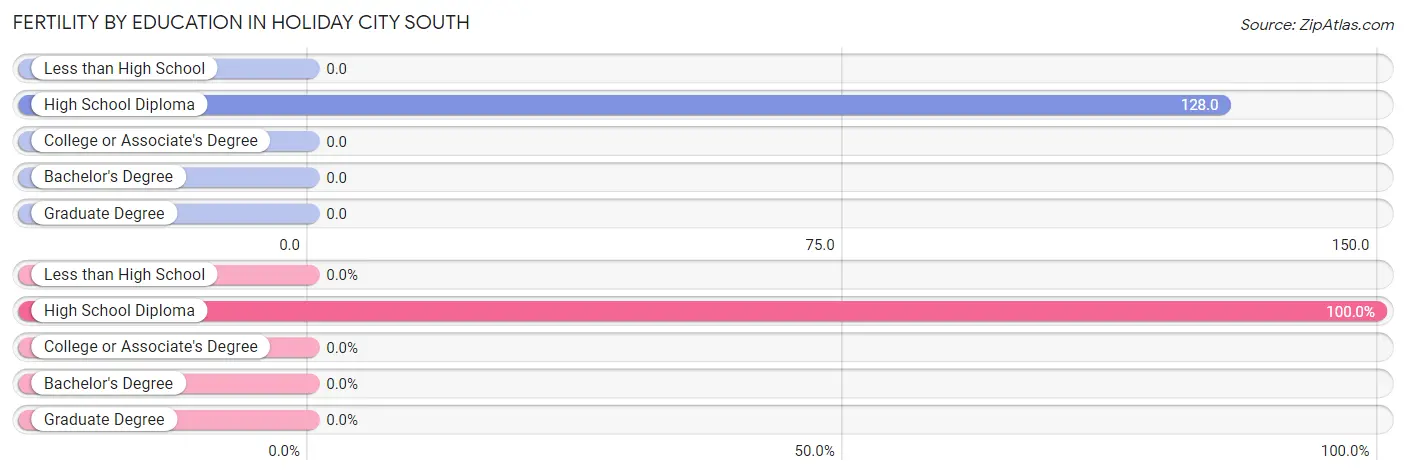
| Educational Attainment | Women with Births | Births / 1,000 Women |
| Less than High School | 0 (0.0%) | 0.0 |
| High School Diploma | 6 (100.0%) | 128.0 |
| College or Associate's Degree | 0 (0.0%) | 0.0 |
| Bachelor's Degree | 0 (0.0%) | 0.0 |
| Graduate Degree | 0 (0.0%) | 0.0 |
| Total | 6 (100.0%) | 20.0 |
Fertility by Education by Marriage Status in Holiday City South
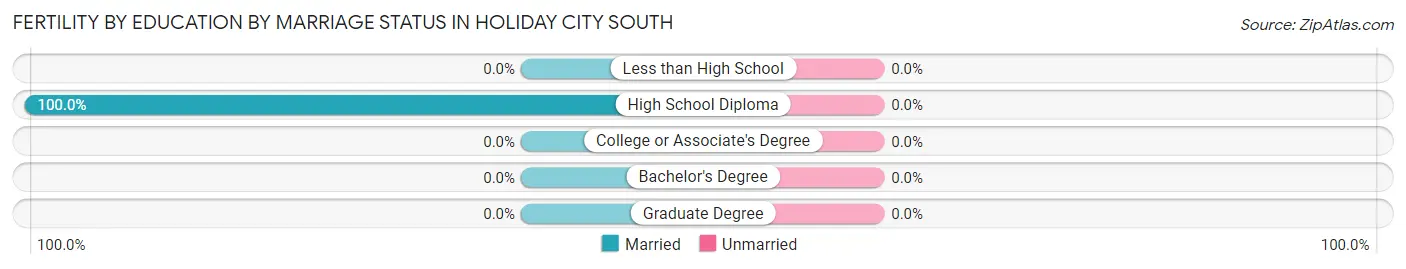
| Educational Attainment | Married | Unmarried |
| Less than High School | 0 (0.0%) | 0 (0.0%) |
| High School Diploma | 6 (100.0%) | 0 (0.0%) |
| College or Associate's Degree | 0 (0.0%) | 0 (0.0%) |
| Bachelor's Degree | 0 (0.0%) | 0 (0.0%) |
| Graduate Degree | 0 (0.0%) | 0 (0.0%) |
| Total | 6 (100.0%) | 0 (0.0%) |
Employment Characteristics in Holiday City South
Employment by Class of Employer in Holiday City South
Among the 1,398 employed individuals in Holiday City South, private company employees (1,084 | 77.5%), local government employees (132 | 9.4%), and not-for-profit organizations (90 | 6.4%) make up the most common classes of employment.
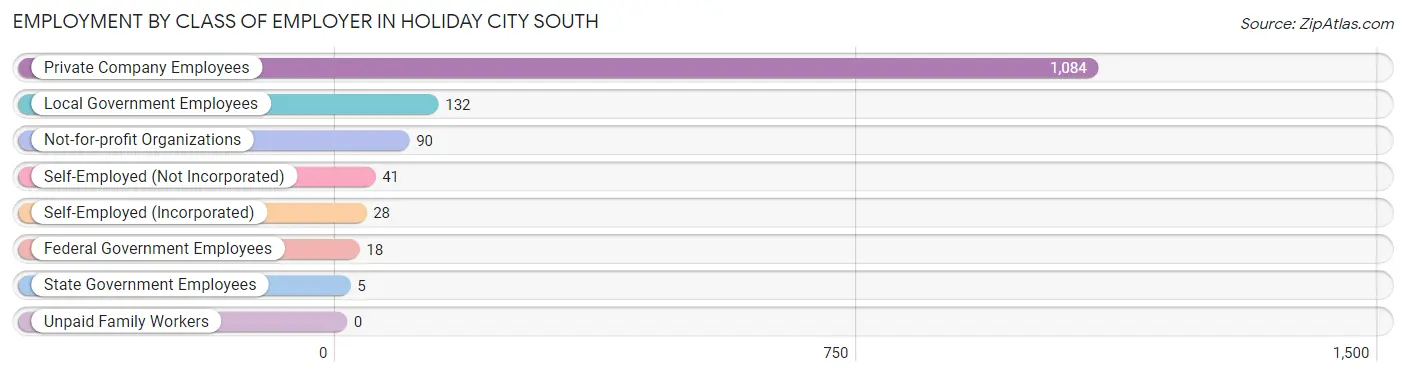
| Employer Class | # Employees | % Employees |
| Private Company Employees | 1,084 | 77.5% |
| Self-Employed (Incorporated) | 28 | 2.0% |
| Self-Employed (Not Incorporated) | 41 | 2.9% |
| Not-for-profit Organizations | 90 | 6.4% |
| Local Government Employees | 132 | 9.4% |
| State Government Employees | 5 | 0.4% |
| Federal Government Employees | 18 | 1.3% |
| Unpaid Family Workers | 0 | 0.0% |
| Total | 1,398 | 100.0% |
Employment Status by Age in Holiday City South
According to the labor force statistics for Holiday City South, out of the total population over 16 years of age (4,294), 34.1% or 1,464 individuals are in the labor force, with 2.9% or 42 of them unemployed. The age group with the highest labor force participation rate is 20 to 24 years, with 100.0% or 20 individuals in the labor force. Within the labor force, the 45 to 54 years age range has the highest percentage of unemployed individuals, with 9.2% or 13 of them being unemployed.
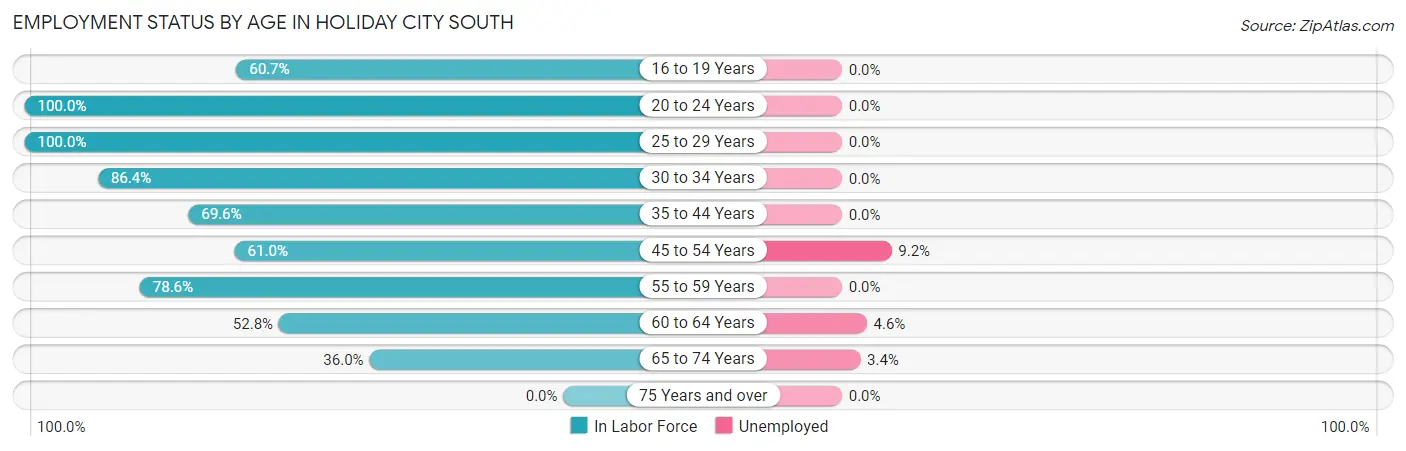
| Age Bracket | In Labor Force | Unemployed |
| 16 to 19 Years | 34 (60.7%) | 0 (0.0%) |
| 20 to 24 Years | 20 (100.0%) | 0 (0.0%) |
| 25 to 29 Years | 93 (100.0%) | 0 (0.0%) |
| 30 to 34 Years | 121 (86.4%) | 0 (0.0%) |
| 35 to 44 Years | 87 (69.6%) | 0 (0.0%) |
| 45 to 54 Years | 141 (61.0%) | 13 (9.2%) |
| 55 to 59 Years | 209 (78.6%) | 0 (0.0%) |
| 60 to 64 Years | 262 (52.8%) | 12 (4.6%) |
| 65 to 74 Years | 496 (36.0%) | 17 (3.4%) |
| 75 Years and over | 0 (0.0%) | 0 (0.0%) |
| Total | 1,464 (34.1%) | 42 (2.9%) |
Employment Status by Educational Attainment in Holiday City South
According to labor force statistics for Holiday City South, 67.6% of individuals (913) out of the total population between 25 and 64 years of age (1,351) are in the labor force, with 2.7% or 25 of them being unemployed. The group with the highest labor force participation rate are those with the educational attainment of bachelor's degree or higher, with 77.6% or 291 individuals in the labor force. Within the labor force, individuals with high school diploma education have the highest percentage of unemployment, with 7.9% or 25 of them being unemployed.
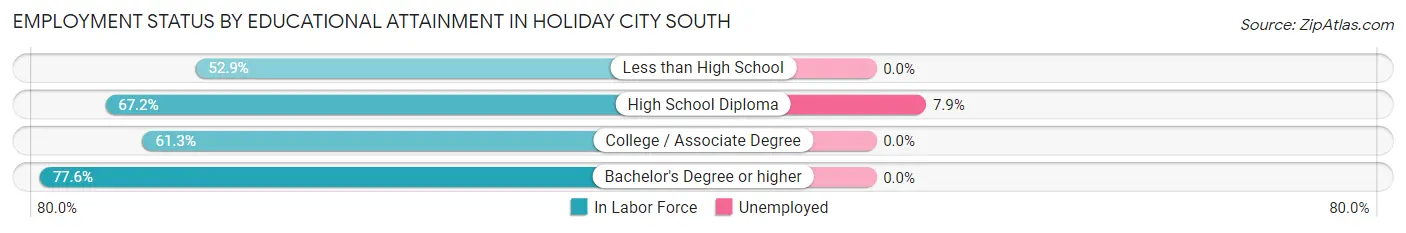
| Educational Attainment | In Labor Force | Unemployed |
| Less than High School | 27 (52.9%) | 0 (0.0%) |
| High School Diploma | 316 (67.2%) | 37 (7.9%) |
| College / Associate Degree | 279 (61.3%) | 0 (0.0%) |
| Bachelor's Degree or higher | 291 (77.6%) | 0 (0.0%) |
| Total | 913 (67.6%) | 36 (2.7%) |
Employment Occupations by Sex in Holiday City South
Management, Business, Science and Arts Occupations
The most common Management, Business, Science and Arts occupations in Holiday City South are Health Diagnosing & Treating (129 | 9.1%), Health Technologists (106 | 7.5%), Community & Social Service (102 | 7.2%), Management (95 | 6.7%), and Business & Financial (50 | 3.5%).
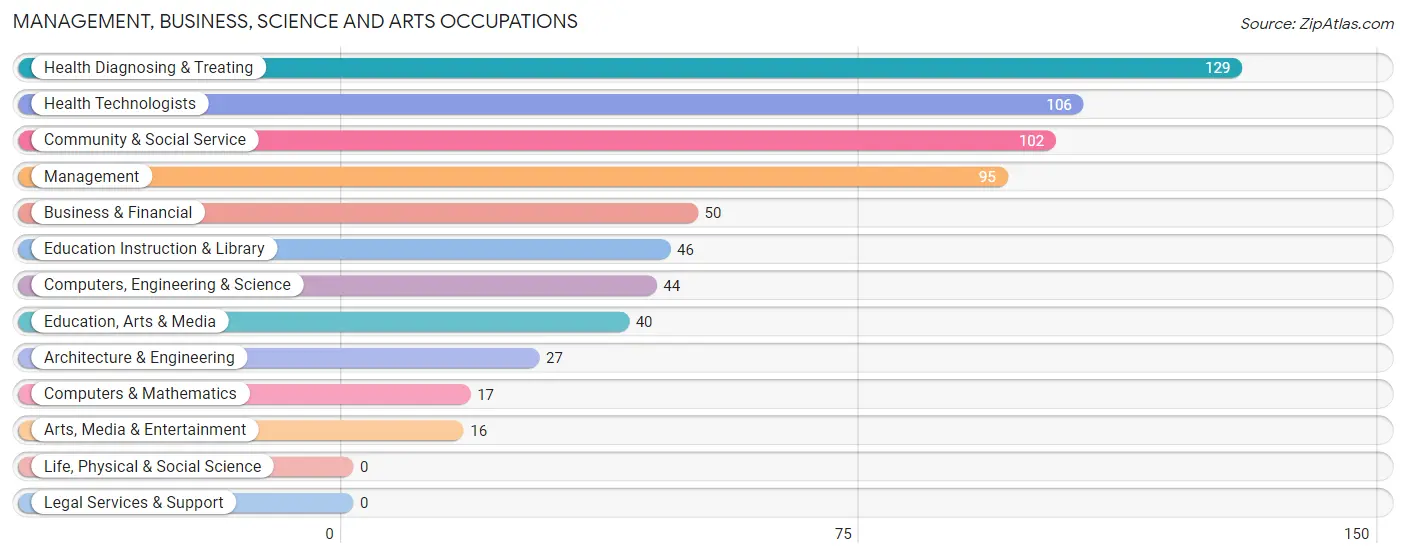
Management, Business, Science and Arts Occupations by Sex
Within the Management, Business, Science and Arts occupations in Holiday City South, the most male-oriented occupations are Computers, Engineering & Science (100.0%), Computers & Mathematics (100.0%), and Architecture & Engineering (100.0%), while the most female-oriented occupations are Health Diagnosing & Treating (100.0%), Health Technologists (100.0%), and Education, Arts & Media (77.5%).
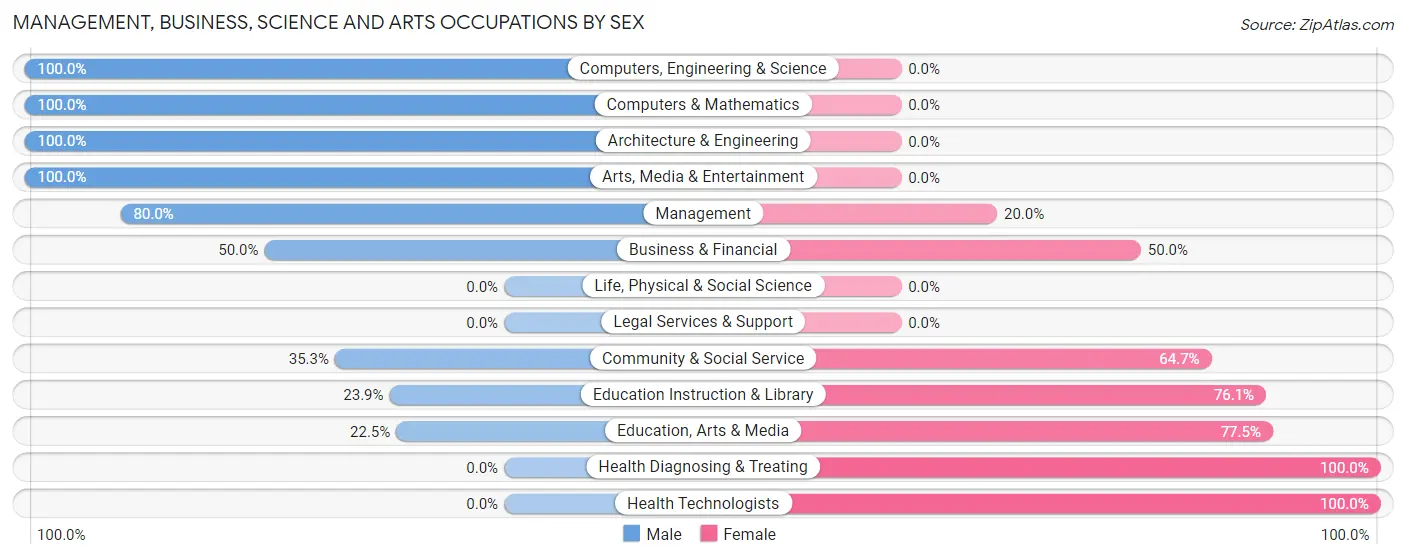
| Occupation | Male | Female |
| Management | 76 (80.0%) | 19 (20.0%) |
| Business & Financial | 25 (50.0%) | 25 (50.0%) |
| Computers, Engineering & Science | 44 (100.0%) | 0 (0.0%) |
| Computers & Mathematics | 17 (100.0%) | 0 (0.0%) |
| Architecture & Engineering | 27 (100.0%) | 0 (0.0%) |
| Life, Physical & Social Science | 0 (0.0%) | 0 (0.0%) |
| Community & Social Service | 36 (35.3%) | 66 (64.7%) |
| Education, Arts & Media | 9 (22.5%) | 31 (77.5%) |
| Legal Services & Support | 0 (0.0%) | 0 (0.0%) |
| Education Instruction & Library | 11 (23.9%) | 35 (76.1%) |
| Arts, Media & Entertainment | 16 (100.0%) | 0 (0.0%) |
| Health Diagnosing & Treating | 0 (0.0%) | 129 (100.0%) |
| Health Technologists | 0 (0.0%) | 106 (100.0%) |
| Total (Category) | 181 (43.1%) | 239 (56.9%) |
| Total (Overall) | 693 (48.8%) | 728 (51.2%) |
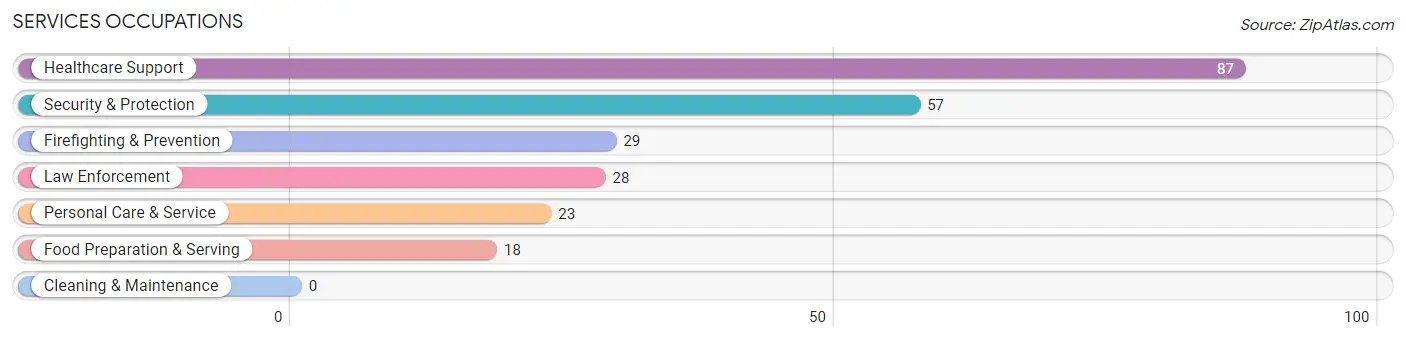
Services Occupations
The most common Services occupations in Holiday City South are Healthcare Support (87 | 6.1%), Security & Protection (57 | 4.0%), Firefighting & Prevention (29 | 2.0%), Law Enforcement (28 | 2.0%), and Personal Care & Service (23 | 1.6%).
Services Occupations by Sex
Within the Services occupations in Holiday City South, the most male-oriented occupations are Law Enforcement (57.1%), Personal Care & Service (47.8%), and Security & Protection (28.1%), while the most female-oriented occupations are Healthcare Support (100.0%), Firefighting & Prevention (100.0%), and Food Preparation & Serving (100.0%).
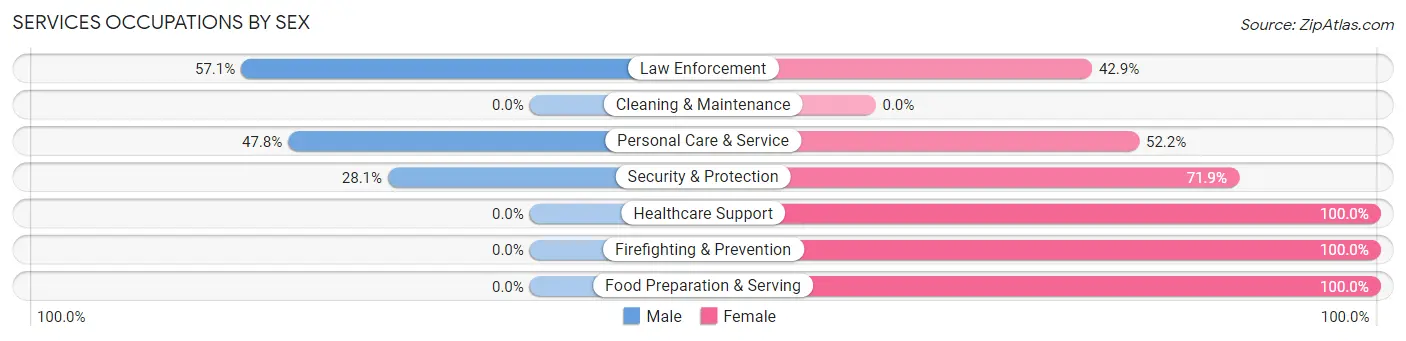
| Occupation | Male | Female |
| Healthcare Support | 0 (0.0%) | 87 (100.0%) |
| Security & Protection | 16 (28.1%) | 41 (71.9%) |
| Firefighting & Prevention | 0 (0.0%) | 29 (100.0%) |
| Law Enforcement | 16 (57.1%) | 12 (42.9%) |
| Food Preparation & Serving | 0 (0.0%) | 18 (100.0%) |
| Cleaning & Maintenance | 0 (0.0%) | 0 (0.0%) |
| Personal Care & Service | 11 (47.8%) | 12 (52.2%) |
| Total (Category) | 27 (14.6%) | 158 (85.4%) |
| Total (Overall) | 693 (48.8%) | 728 (51.2%) |
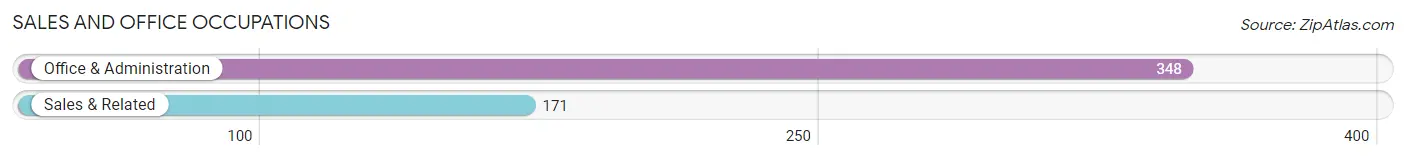
Sales and Office Occupations
The most common Sales and Office occupations in Holiday City South are Office & Administration (348 | 24.5%), and Sales & Related (171 | 12.0%).
Sales and Office Occupations by Sex
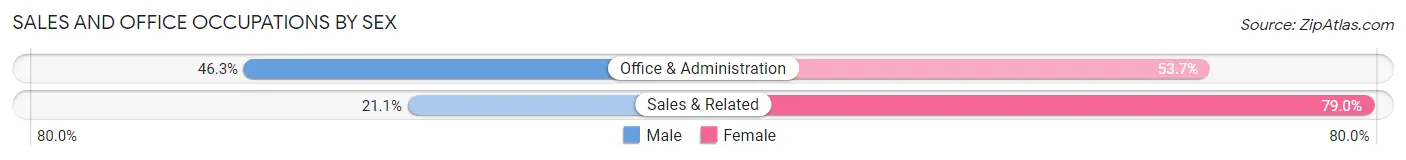
| Occupation | Male | Female |
| Sales & Related | 36 (21.0%) | 135 (78.9%) |
| Office & Administration | 161 (46.3%) | 187 (53.7%) |
| Total (Category) | 197 (38.0%) | 322 (62.0%) |
| Total (Overall) | 693 (48.8%) | 728 (51.2%) |
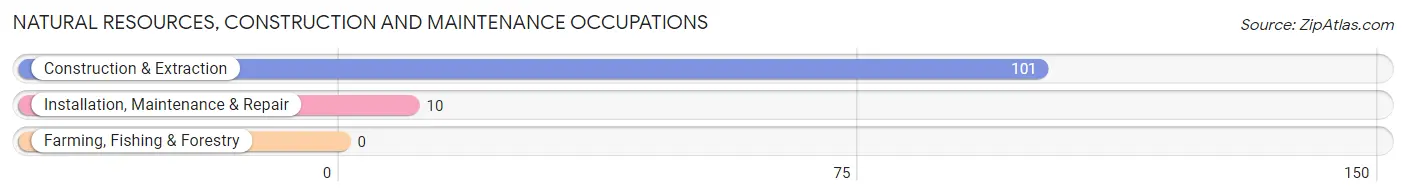
Natural Resources, Construction and Maintenance Occupations
The most common Natural Resources, Construction and Maintenance occupations in Holiday City South are Construction & Extraction (101 | 7.1%), and Installation, Maintenance & Repair (10 | 0.7%).
Natural Resources, Construction and Maintenance Occupations by Sex
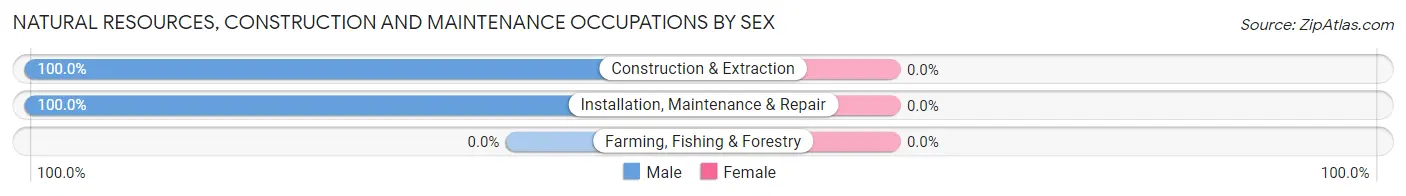
| Occupation | Male | Female |
| Farming, Fishing & Forestry | 0 (0.0%) | 0 (0.0%) |
| Construction & Extraction | 101 (100.0%) | 0 (0.0%) |
| Installation, Maintenance & Repair | 10 (100.0%) | 0 (0.0%) |
| Total (Category) | 111 (100.0%) | 0 (0.0%) |
| Total (Overall) | 693 (48.8%) | 728 (51.2%) |
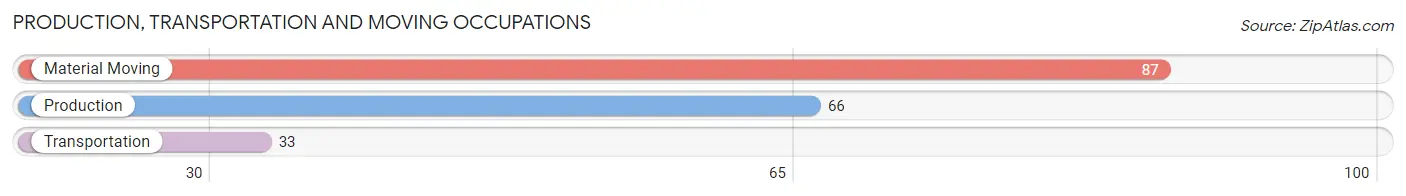
Production, Transportation and Moving Occupations
The most common Production, Transportation and Moving occupations in Holiday City South are Material Moving (87 | 6.1%), Production (66 | 4.6%), and Transportation (33 | 2.3%).
Production, Transportation and Moving Occupations by Sex
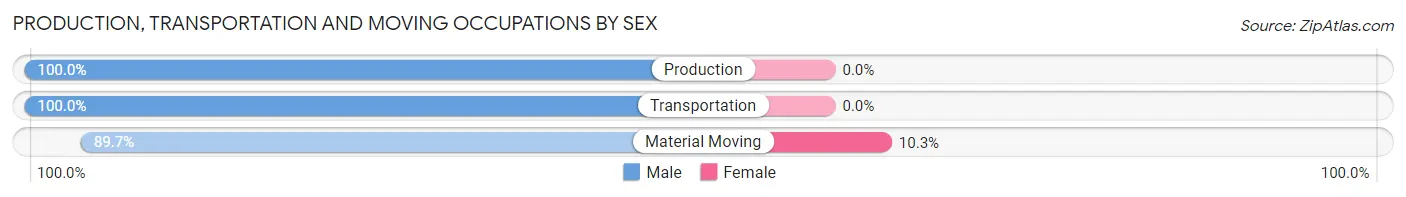
| Occupation | Male | Female |
| Production | 66 (100.0%) | 0 (0.0%) |
| Transportation | 33 (100.0%) | 0 (0.0%) |
| Material Moving | 78 (89.7%) | 9 (10.3%) |
| Total (Category) | 177 (95.2%) | 9 (4.8%) |
| Total (Overall) | 693 (48.8%) | 728 (51.2%) |
Employment Industries by Sex in Holiday City South
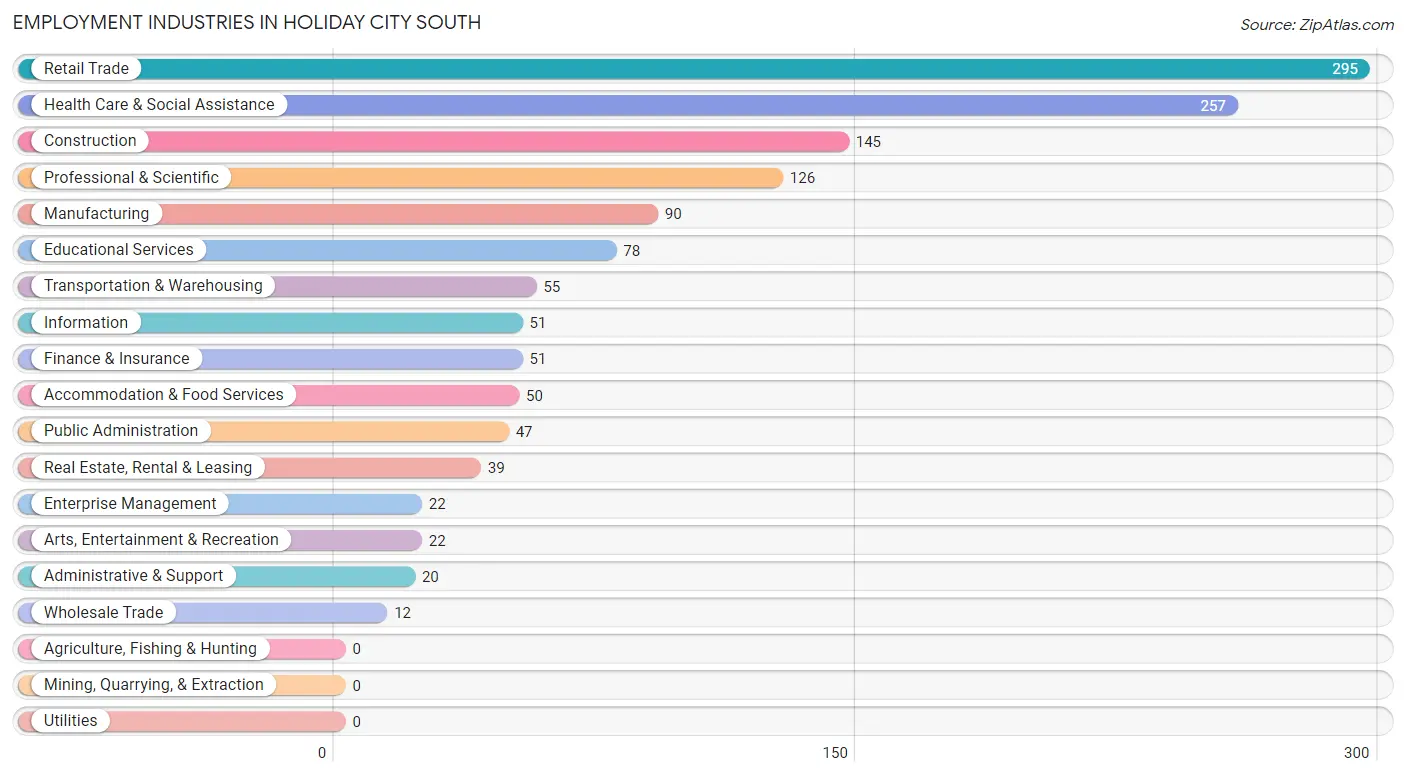
Employment Industries in Holiday City South
The major employment industries in Holiday City South include Retail Trade (295 | 20.8%), Health Care & Social Assistance (257 | 18.1%), Construction (145 | 10.2%), Professional & Scientific (126 | 8.9%), and Manufacturing (90 | 6.3%).
Employment Industries by Sex in Holiday City South
The Holiday City South industries that see more men than women are Manufacturing (100.0%), Transportation & Warehousing (100.0%), and Enterprise Management (100.0%), whereas the industries that tend to have a higher number of women are Wholesale Trade (100.0%), Administrative & Support (100.0%), and Health Care & Social Assistance (94.9%).
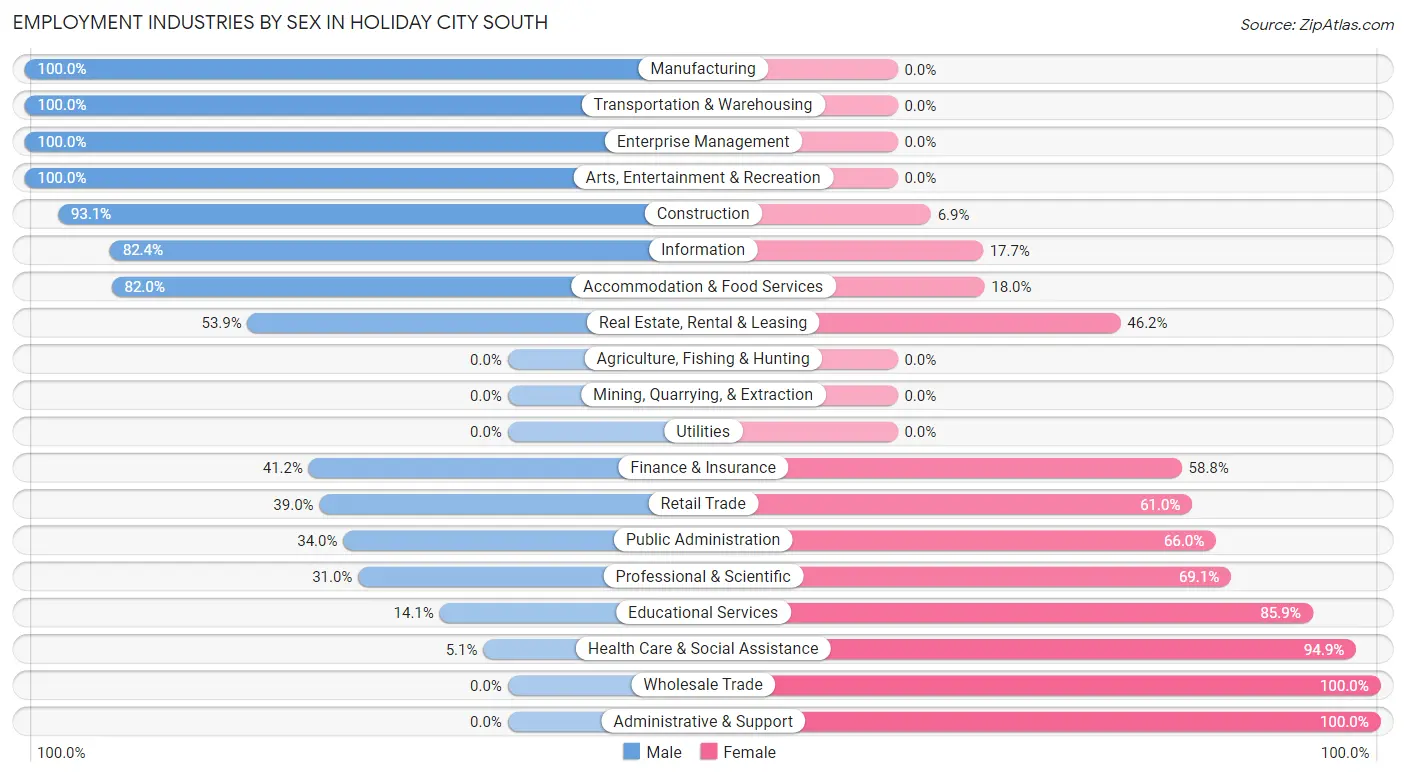
| Industry | Male | Female |
| Agriculture, Fishing & Hunting | 0 (0.0%) | 0 (0.0%) |
| Mining, Quarrying, & Extraction | 0 (0.0%) | 0 (0.0%) |
| Construction | 135 (93.1%) | 10 (6.9%) |
| Manufacturing | 90 (100.0%) | 0 (0.0%) |
| Wholesale Trade | 0 (0.0%) | 12 (100.0%) |
| Retail Trade | 115 (39.0%) | 180 (61.0%) |
| Transportation & Warehousing | 55 (100.0%) | 0 (0.0%) |
| Utilities | 0 (0.0%) | 0 (0.0%) |
| Information | 42 (82.4%) | 9 (17.6%) |
| Finance & Insurance | 21 (41.2%) | 30 (58.8%) |
| Real Estate, Rental & Leasing | 21 (53.8%) | 18 (46.2%) |
| Professional & Scientific | 39 (30.9%) | 87 (69.1%) |
| Enterprise Management | 22 (100.0%) | 0 (0.0%) |
| Administrative & Support | 0 (0.0%) | 20 (100.0%) |
| Educational Services | 11 (14.1%) | 67 (85.9%) |
| Health Care & Social Assistance | 13 (5.1%) | 244 (94.9%) |
| Arts, Entertainment & Recreation | 22 (100.0%) | 0 (0.0%) |
| Accommodation & Food Services | 41 (82.0%) | 9 (18.0%) |
| Public Administration | 16 (34.0%) | 31 (66.0%) |
| Total | 693 (48.8%) | 728 (51.2%) |
Education in Holiday City South
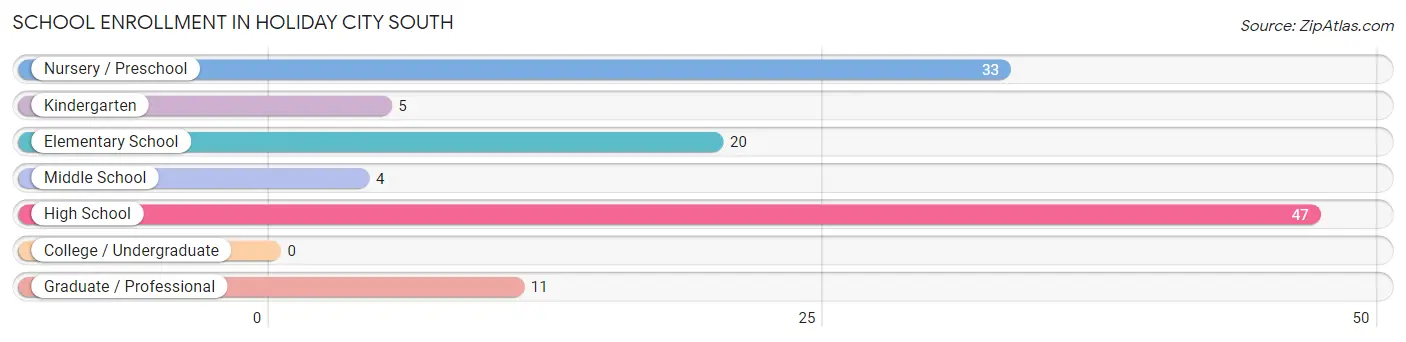
School Enrollment in Holiday City South
The most common levels of schooling among the 120 students in Holiday City South are high school (47 | 39.2%), nursery / preschool (33 | 27.5%), and elementary school (20 | 16.7%).
| School Level | # Students | % Students |
| Nursery / Preschool | 33 | 27.5% |
| Kindergarten | 5 | 4.2% |
| Elementary School | 20 | 16.7% |
| Middle School | 4 | 3.3% |
| High School | 47 | 39.2% |
| College / Undergraduate | 0 | 0.0% |
| Graduate / Professional | 11 | 9.2% |
| Total | 120 | 100.0% |
School Enrollment by Age by Funding Source in Holiday City South
Out of a total of 120 students who are enrolled in schools in Holiday City South, 11 (9.2%) attend a private institution, while the remaining 109 (90.8%) are enrolled in public schools. The age group of 25 to 34 year olds has the highest likelihood of being enrolled in private schools, with 11 (100.0% in the age bracket) enrolled. Conversely, the age group of 3 to 4 year olds has the lowest likelihood of being enrolled in a private school, with 21 (100.0% in the age bracket) attending a public institution.
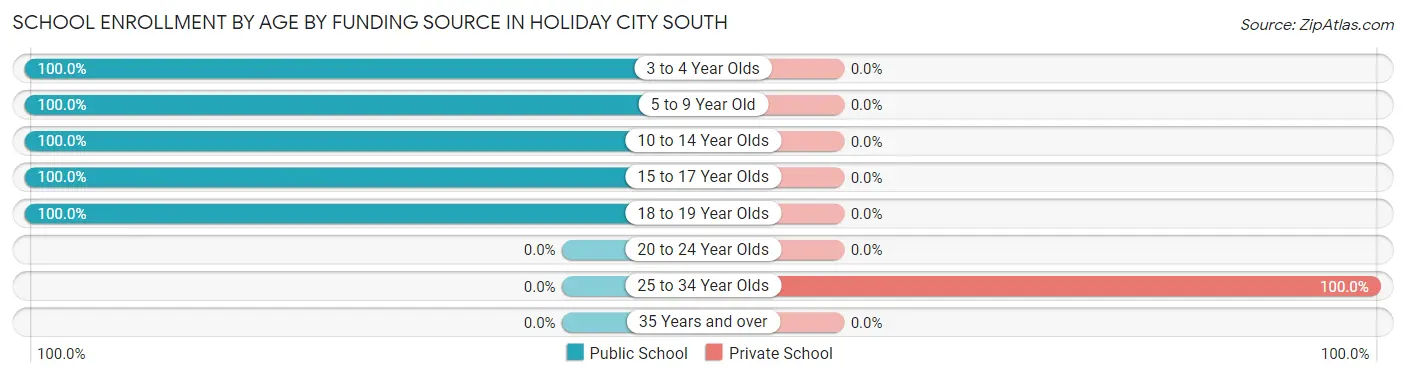
| Age Bracket | Public School | Private School |
| 3 to 4 Year Olds | 21 (100.0%) | 0 (0.0%) |
| 5 to 9 Year Old | 37 (100.0%) | 0 (0.0%) |
| 10 to 14 Year Olds | 4 (100.0%) | 0 (0.0%) |
| 15 to 17 Year Olds | 22 (100.0%) | 0 (0.0%) |
| 18 to 19 Year Olds | 25 (100.0%) | 0 (0.0%) |
| 20 to 24 Year Olds | 0 (0.0%) | 0 (0.0%) |
| 25 to 34 Year Olds | 0 (0.0%) | 11 (100.0%) |
| 35 Years and over | 0 (0.0%) | 0 (0.0%) |
| Total | 109 (90.8%) | 11 (9.2%) |
Educational Attainment by Field of Study in Holiday City South
Business (174 | 19.3%), education (146 | 16.2%), liberal arts & history (117 | 12.9%), science & technology (108 | 11.9%), and psychology (103 | 11.4%) are the most common fields of study among 904 individuals in Holiday City South who have obtained a bachelor's degree or higher.
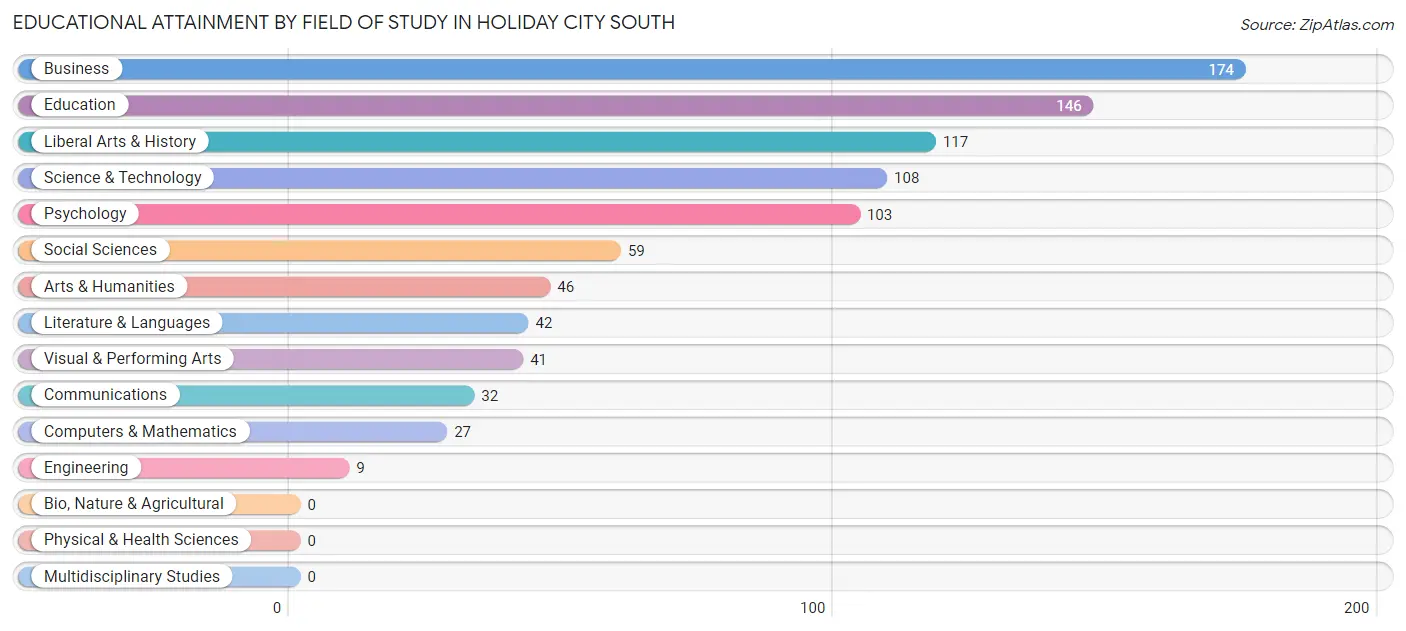
| Field of Study | # Graduates | % Graduates |
| Computers & Mathematics | 27 | 3.0% |
| Bio, Nature & Agricultural | 0 | 0.0% |
| Physical & Health Sciences | 0 | 0.0% |
| Psychology | 103 | 11.4% |
| Social Sciences | 59 | 6.5% |
| Engineering | 9 | 1.0% |
| Multidisciplinary Studies | 0 | 0.0% |
| Science & Technology | 108 | 11.9% |
| Business | 174 | 19.3% |
| Education | 146 | 16.2% |
| Literature & Languages | 42 | 4.6% |
| Liberal Arts & History | 117 | 12.9% |
| Visual & Performing Arts | 41 | 4.5% |
| Communications | 32 | 3.5% |
| Arts & Humanities | 46 | 5.1% |
| Total | 904 | 100.0% |
Transportation & Commute in Holiday City South
Vehicle Availability by Sex in Holiday City South
The most prevalent vehicle ownership categories in Holiday City South are males with 2 vehicles (378, accounting for 56.4%) and females with 2 vehicles (321, making up 51.9%).
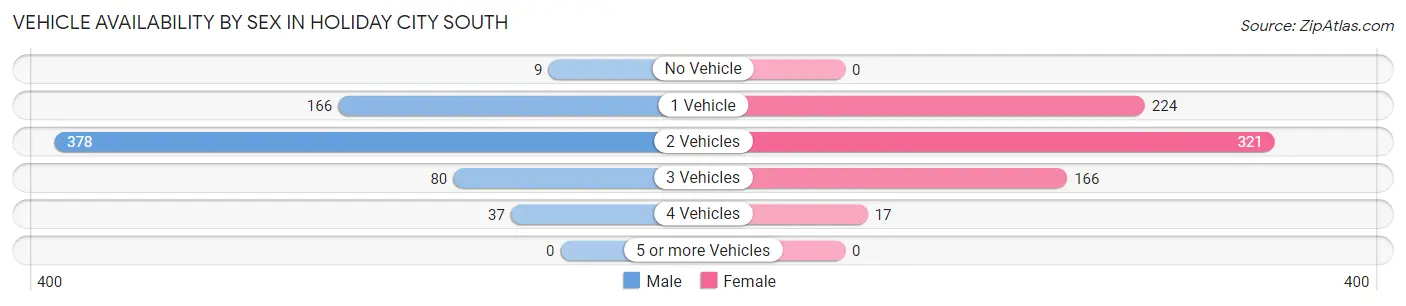
| Vehicles Available | Male | Female |
| No Vehicle | 9 (1.3%) | 0 (0.0%) |
| 1 Vehicle | 166 (24.8%) | 224 (30.8%) |
| 2 Vehicles | 378 (56.4%) | 321 (44.1%) |
| 3 Vehicles | 80 (11.9%) | 166 (22.8%) |
| 4 Vehicles | 37 (5.5%) | 17 (2.3%) |
| 5 or more Vehicles | 0 (0.0%) | 0 (0.0%) |
| Total | 670 (100.0%) | 728 (100.0%) |
Commute Time in Holiday City South
The most frequently occuring commute durations in Holiday City South are 15 to 19 minutes (241 commuters, 19.0%), 60 to 89 minutes (206 commuters, 16.2%), and 20 to 24 minutes (172 commuters, 13.5%).
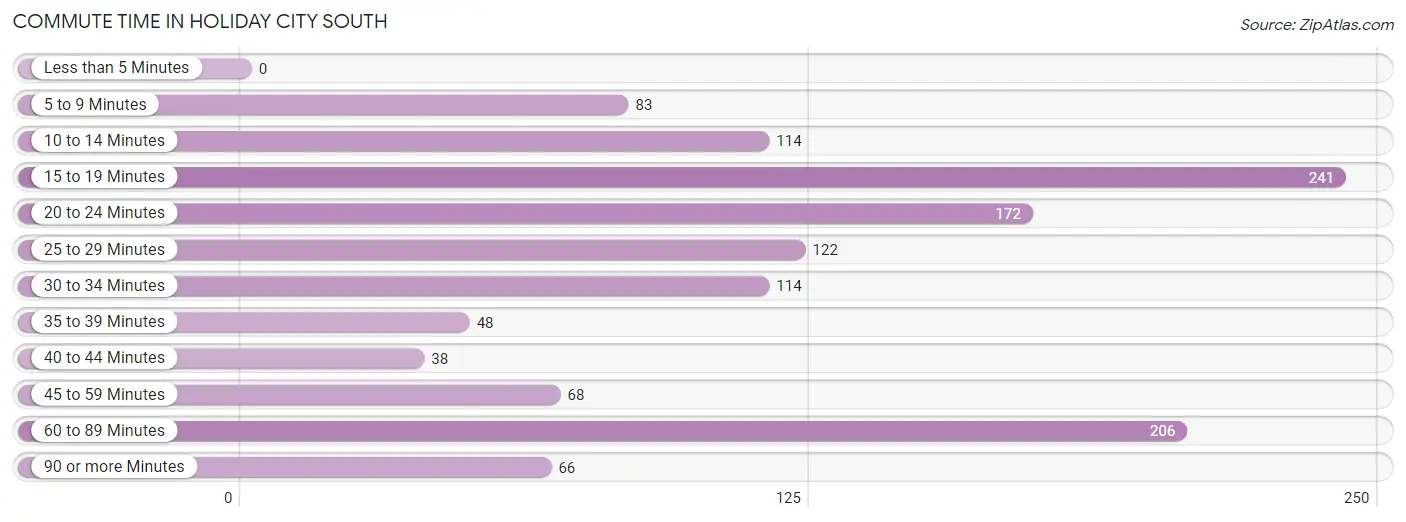
| Commute Time | # Commuters | % Commuters |
| Less than 5 Minutes | 0 | 0.0% |
| 5 to 9 Minutes | 83 | 6.5% |
| 10 to 14 Minutes | 114 | 9.0% |
| 15 to 19 Minutes | 241 | 19.0% |
| 20 to 24 Minutes | 172 | 13.5% |
| 25 to 29 Minutes | 122 | 9.6% |
| 30 to 34 Minutes | 114 | 9.0% |
| 35 to 39 Minutes | 48 | 3.8% |
| 40 to 44 Minutes | 38 | 3.0% |
| 45 to 59 Minutes | 68 | 5.3% |
| 60 to 89 Minutes | 206 | 16.2% |
| 90 or more Minutes | 66 | 5.2% |
Commute Time by Sex in Holiday City South
The most common commute times in Holiday City South are 60 to 89 minutes (110 commuters, 18.6%) for males and 15 to 19 minutes (157 commuters, 23.1%) for females.
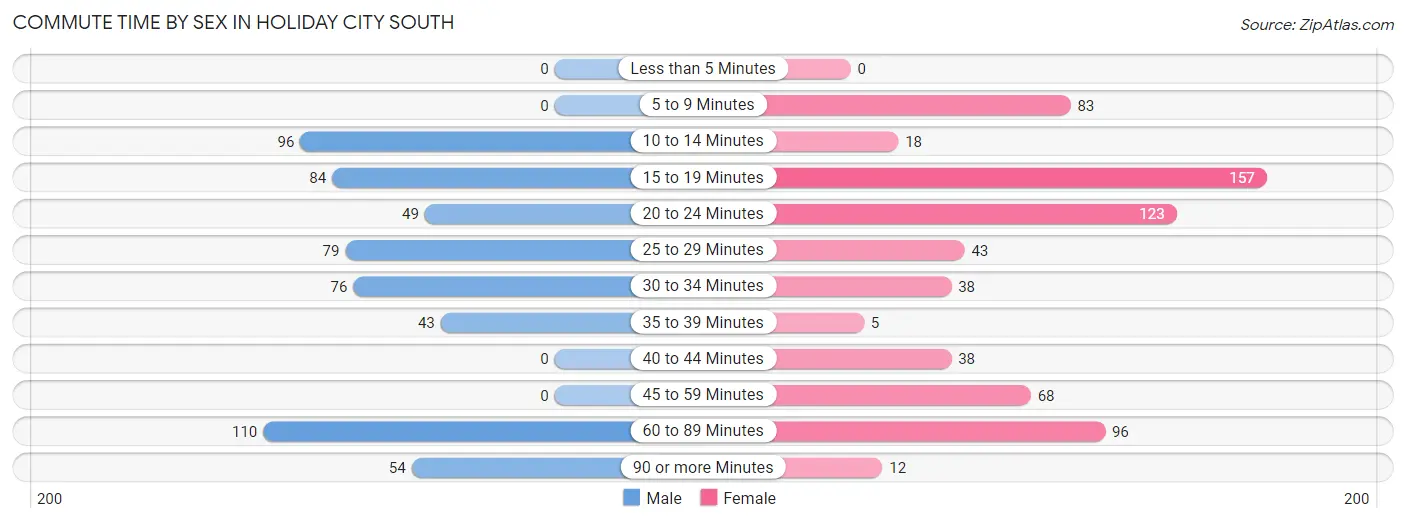
| Commute Time | Male | Female |
| Less than 5 Minutes | 0 (0.0%) | 0 (0.0%) |
| 5 to 9 Minutes | 0 (0.0%) | 83 (12.2%) |
| 10 to 14 Minutes | 96 (16.2%) | 18 (2.6%) |
| 15 to 19 Minutes | 84 (14.2%) | 157 (23.1%) |
| 20 to 24 Minutes | 49 (8.3%) | 123 (18.1%) |
| 25 to 29 Minutes | 79 (13.4%) | 43 (6.3%) |
| 30 to 34 Minutes | 76 (12.9%) | 38 (5.6%) |
| 35 to 39 Minutes | 43 (7.3%) | 5 (0.7%) |
| 40 to 44 Minutes | 0 (0.0%) | 38 (5.6%) |
| 45 to 59 Minutes | 0 (0.0%) | 68 (10.0%) |
| 60 to 89 Minutes | 110 (18.6%) | 96 (14.1%) |
| 90 or more Minutes | 54 (9.1%) | 12 (1.8%) |
Time of Departure to Work by Sex in Holiday City South
The most frequent times of departure to work in Holiday City South are 6:30 AM to 6:59 AM (103, 17.4%) for males and 8:00 AM to 8:29 AM (225, 33.0%) for females.
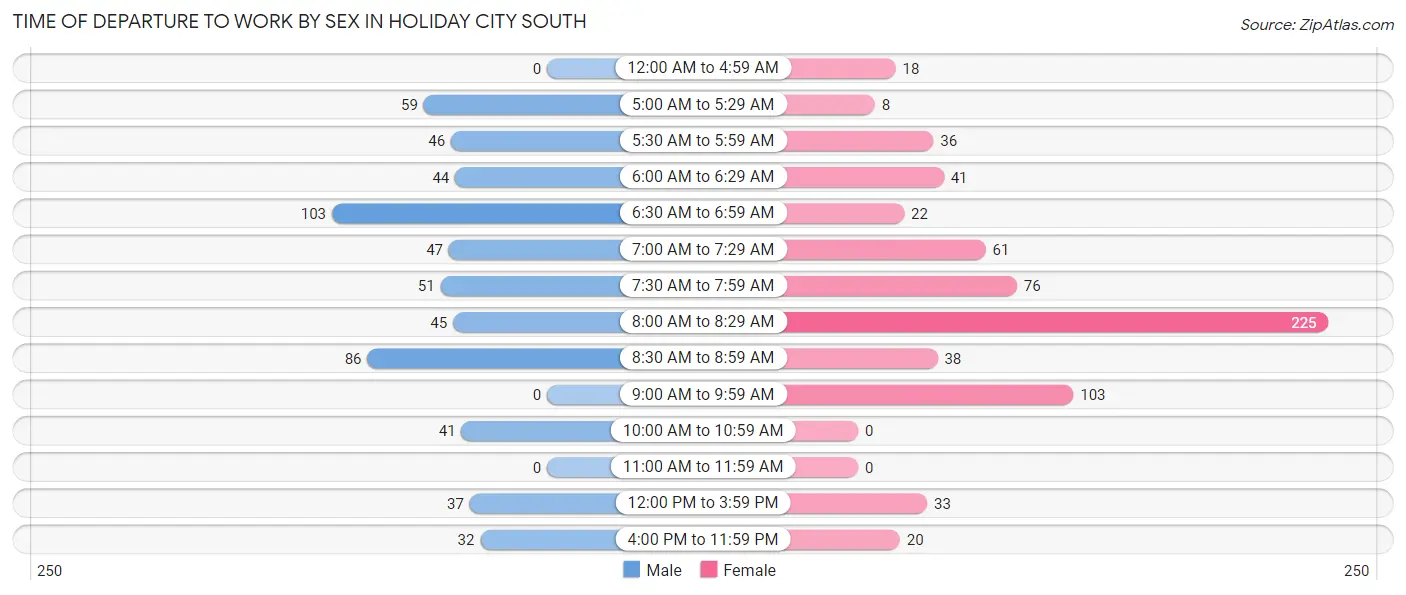
| Time of Departure | Male | Female |
| 12:00 AM to 4:59 AM | 0 (0.0%) | 18 (2.6%) |
| 5:00 AM to 5:29 AM | 59 (10.0%) | 8 (1.2%) |
| 5:30 AM to 5:59 AM | 46 (7.8%) | 36 (5.3%) |
| 6:00 AM to 6:29 AM | 44 (7.4%) | 41 (6.0%) |
| 6:30 AM to 6:59 AM | 103 (17.4%) | 22 (3.2%) |
| 7:00 AM to 7:29 AM | 47 (8.0%) | 61 (9.0%) |
| 7:30 AM to 7:59 AM | 51 (8.6%) | 76 (11.2%) |
| 8:00 AM to 8:29 AM | 45 (7.6%) | 225 (33.0%) |
| 8:30 AM to 8:59 AM | 86 (14.5%) | 38 (5.6%) |
| 9:00 AM to 9:59 AM | 0 (0.0%) | 103 (15.1%) |
| 10:00 AM to 10:59 AM | 41 (6.9%) | 0 (0.0%) |
| 11:00 AM to 11:59 AM | 0 (0.0%) | 0 (0.0%) |
| 12:00 PM to 3:59 PM | 37 (6.3%) | 33 (4.9%) |
| 4:00 PM to 11:59 PM | 32 (5.4%) | 20 (2.9%) |
| Total | 591 (100.0%) | 681 (100.0%) |
Housing Occupancy in Holiday City South
Occupancy by Ownership in Holiday City South
Of the total 2,468 dwellings in Holiday City South, owner-occupied units account for 2,201 (89.2%), while renter-occupied units make up 267 (10.8%).
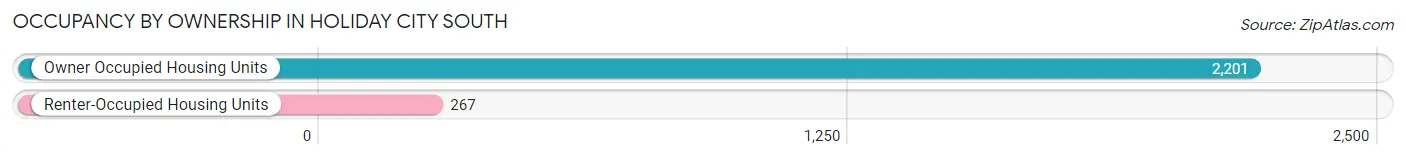
| Occupancy | # Housing Units | % Housing Units |
| Owner Occupied Housing Units | 2,201 | 89.2% |
| Renter-Occupied Housing Units | 267 | 10.8% |
| Total Occupied Housing Units | 2,468 | 100.0% |
Occupancy by Household Size in Holiday City South
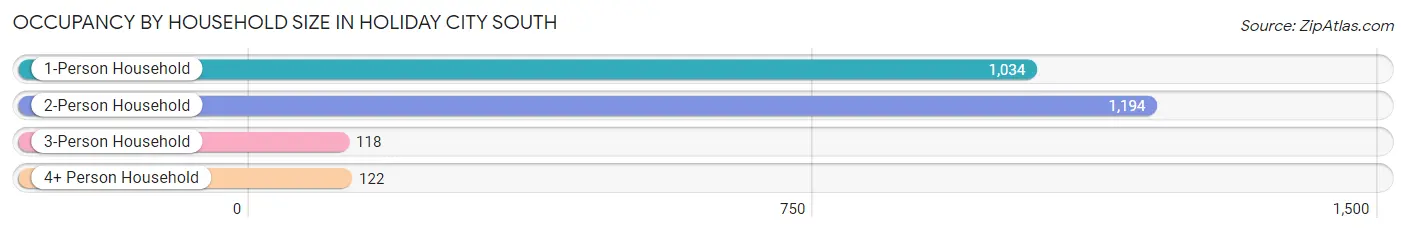
| Household Size | # Housing Units | % Housing Units |
| 1-Person Household | 1,034 | 41.9% |
| 2-Person Household | 1,194 | 48.4% |
| 3-Person Household | 118 | 4.8% |
| 4+ Person Household | 122 | 4.9% |
| Total Housing Units | 2,468 | 100.0% |
Occupancy by Ownership by Household Size in Holiday City South
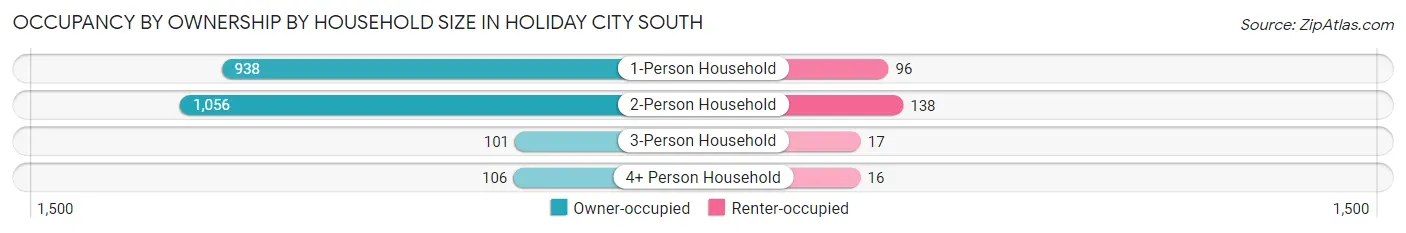
| Household Size | Owner-occupied | Renter-occupied |
| 1-Person Household | 938 (90.7%) | 96 (9.3%) |
| 2-Person Household | 1,056 (88.4%) | 138 (11.6%) |
| 3-Person Household | 101 (85.6%) | 17 (14.4%) |
| 4+ Person Household | 106 (86.9%) | 16 (13.1%) |
| Total Housing Units | 2,201 (89.2%) | 267 (10.8%) |
Occupancy by Educational Attainment in Holiday City South
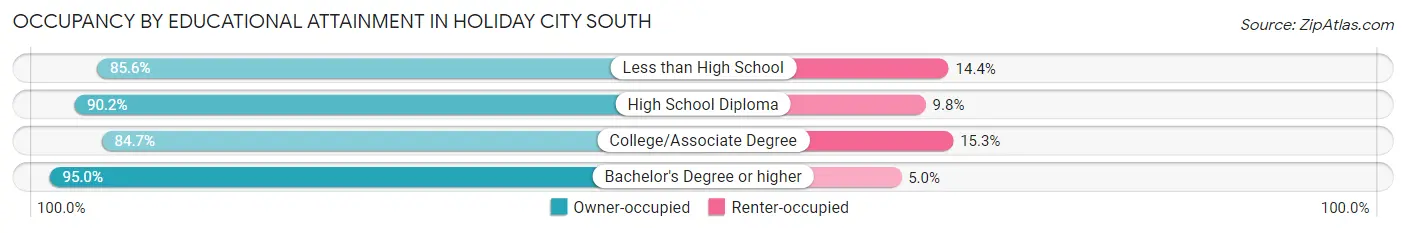
| Household Size | Owner-occupied | Renter-occupied |
| Less than High School | 143 (85.6%) | 24 (14.4%) |
| High School Diploma | 864 (90.2%) | 94 (9.8%) |
| College/Associate Degree | 677 (84.7%) | 122 (15.3%) |
| Bachelor's Degree or higher | 517 (95.0%) | 27 (5.0%) |
Occupancy by Age of Householder in Holiday City South
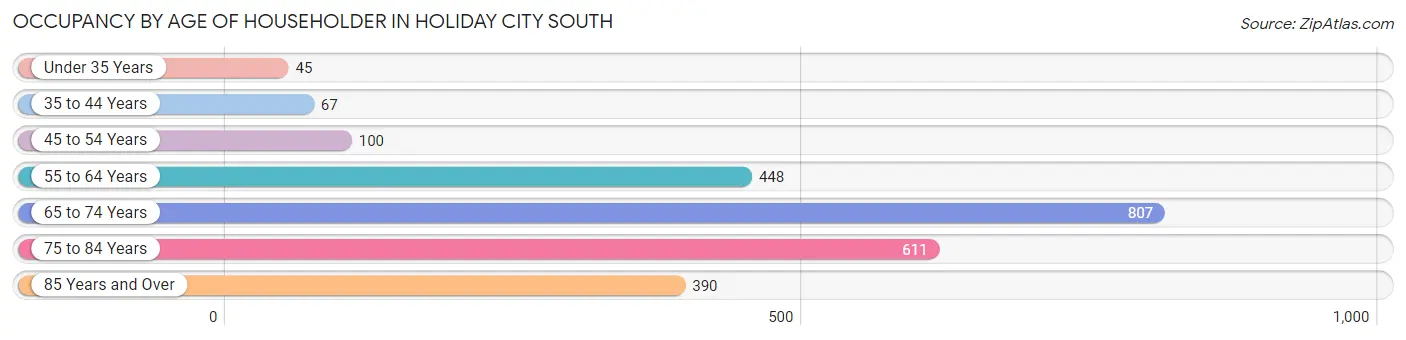
| Age Bracket | # Households | % Households |
| Under 35 Years | 45 | 1.8% |
| 35 to 44 Years | 67 | 2.7% |
| 45 to 54 Years | 100 | 4.1% |
| 55 to 64 Years | 448 | 18.1% |
| 65 to 74 Years | 807 | 32.7% |
| 75 to 84 Years | 611 | 24.8% |
| 85 Years and Over | 390 | 15.8% |
| Total | 2,468 | 100.0% |
Housing Finances in Holiday City South
Median Income by Occupancy in Holiday City South
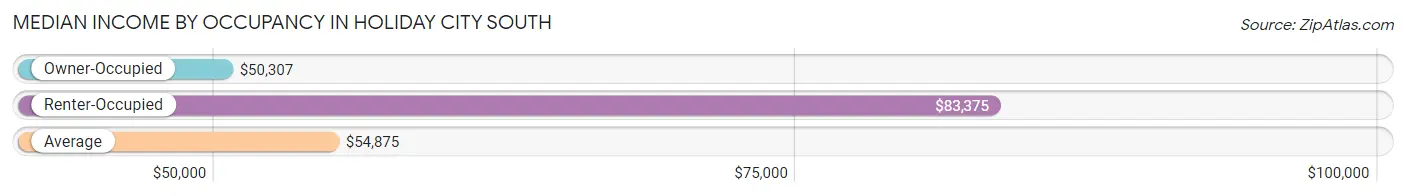
| Occupancy Type | # Households | Median Income |
| Owner-Occupied | 2,201 (89.2%) | $50,307 |
| Renter-Occupied | 267 (10.8%) | $83,375 |
| Average | 2,468 (100.0%) | $54,875 |
Occupancy by Householder Income Bracket in Holiday City South
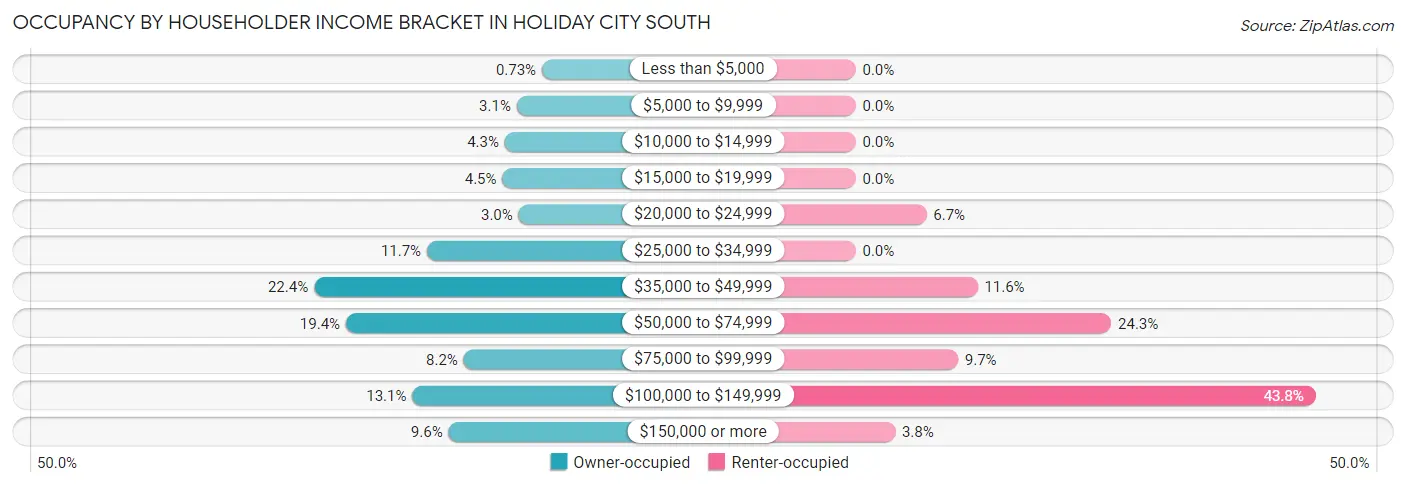
| Income Bracket | Owner-occupied | Renter-occupied |
| Less than $5,000 | 16 (0.7%) | 0 (0.0%) |
| $5,000 to $9,999 | 69 (3.1%) | 0 (0.0%) |
| $10,000 to $14,999 | 94 (4.3%) | 0 (0.0%) |
| $15,000 to $19,999 | 99 (4.5%) | 0 (0.0%) |
| $20,000 to $24,999 | 65 (2.9%) | 18 (6.7%) |
| $25,000 to $34,999 | 257 (11.7%) | 0 (0.0%) |
| $35,000 to $49,999 | 494 (22.4%) | 31 (11.6%) |
| $50,000 to $74,999 | 427 (19.4%) | 65 (24.3%) |
| $75,000 to $99,999 | 180 (8.2%) | 26 (9.7%) |
| $100,000 to $149,999 | 288 (13.1%) | 117 (43.8%) |
| $150,000 or more | 212 (9.6%) | 10 (3.7%) |
| Total | 2,201 (100.0%) | 267 (100.0%) |
Monthly Housing Cost Tiers in Holiday City South
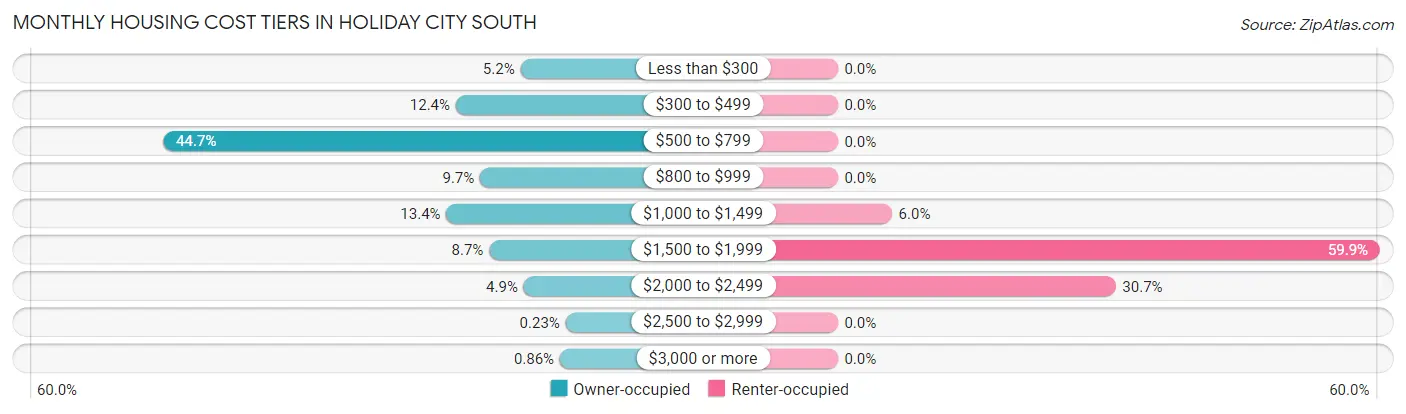
| Monthly Cost | Owner-occupied | Renter-occupied |
| Less than $300 | 115 (5.2%) | 0 (0.0%) |
| $300 to $499 | 272 (12.4%) | 0 (0.0%) |
| $500 to $799 | 984 (44.7%) | 0 (0.0%) |
| $800 to $999 | 213 (9.7%) | 0 (0.0%) |
| $1,000 to $1,499 | 295 (13.4%) | 16 (6.0%) |
| $1,500 to $1,999 | 191 (8.7%) | 160 (59.9%) |
| $2,000 to $2,499 | 107 (4.9%) | 82 (30.7%) |
| $2,500 to $2,999 | 5 (0.2%) | 0 (0.0%) |
| $3,000 or more | 19 (0.9%) | 0 (0.0%) |
| Total | 2,201 (100.0%) | 267 (100.0%) |
Physical Housing Characteristics in Holiday City South
Housing Structures in Holiday City South
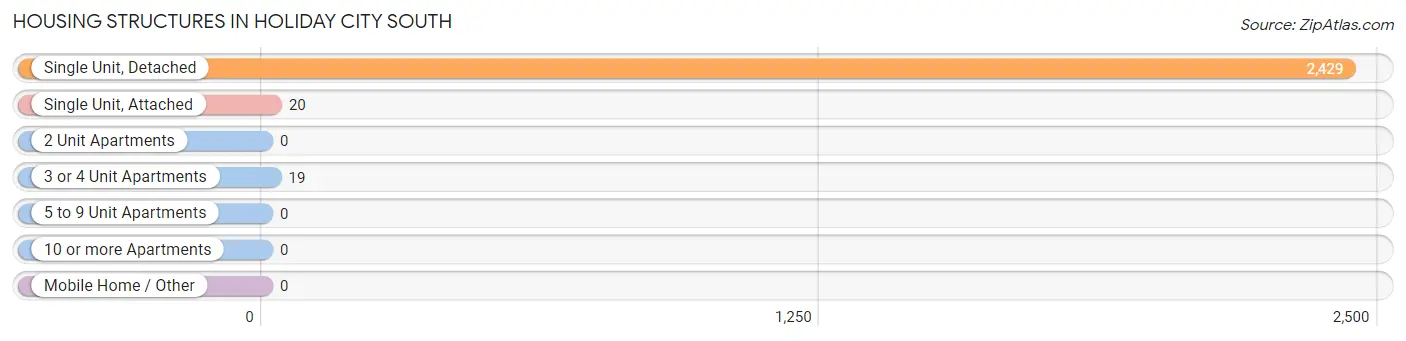
| Structure Type | # Housing Units | % Housing Units |
| Single Unit, Detached | 2,429 | 98.4% |
| Single Unit, Attached | 20 | 0.8% |
| 2 Unit Apartments | 0 | 0.0% |
| 3 or 4 Unit Apartments | 19 | 0.8% |
| 5 to 9 Unit Apartments | 0 | 0.0% |
| 10 or more Apartments | 0 | 0.0% |
| Mobile Home / Other | 0 | 0.0% |
| Total | 2,468 | 100.0% |
Housing Structures by Occupancy in Holiday City South
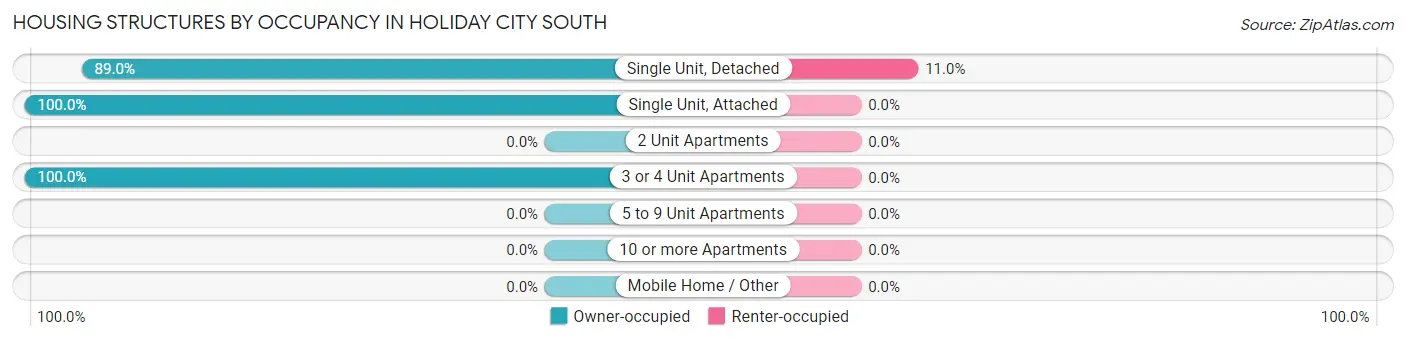
| Structure Type | Owner-occupied | Renter-occupied |
| Single Unit, Detached | 2,162 (89.0%) | 267 (11.0%) |
| Single Unit, Attached | 20 (100.0%) | 0 (0.0%) |
| 2 Unit Apartments | 0 (0.0%) | 0 (0.0%) |
| 3 or 4 Unit Apartments | 19 (100.0%) | 0 (0.0%) |
| 5 to 9 Unit Apartments | 0 (0.0%) | 0 (0.0%) |
| 10 or more Apartments | 0 (0.0%) | 0 (0.0%) |
| Mobile Home / Other | 0 (0.0%) | 0 (0.0%) |
| Total | 2,201 (89.2%) | 267 (10.8%) |
Housing Structures by Number of Rooms in Holiday City South
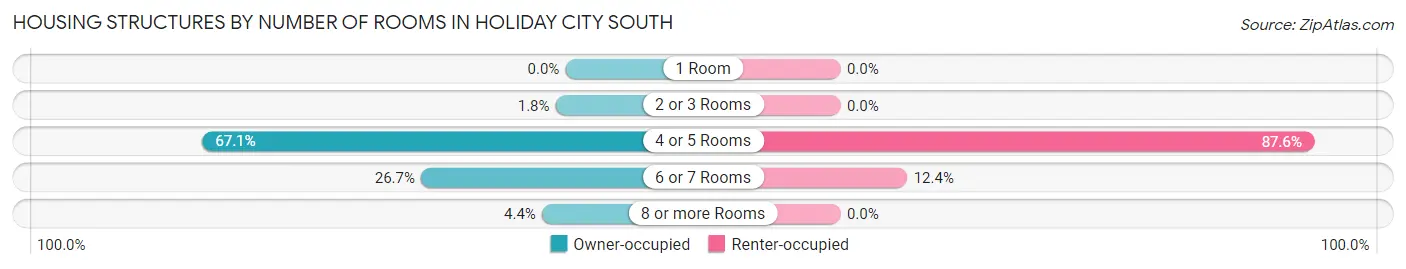
| Number of Rooms | Owner-occupied | Renter-occupied |
| 1 Room | 0 (0.0%) | 0 (0.0%) |
| 2 or 3 Rooms | 40 (1.8%) | 0 (0.0%) |
| 4 or 5 Rooms | 1,477 (67.1%) | 234 (87.6%) |
| 6 or 7 Rooms | 588 (26.7%) | 33 (12.4%) |
| 8 or more Rooms | 96 (4.4%) | 0 (0.0%) |
| Total | 2,201 (100.0%) | 267 (100.0%) |
Housing Structure by Heating Type in Holiday City South
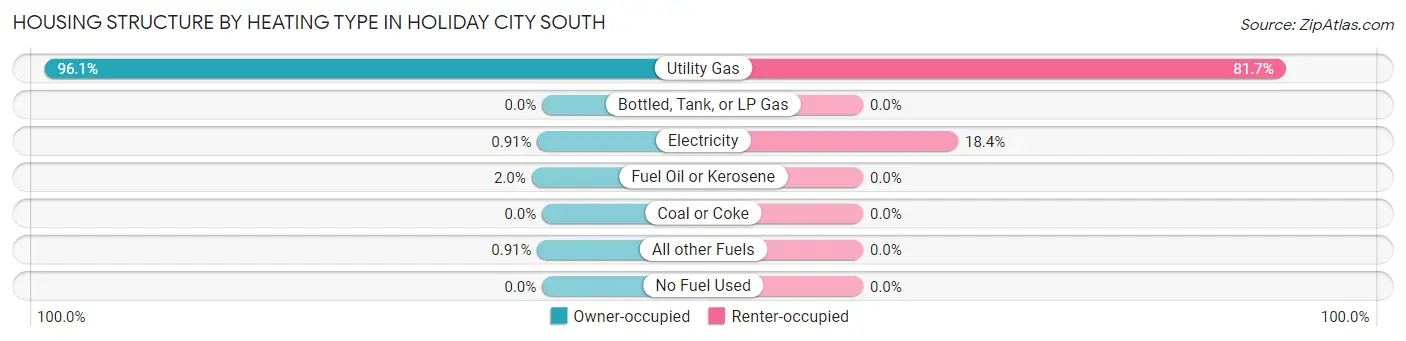
| Heating Type | Owner-occupied | Renter-occupied |
| Utility Gas | 2,116 (96.1%) | 218 (81.7%) |
| Bottled, Tank, or LP Gas | 0 (0.0%) | 0 (0.0%) |
| Electricity | 20 (0.9%) | 49 (18.3%) |
| Fuel Oil or Kerosene | 45 (2.0%) | 0 (0.0%) |
| Coal or Coke | 0 (0.0%) | 0 (0.0%) |
| All other Fuels | 20 (0.9%) | 0 (0.0%) |
| No Fuel Used | 0 (0.0%) | 0 (0.0%) |
| Total | 2,201 (100.0%) | 267 (100.0%) |
Household Vehicle Usage in Holiday City South
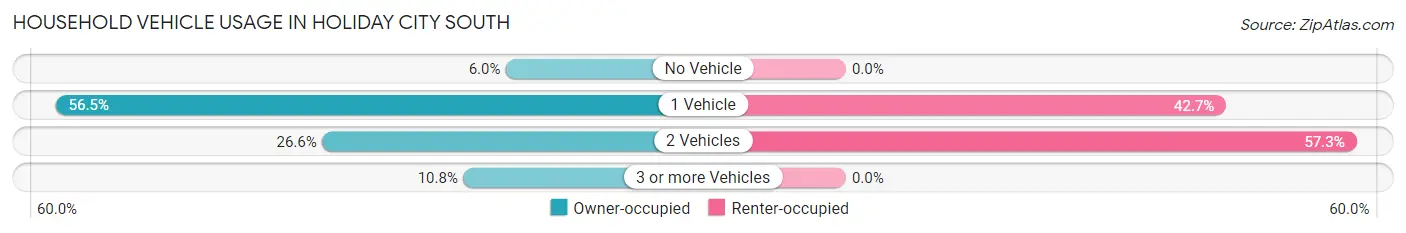
| Vehicles per Household | Owner-occupied | Renter-occupied |
| No Vehicle | 133 (6.0%) | 0 (0.0%) |
| 1 Vehicle | 1,244 (56.5%) | 114 (42.7%) |
| 2 Vehicles | 586 (26.6%) | 153 (57.3%) |
| 3 or more Vehicles | 238 (10.8%) | 0 (0.0%) |
| Total | 2,201 (100.0%) | 267 (100.0%) |
Real Estate & Mortgages in Holiday City South
Real Estate and Mortgage Overview in Holiday City South
| Characteristic | Without Mortgage | With Mortgage |
| Housing Units | 1,517 | 684 |
| Median Property Value | $226,700 | $256,500 |
| Median Household Income | $46,188 | $74 |
| Monthly Housing Costs | $608 | $19 |
| Real Estate Taxes | $3,256 | $0 |
Property Value by Mortgage Status in Holiday City South
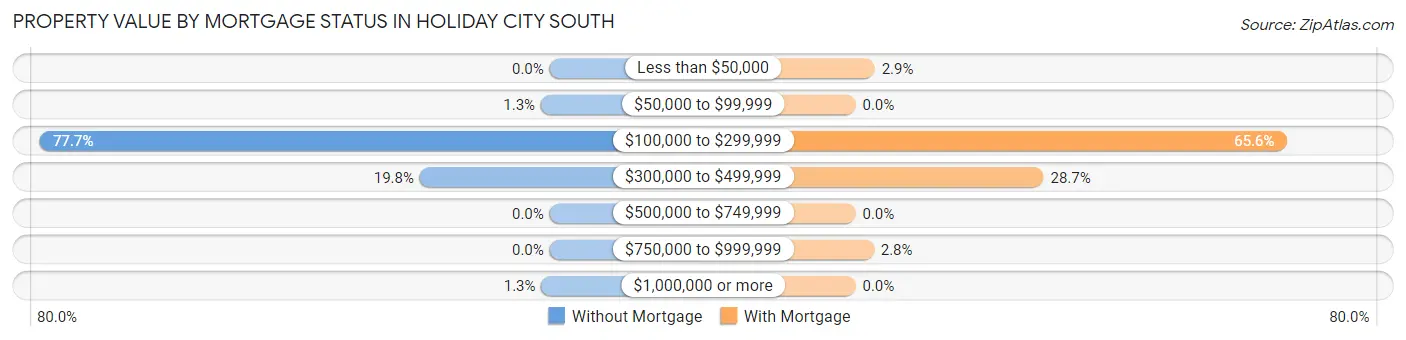
| Property Value | Without Mortgage | With Mortgage |
| Less than $50,000 | 0 (0.0%) | 20 (2.9%) |
| $50,000 to $99,999 | 20 (1.3%) | 0 (0.0%) |
| $100,000 to $299,999 | 1,178 (77.6%) | 449 (65.6%) |
| $300,000 to $499,999 | 300 (19.8%) | 196 (28.6%) |
| $500,000 to $749,999 | 0 (0.0%) | 0 (0.0%) |
| $750,000 to $999,999 | 0 (0.0%) | 19 (2.8%) |
| $1,000,000 or more | 19 (1.3%) | 0 (0.0%) |
| Total | 1,517 (100.0%) | 684 (100.0%) |
Household Income by Mortgage Status in Holiday City South
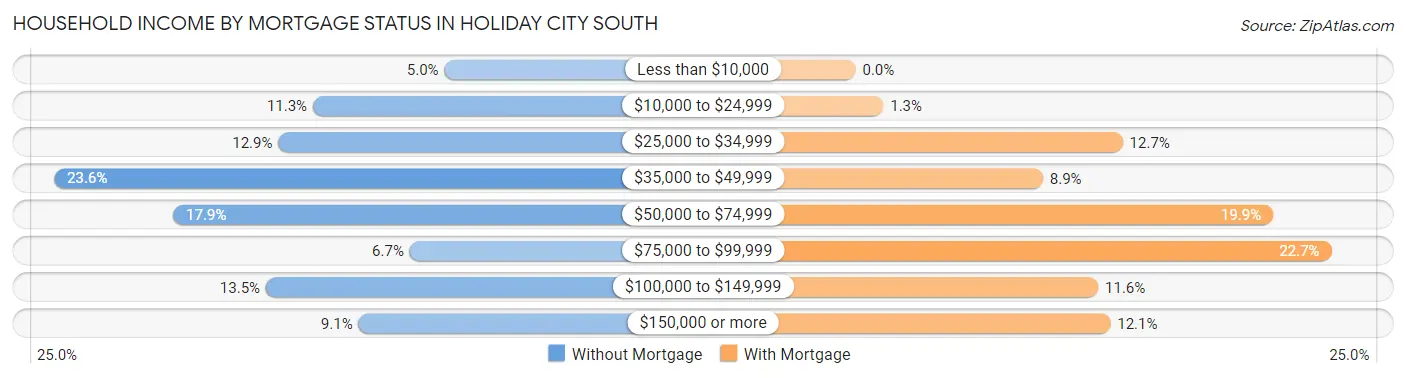
| Household Income | Without Mortgage | With Mortgage |
| Less than $10,000 | 76 (5.0%) | 0 (0.0%) |
| $10,000 to $24,999 | 171 (11.3%) | 9 (1.3%) |
| $25,000 to $34,999 | 196 (12.9%) | 87 (12.7%) |
| $35,000 to $49,999 | 358 (23.6%) | 61 (8.9%) |
| $50,000 to $74,999 | 272 (17.9%) | 136 (19.9%) |
| $75,000 to $99,999 | 101 (6.7%) | 155 (22.7%) |
| $100,000 to $149,999 | 205 (13.5%) | 79 (11.6%) |
| $150,000 or more | 138 (9.1%) | 83 (12.1%) |
| Total | 1,517 (100.0%) | 684 (100.0%) |
Property Value to Household Income Ratio in Holiday City South
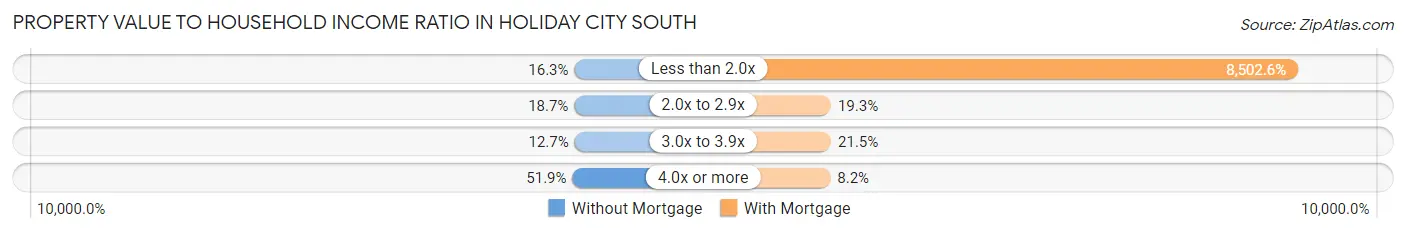
| Value-to-Income Ratio | Without Mortgage | With Mortgage |
| Less than 2.0x | 247 (16.3%) | 58,158 (8,502.6%) |
| 2.0x to 2.9x | 284 (18.7%) | 132 (19.3%) |
| 3.0x to 3.9x | 192 (12.7%) | 147 (21.5%) |
| 4.0x or more | 787 (51.9%) | 56 (8.2%) |
| Total | 1,517 (100.0%) | 684 (100.0%) |
Real Estate Taxes by Mortgage Status in Holiday City South
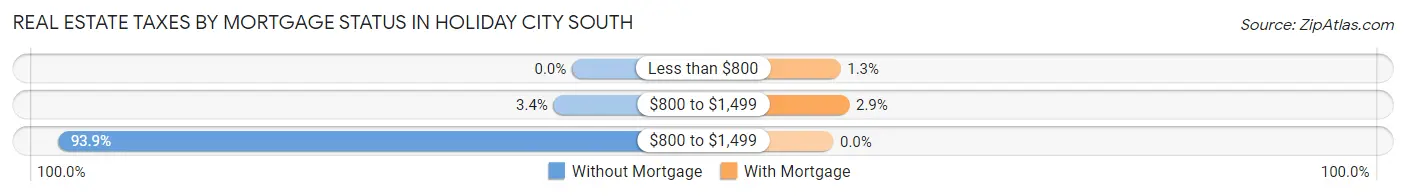
| Property Taxes | Without Mortgage | With Mortgage |
| Less than $800 | 0 (0.0%) | 9 (1.3%) |
| $800 to $1,499 | 51 (3.4%) | 20 (2.9%) |
| $800 to $1,499 | 1,425 (93.9%) | 0 (0.0%) |
| Total | 1,517 (100.0%) | 684 (100.0%) |
Health & Disability in Holiday City South
Health Insurance Coverage by Age in Holiday City South
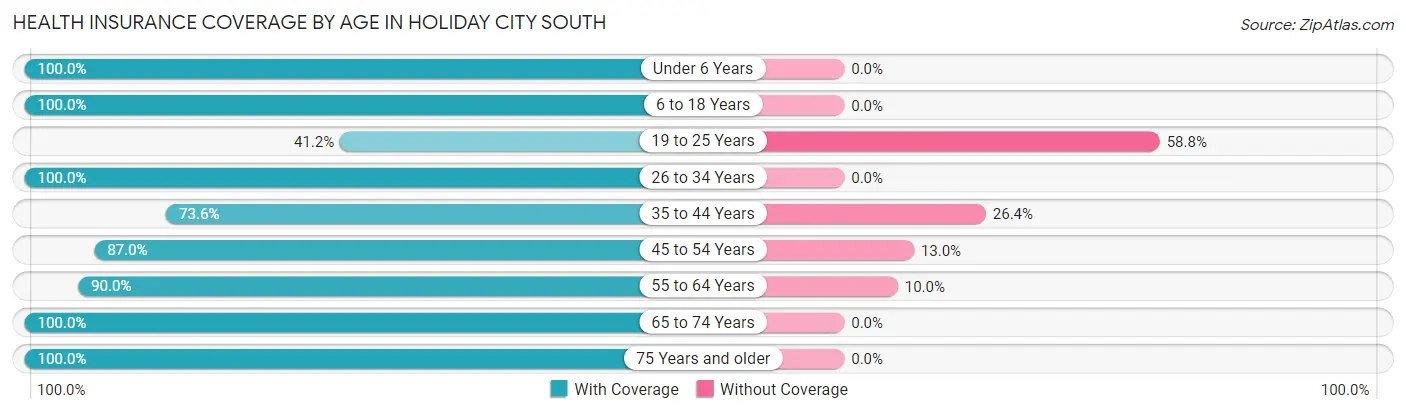
| Age Bracket | With Coverage | Without Coverage |
| Under 6 Years | 89 (100.0%) | 0 (0.0%) |
| 6 to 18 Years | 76 (100.0%) | 0 (0.0%) |
| 19 to 25 Years | 21 (41.2%) | 30 (58.8%) |
| 26 to 34 Years | 211 (100.0%) | 0 (0.0%) |
| 35 to 44 Years | 92 (73.6%) | 33 (26.4%) |
| 45 to 54 Years | 201 (87.0%) | 30 (13.0%) |
| 55 to 64 Years | 686 (90.0%) | 76 (10.0%) |
| 65 to 74 Years | 1,377 (100.0%) | 0 (0.0%) |
| 75 Years and older | 1,490 (100.0%) | 0 (0.0%) |
| Total | 4,243 (96.2%) | 169 (3.8%) |
Health Insurance Coverage by Citizenship Status in Holiday City South
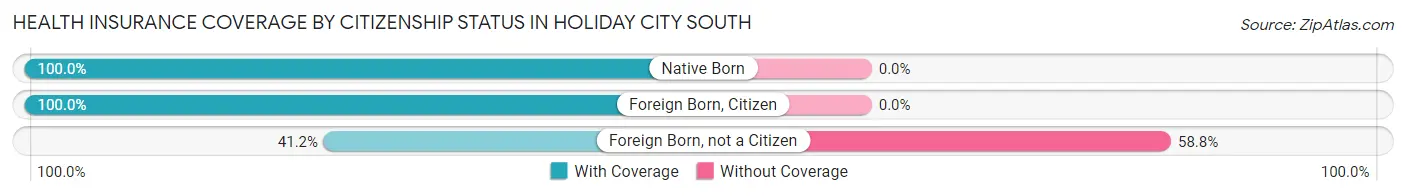
| Citizenship Status | With Coverage | Without Coverage |
| Native Born | 89 (100.0%) | 0 (0.0%) |
| Foreign Born, Citizen | 76 (100.0%) | 0 (0.0%) |
| Foreign Born, not a Citizen | 21 (41.2%) | 30 (58.8%) |
Health Insurance Coverage by Household Income in Holiday City South
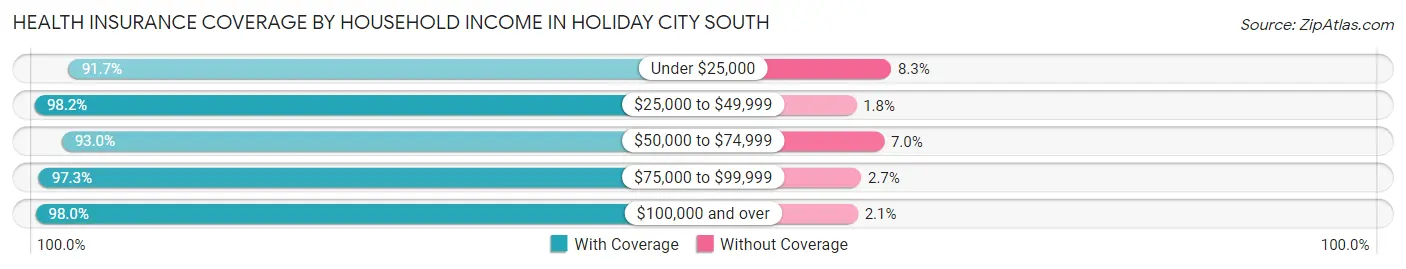
| Household Income | With Coverage | Without Coverage |
| Under $25,000 | 454 (91.7%) | 41 (8.3%) |
| $25,000 to $49,999 | 1,119 (98.2%) | 20 (1.8%) |
| $50,000 to $74,999 | 922 (93.0%) | 69 (7.0%) |
| $75,000 to $99,999 | 365 (97.3%) | 10 (2.7%) |
| $100,000 and over | 1,383 (98.0%) | 29 (2.1%) |
Public vs Private Health Insurance Coverage by Age in Holiday City South
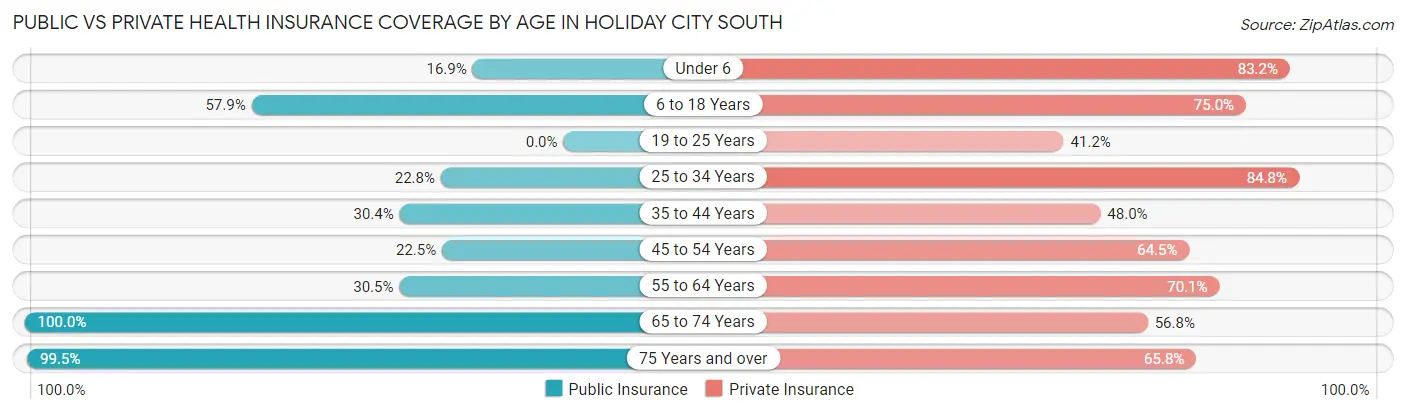
| Age Bracket | Public Insurance | Private Insurance |
| Under 6 | 15 (16.9%) | 74 (83.2%) |
| 6 to 18 Years | 44 (57.9%) | 57 (75.0%) |
| 19 to 25 Years | 0 (0.0%) | 21 (41.2%) |
| 25 to 34 Years | 48 (22.8%) | 179 (84.8%) |
| 35 to 44 Years | 38 (30.4%) | 60 (48.0%) |
| 45 to 54 Years | 52 (22.5%) | 149 (64.5%) |
| 55 to 64 Years | 232 (30.4%) | 534 (70.1%) |
| 65 to 74 Years | 1,377 (100.0%) | 782 (56.8%) |
| 75 Years and over | 1,483 (99.5%) | 980 (65.8%) |
| Total | 3,289 (74.6%) | 2,836 (64.3%) |
Disability Status by Sex by Age in Holiday City South
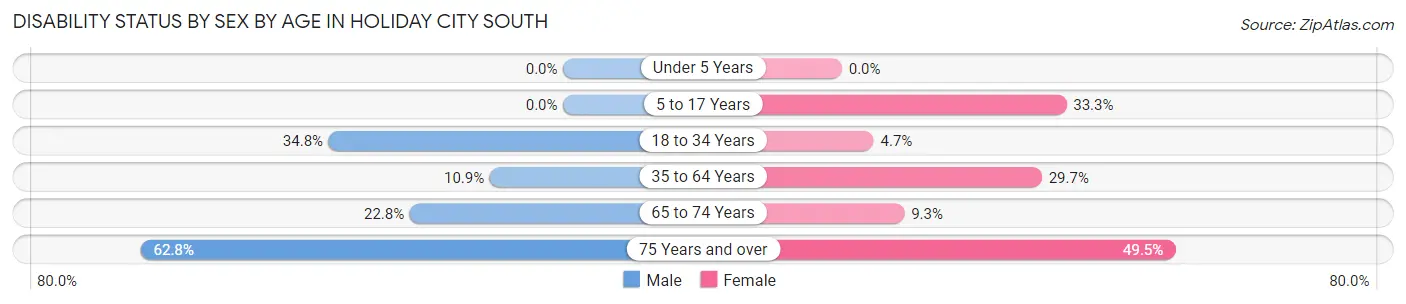
| Age Bracket | Male | Female |
| Under 5 Years | 0 (0.0%) | 0 (0.0%) |
| 5 to 17 Years | 0 (0.0%) | 18 (33.3%) |
| 18 to 34 Years | 63 (34.8%) | 5 (4.7%) |
| 35 to 64 Years | 55 (10.9%) | 182 (29.7%) |
| 65 to 74 Years | 112 (22.8%) | 82 (9.3%) |
| 75 Years and over | 381 (62.8%) | 437 (49.5%) |
Disability Class by Sex by Age in Holiday City South
Disability Class: Hearing Difficulty
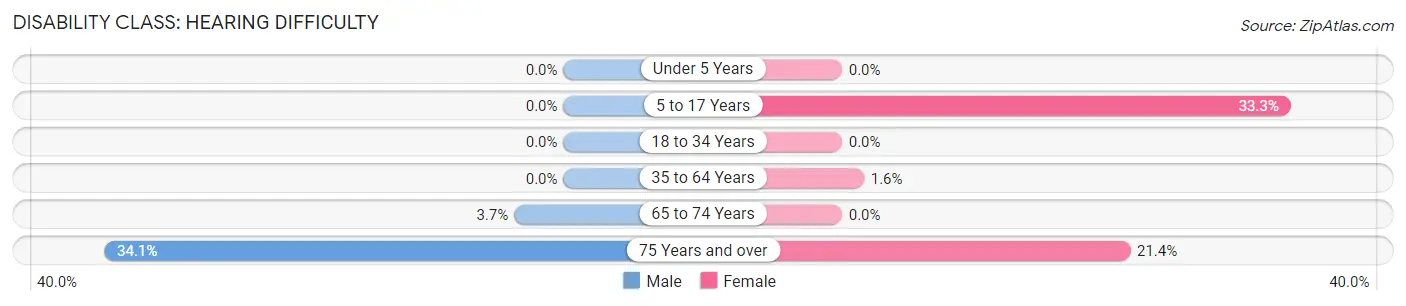
| Age Bracket | Male | Female |
| Under 5 Years | 0 (0.0%) | 0 (0.0%) |
| 5 to 17 Years | 0 (0.0%) | 18 (33.3%) |
| 18 to 34 Years | 0 (0.0%) | 0 (0.0%) |
| 35 to 64 Years | 0 (0.0%) | 10 (1.6%) |
| 65 to 74 Years | 18 (3.7%) | 0 (0.0%) |
| 75 Years and over | 207 (34.1%) | 189 (21.4%) |
Disability Class: Vision Difficulty
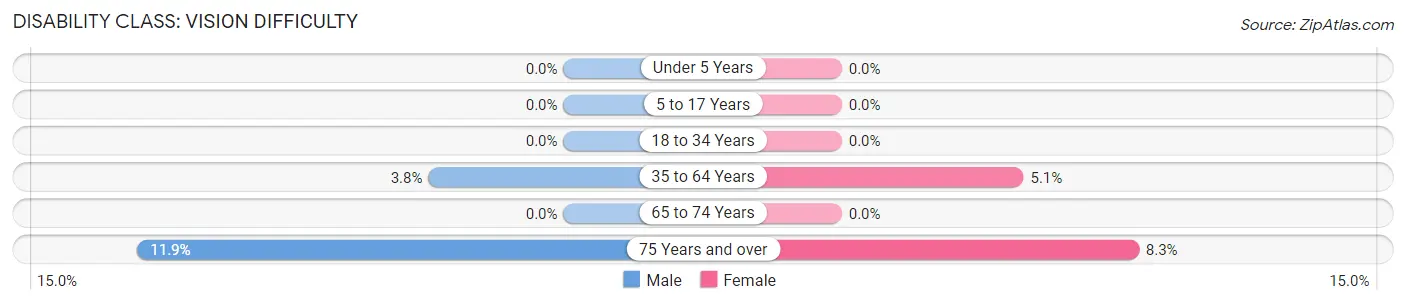
| Age Bracket | Male | Female |
| Under 5 Years | 0 (0.0%) | 0 (0.0%) |
| 5 to 17 Years | 0 (0.0%) | 0 (0.0%) |
| 18 to 34 Years | 0 (0.0%) | 0 (0.0%) |
| 35 to 64 Years | 19 (3.8%) | 31 (5.1%) |
| 65 to 74 Years | 0 (0.0%) | 0 (0.0%) |
| 75 Years and over | 72 (11.9%) | 73 (8.3%) |
Disability Class: Cognitive Difficulty
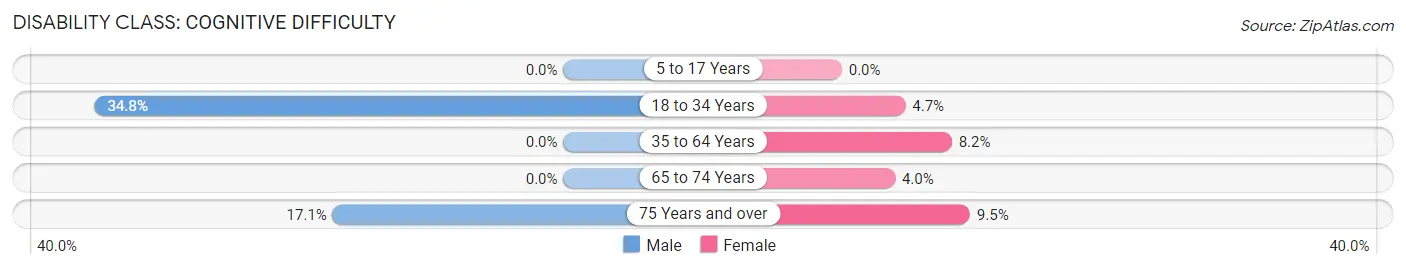
| Age Bracket | Male | Female |
| 5 to 17 Years | 0 (0.0%) | 0 (0.0%) |
| 18 to 34 Years | 63 (34.8%) | 5 (4.7%) |
| 35 to 64 Years | 0 (0.0%) | 50 (8.2%) |
| 65 to 74 Years | 0 (0.0%) | 35 (4.0%) |
| 75 Years and over | 104 (17.1%) | 84 (9.5%) |
Disability Class: Ambulatory Difficulty
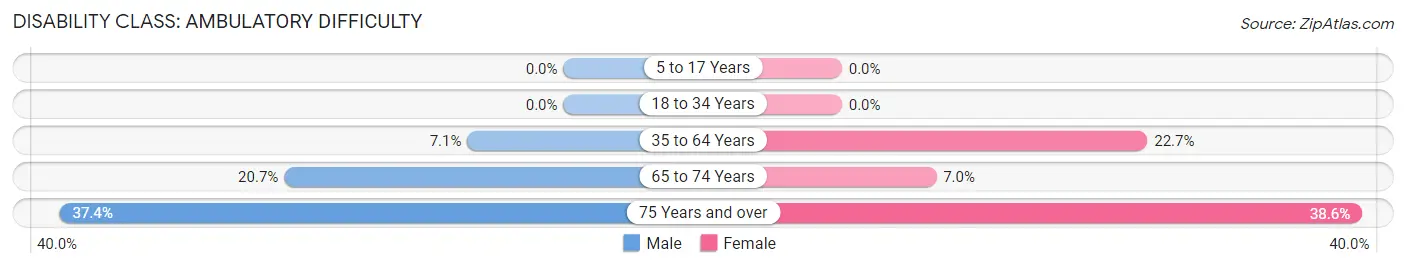
| Age Bracket | Male | Female |
| 5 to 17 Years | 0 (0.0%) | 0 (0.0%) |
| 18 to 34 Years | 0 (0.0%) | 0 (0.0%) |
| 35 to 64 Years | 36 (7.1%) | 139 (22.7%) |
| 65 to 74 Years | 102 (20.7%) | 62 (7.0%) |
| 75 Years and over | 227 (37.4%) | 341 (38.6%) |
Disability Class: Self-Care Difficulty
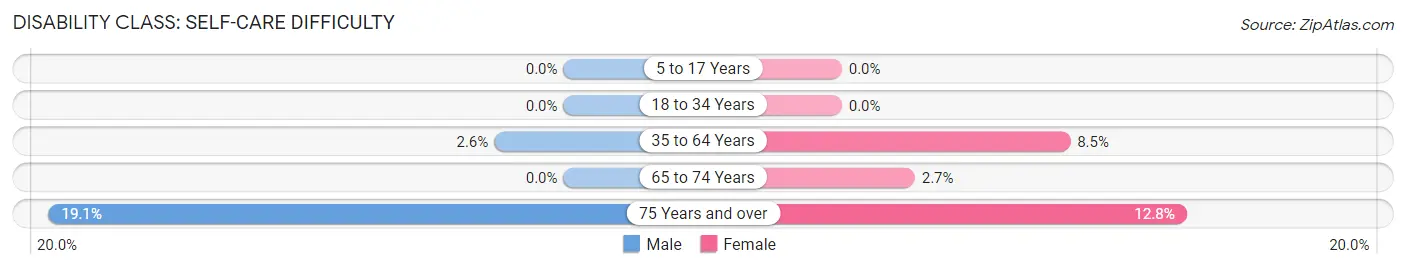
| Age Bracket | Male | Female |
| 5 to 17 Years | 0 (0.0%) | 0 (0.0%) |
| 18 to 34 Years | 0 (0.0%) | 0 (0.0%) |
| 35 to 64 Years | 13 (2.6%) | 52 (8.5%) |
| 65 to 74 Years | 0 (0.0%) | 24 (2.7%) |
| 75 Years and over | 116 (19.1%) | 113 (12.8%) |
Technology Access in Holiday City South
Computing Device Access in Holiday City South
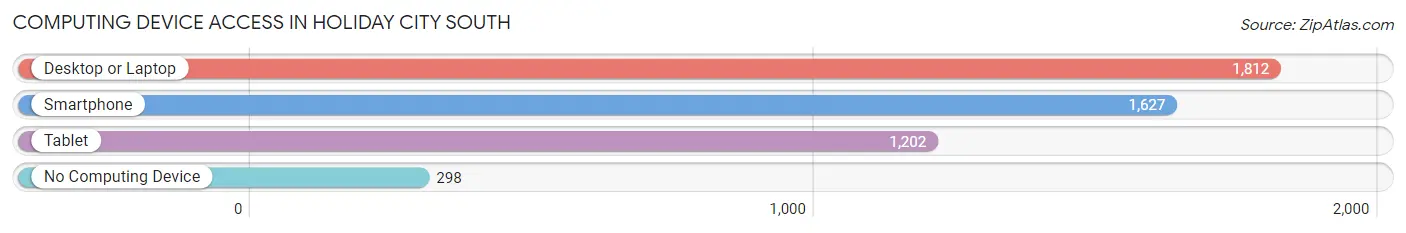
| Device Type | # Households | % Households |
| Desktop or Laptop | 1,812 | 73.4% |
| Smartphone | 1,627 | 65.9% |
| Tablet | 1,202 | 48.7% |
| No Computing Device | 298 | 12.1% |
| Total | 2,468 | 100.0% |
Internet Access in Holiday City South
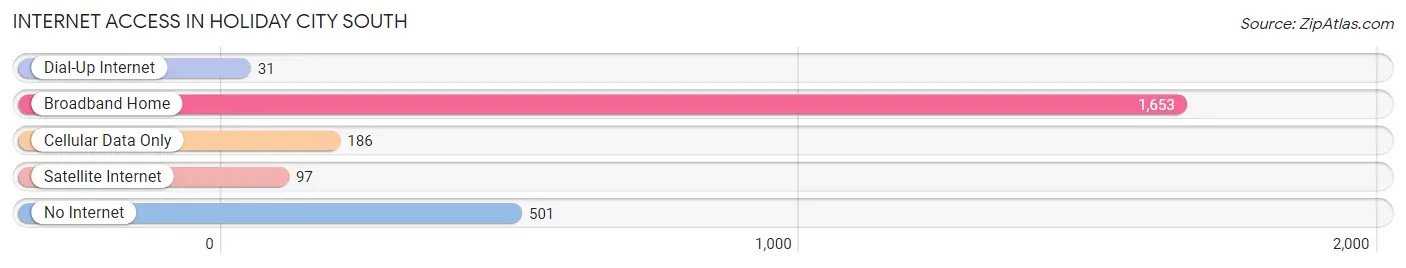
| Internet Type | # Households | % Households |
| Dial-Up Internet | 31 | 1.3% |
| Broadband Home | 1,653 | 67.0% |
| Cellular Data Only | 186 | 7.5% |
| Satellite Internet | 97 | 3.9% |
| No Internet | 501 | 20.3% |
| Total | 2,468 | 100.0% |
Holiday City South Summary
Holiday City South is a census-designated place located in Ocean County, New Jersey. It is part of the Toms River Metropolitan Statistical Area and is located within Berkeley Township. As of the 2010 United States Census, the CDP's population was 8,845.
Geography
Holiday City South is located at 39 56 45 North 74 14 45 West 39 94583 74 24583
According to the United States Census Bureau, the CDP had a total area of 2.873 square miles (7.444 km2), including 2.871 square miles (7.438 km2) of land and 0.002 square miles (0.006 km2) of water (0.06%).
Demographics
As of the 2010 United States Census, there were 8,845 people, 3,845 households, and 2,717 families residing in the CDP. The population density was 3,082.2 per square mile (1,190.2/km2). There were 4,093 housing units at an average density of 1,426.2 per square mile (550.9/km2). The racial makeup of the CDP was 97.45% (8,637) White, 0.45% (40) Black or African American, 0.08% (7) Native American, 0.90% (80) Asian, 0.00% (0) Pacific Islander, 0.30% (27) from other races, and 0.82% (74) from two or more races. Hispanic or Latino of any race were 3.45% (306) of the population.
There were 3,845 households out of which 21.3% had children under the age of 18 living with them, 58.2% were married couples living together, 8.2% had a female householder with no husband present, and 30.2% were non-families. 25.2% of all households were made up of individuals, and 15.2% had someone living alone who was 65 years of age or older. The average household size was 2.30 and the average family size was 2.75.
In the CDP, the population was spread out with 17.2% under the age of 18, 6.2% from 18 to 24, 19.2% from 25 to 44, 32.2% from 45 to 64, and 25.2% who were 65 years of age or older. The median age was 49.2 years. For every 100 females, there were 91.2 males. For every 100 females ages 18 and older there were 88.2 males.
The Census Bureau's 2006-2010 American Community Survey showed that (in 2010 inflation-adjusted dollars) median household income was $63,917 (with a margin of error of +/- $3,945) and the median family income was $76,917 (+/- $4,945). Males had a median income of $60,000 (+/- $4,945) versus $41,250 (+/- $3,945) for females. The per capita income for the CDP was $32,917 (+/- $2,945). About 4.2% of families and 5.3% of the population were below the poverty line, including 6.3% of those under age 18 and 4.2% of those age 65 or over.
Economy
Holiday City South is a residential community with no major industries. The majority of the population is employed in the service and retail industries. The median household income is $63,917 and the median family income is $76,917.
The area is served by the Berkeley Township School District, which operates four elementary schools, one middle school, and one high school. The district also operates a special education school.
The area is also served by the Ocean County Library, which operates a branch in the area. The library offers a variety of services, including books, magazines, DVDs, and computer access.
The area is served by the Berkeley Township Police Department, which provides law enforcement services to the area. The department also operates a community policing program, which focuses on crime prevention and community outreach.
Conclusion
Holiday City South is a census-designated place located in Ocean County, New Jersey. It is part of the Toms River Metropolitan Statistical Area and is located within Berkeley Township. As of the 2010 United States Census, the CDP's population was 8,845. The area is primarily residential, with no major industries. The majority of the population is employed in the service and retail industries. The area is served by the Berkeley Township School District, the Ocean County Library, and the Berkeley Township Police Department.
Common Questions
What is Per Capita Income in Holiday City South?
Per Capita income in Holiday City South is $75,527.
What is the Median Family Income in Holiday City South?
Median Family Income in Holiday City South is $66,677.
What is the Median Household income in Holiday City South?
Median Household Income in Holiday City South is $54,875.
What is Income or Wage Gap in Holiday City South?
Income or Wage Gap in Holiday City South is 24.9%.
Women in Holiday City South earn 75.1 cents for every dollar earned by a man.
What is Inequality or Gini Index in Holiday City South?
Inequality or Gini Index in Holiday City South is 0.66.
What is the Total Population of Holiday City South?
Total Population of Holiday City South is 4,412.
What is the Total Male Population of Holiday City South?
Total Male Population of Holiday City South is 1,821.
What is the Total Female Population of Holiday City South?
Total Female Population of Holiday City South is 2,591.
What is the Ratio of Males per 100 Females in Holiday City South?
There are 70.28 Males per 100 Females in Holiday City South.
What is the Ratio of Females per 100 Males in Holiday City South?
There are 142.28 Females per 100 Males in Holiday City South.
What is the Median Population Age in Holiday City South?
Median Population Age in Holiday City South is 69.2 Years.
What is the Average Family Size in Holiday City South
Average Family Size in Holiday City South is 2.3 People.
What is the Average Household Size in Holiday City South
Average Household Size in Holiday City South is 1.8 People.
How Large is the Labor Force in Holiday City South?
There are 1,464 People in the Labor Forcein in Holiday City South.
What is the Percentage of People in the Labor Force in Holiday City South?
34.1% of People are in the Labor Force in Holiday City South.
What is the Unemployment Rate in Holiday City South?
Unemployment Rate in Holiday City South is 2.9%.