Hi Nella borough, NJ Map & Demographics
Hi Nella borough Overview
$35,684
PER CAPITA INCOME
$83,542
AVG FAMILY INCOME
$64,423
AVG HOUSEHOLD INCOME
46.1%
WAGE / INCOME GAP [ % ]
53.9¢/ $1
WAGE / INCOME GAP [ $ ]
0.32
INEQUALITY / GINI INDEX
883
TOTAL POPULATION
447
MALE POPULATION
436
FEMALE POPULATION
102.52
MALES / 100 FEMALES
97.54
FEMALES / 100 MALES
36.2
MEDIAN AGE
2.7
AVG FAMILY SIZE
2.1
AVG HOUSEHOLD SIZE
600
LABOR FORCE [ PEOPLE ]
76.4%
PERCENT IN LABOR FORCE
5.4%
UNEMPLOYMENT RATE
Income in Hi Nella borough
Income Overview in Hi Nella borough
Per Capita Income in Hi Nella borough is $35,684, while median incomes of families and households are $83,542 and $64,423 respectively.
| Characteristic | Number | Measure |
| Per Capita Income | 883 | $35,684 |
| Median Family Income | 237 | $83,542 |
| Mean Family Income | 237 | $90,507 |
| Median Household Income | 424 | $64,423 |
| Mean Household Income | 424 | $74,406 |
| Income Deficit | 237 | $0 |
| Wage / Income Gap (%) | 883 | 46.07% |
| Wage / Income Gap ($) | 883 | 53.93¢ per $1 |
| Gini / Inequality Index | 883 | 0.32 |
Earnings by Sex in Hi Nella borough
Average Earnings in Hi Nella borough are $36,447, $46,111 for men and $24,866 for women, a difference of 46.1%.
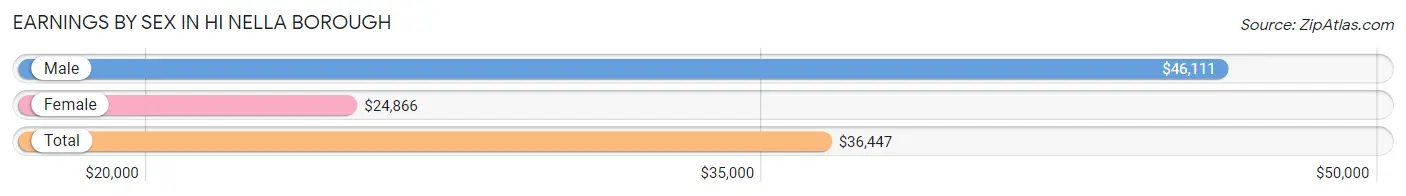
| Sex | Number | Average Earnings |
| Male | 312 (51.0%) | $46,111 |
| Female | 300 (49.0%) | $24,866 |
| Total | 612 (100.0%) | $36,447 |
Earnings by Sex by Income Bracket in Hi Nella borough
The most common earnings brackets in Hi Nella borough are $75,000 to $99,999 for men (70 | 22.4%) and $22,500 to $24,999 for women (56 | 18.7%).
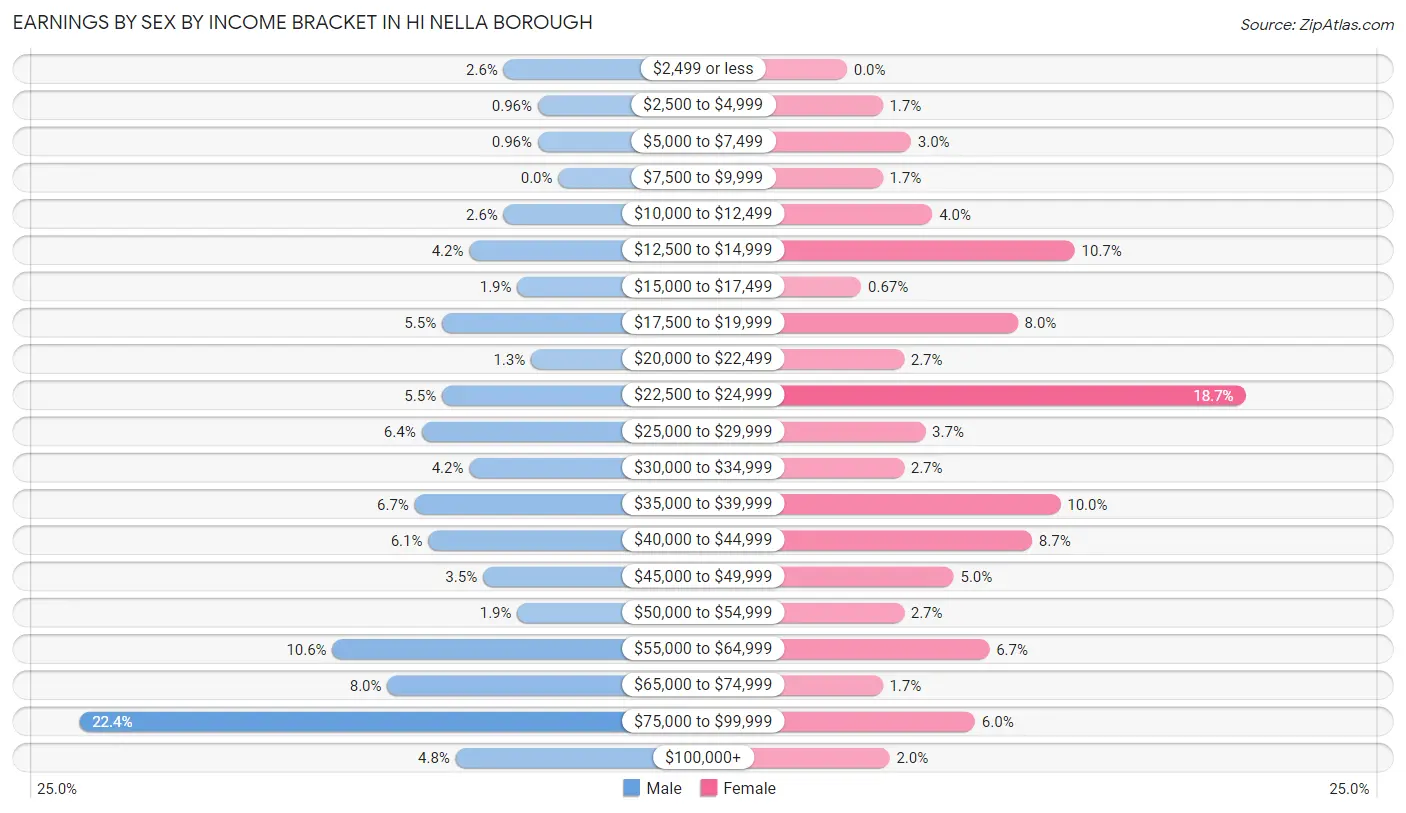
| Income | Male | Female |
| $2,499 or less | 8 (2.6%) | 0 (0.0%) |
| $2,500 to $4,999 | 3 (1.0%) | 5 (1.7%) |
| $5,000 to $7,499 | 3 (1.0%) | 9 (3.0%) |
| $7,500 to $9,999 | 0 (0.0%) | 5 (1.7%) |
| $10,000 to $12,499 | 8 (2.6%) | 12 (4.0%) |
| $12,500 to $14,999 | 13 (4.2%) | 32 (10.7%) |
| $15,000 to $17,499 | 6 (1.9%) | 2 (0.7%) |
| $17,500 to $19,999 | 17 (5.4%) | 24 (8.0%) |
| $20,000 to $22,499 | 4 (1.3%) | 8 (2.7%) |
| $22,500 to $24,999 | 17 (5.4%) | 56 (18.7%) |
| $25,000 to $29,999 | 20 (6.4%) | 11 (3.7%) |
| $30,000 to $34,999 | 13 (4.2%) | 8 (2.7%) |
| $35,000 to $39,999 | 21 (6.7%) | 30 (10.0%) |
| $40,000 to $44,999 | 19 (6.1%) | 26 (8.7%) |
| $45,000 to $49,999 | 11 (3.5%) | 15 (5.0%) |
| $50,000 to $54,999 | 6 (1.9%) | 8 (2.7%) |
| $55,000 to $64,999 | 33 (10.6%) | 20 (6.7%) |
| $65,000 to $74,999 | 25 (8.0%) | 5 (1.7%) |
| $75,000 to $99,999 | 70 (22.4%) | 18 (6.0%) |
| $100,000+ | 15 (4.8%) | 6 (2.0%) |
| Total | 312 (100.0%) | 300 (100.0%) |
Earnings by Sex by Educational Attainment in Hi Nella borough
Average earnings in Hi Nella borough are $63,529 for men and $35,511 for women, a difference of 44.1%. Men with an educational attainment of high school diploma enjoy the highest average annual earnings of $72,500, while those with college or associate's degree education earn the least with $36,042. Women with an educational attainment of bachelor's degree earn the most with the average annual earnings of $37,404, while those with high school diploma education have the smallest earnings of $23,917.
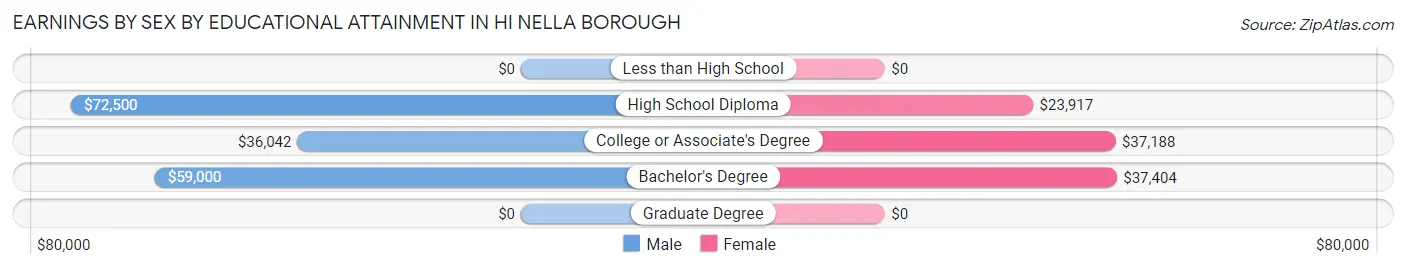
| Educational Attainment | Male Income | Female Income |
| Less than High School | - | - |
| High School Diploma | $72,500 | $23,917 |
| College or Associate's Degree | $36,042 | $37,188 |
| Bachelor's Degree | $59,000 | $37,404 |
| Graduate Degree | - | - |
| Total | $63,529 | $35,511 |
Family Income in Hi Nella borough
Family Income Brackets in Hi Nella borough
According to the Hi Nella borough family income data, there are 64 families falling into the $50,000 to $74,999 income range, which is the most common income bracket and makes up 27.0% of all families.
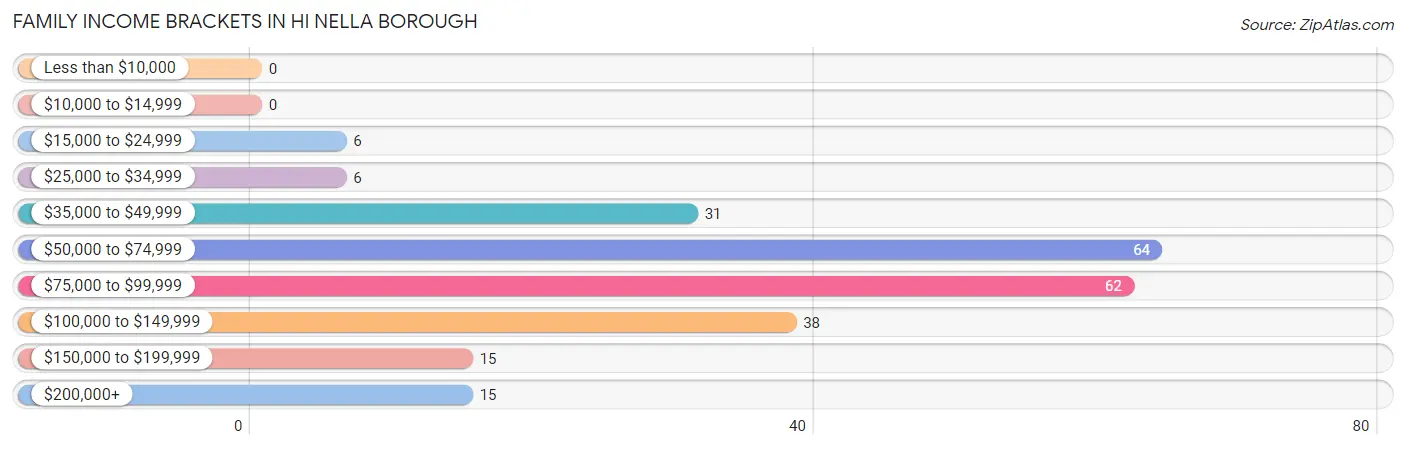
| Income Bracket | # Families | % Families |
| Less than $10,000 | 0 | 0.0% |
| $10,000 to $14,999 | 0 | 0.0% |
| $15,000 to $24,999 | 6 | 2.5% |
| $25,000 to $34,999 | 6 | 2.5% |
| $35,000 to $49,999 | 31 | 13.1% |
| $50,000 to $74,999 | 64 | 27.0% |
| $75,000 to $99,999 | 62 | 26.2% |
| $100,000 to $149,999 | 38 | 16.0% |
| $150,000 to $199,999 | 15 | 6.3% |
| $200,000+ | 15 | 6.3% |
Family Income by Famaliy Size in Hi Nella borough
4-person families (33 | 13.9%) account for the highest median family income in Hi Nella borough with $163,125 per family, while 4-person families (33 | 13.9%) have the highest median income of $40,781 per family member.
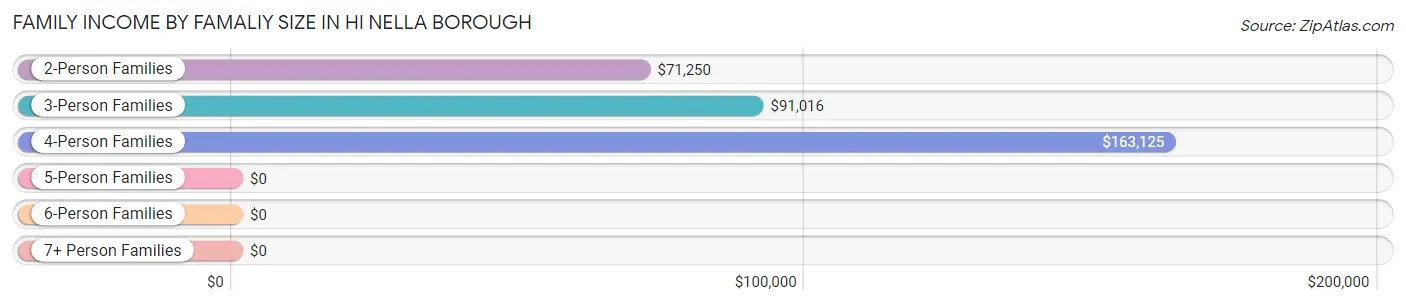
| Income Bracket | # Families | Median Income |
| 2-Person Families | 106 (44.7%) | $71,250 |
| 3-Person Families | 88 (37.1%) | $91,016 |
| 4-Person Families | 33 (13.9%) | $163,125 |
| 5-Person Families | 5 (2.1%) | $0 |
| 6-Person Families | 5 (2.1%) | $0 |
| 7+ Person Families | 0 (0.0%) | $0 |
| Total | 237 (100.0%) | $83,542 |
Family Income by Number of Earners in Hi Nella borough
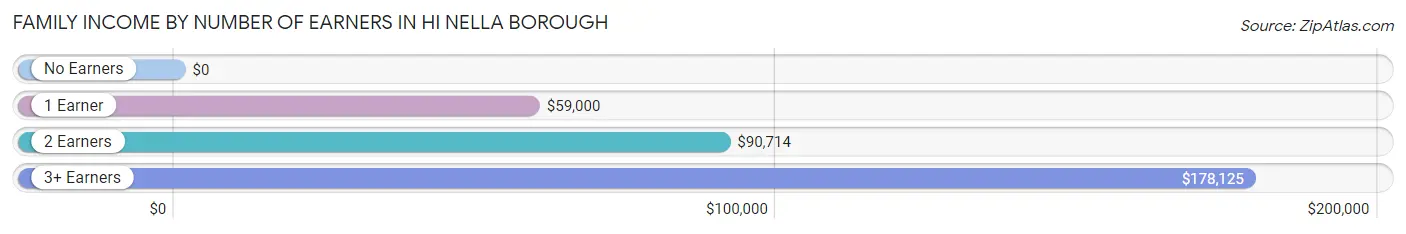
| Number of Earners | # Families | Median Income |
| No Earners | 4 (1.7%) | $0 |
| 1 Earner | 92 (38.8%) | $59,000 |
| 2 Earners | 112 (47.3%) | $90,714 |
| 3+ Earners | 29 (12.2%) | $178,125 |
| Total | 237 (100.0%) | $83,542 |
Household Income in Hi Nella borough
Household Income Brackets in Hi Nella borough
With 101 households falling in the category, the $50,000 to $74,999 income range is the most frequent in Hi Nella borough, accounting for 23.8% of all households. In contrast, only 6 households (1.4%) fall into the less than $10,000 income bracket, making it the least populous group.
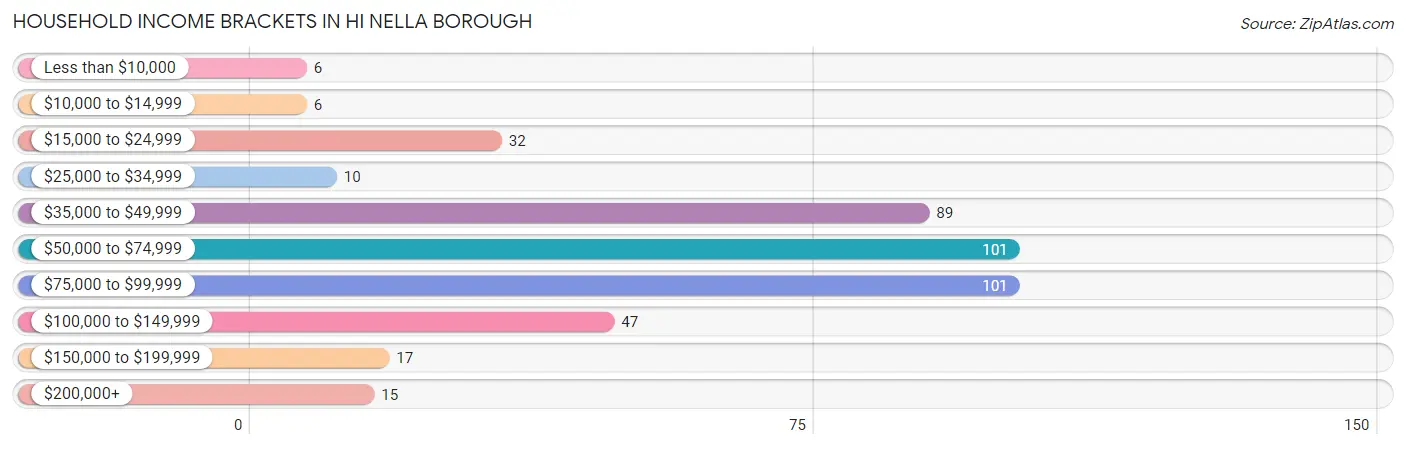
| Income Bracket | # Households | % Households |
| Less than $10,000 | 6 | 1.4% |
| $10,000 to $14,999 | 6 | 1.4% |
| $15,000 to $24,999 | 32 | 7.5% |
| $25,000 to $34,999 | 10 | 2.4% |
| $35,000 to $49,999 | 89 | 21.0% |
| $50,000 to $74,999 | 101 | 23.8% |
| $75,000 to $99,999 | 101 | 23.8% |
| $100,000 to $149,999 | 47 | 11.1% |
| $150,000 to $199,999 | 17 | 4.0% |
| $200,000+ | 15 | 3.5% |
Household Income by Householder Age in Hi Nella borough
The median household income in Hi Nella borough is $64,423, with the highest median household income of $78,750 found in the 45 to 64 years age bracket for the primary householder. A total of 182 households (42.9%) fall into this category. Meanwhile, the 15 to 24 years age bracket for the primary householder has the lowest median household income of $49,650, with 43 households (10.1%) in this group.
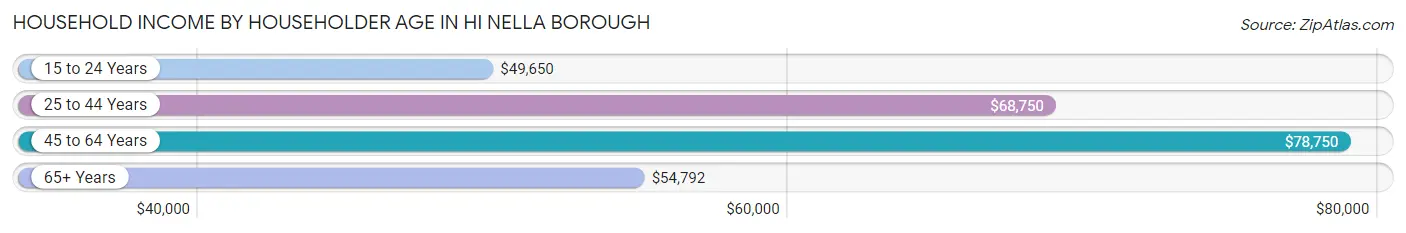
| Income Bracket | # Households | Median Income |
| 15 to 24 Years | 43 (10.1%) | $49,650 |
| 25 to 44 Years | 146 (34.4%) | $68,750 |
| 45 to 64 Years | 182 (42.9%) | $78,750 |
| 65+ Years | 53 (12.5%) | $54,792 |
| Total | 424 (100.0%) | $64,423 |
Poverty in Hi Nella borough
Income Below Poverty by Sex and Age in Hi Nella borough
With 2.5% poverty level for males and 5.5% for females among the residents of Hi Nella borough, 12 to 14 year old males and 35 to 44 year old females are the most vulnerable to poverty, with 2 males (28.6%) and 9 females (16.4%) in their respective age groups living below the poverty level.
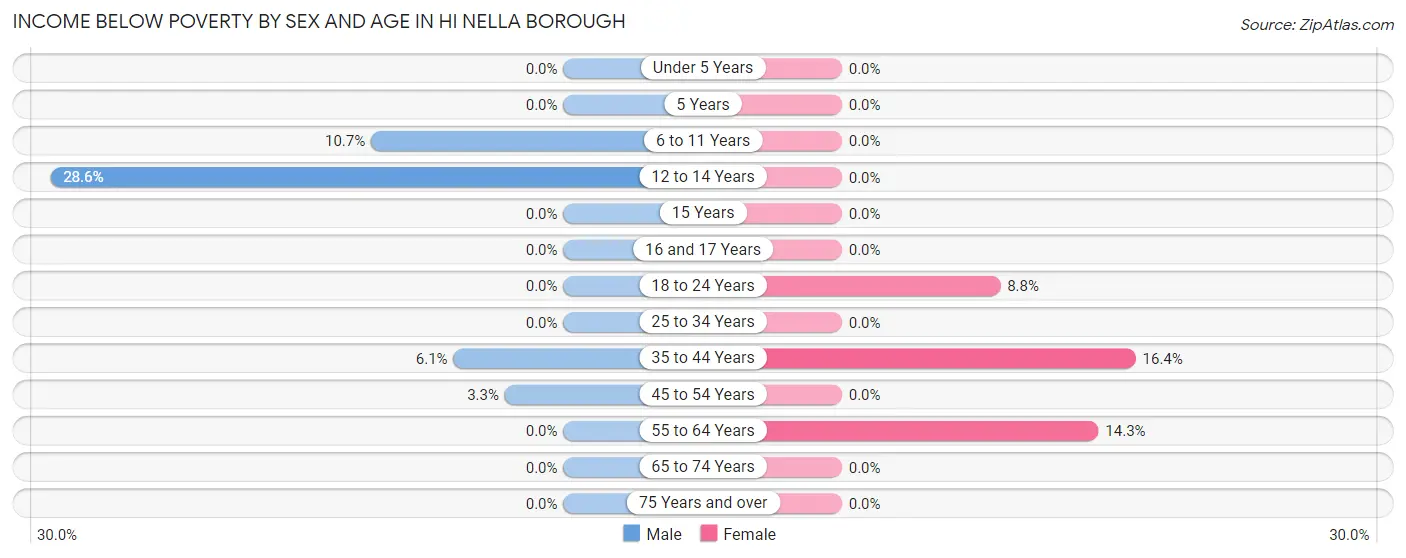
| Age Bracket | Male | Female |
| Under 5 Years | 0 (0.0%) | 0 (0.0%) |
| 5 Years | 0 (0.0%) | 0 (0.0%) |
| 6 to 11 Years | 3 (10.7%) | 0 (0.0%) |
| 12 to 14 Years | 2 (28.6%) | 0 (0.0%) |
| 15 Years | 0 (0.0%) | 0 (0.0%) |
| 16 and 17 Years | 0 (0.0%) | 0 (0.0%) |
| 18 to 24 Years | 0 (0.0%) | 6 (8.8%) |
| 25 to 34 Years | 0 (0.0%) | 0 (0.0%) |
| 35 to 44 Years | 3 (6.1%) | 9 (16.4%) |
| 45 to 54 Years | 3 (3.3%) | 0 (0.0%) |
| 55 to 64 Years | 0 (0.0%) | 9 (14.3%) |
| 65 to 74 Years | 0 (0.0%) | 0 (0.0%) |
| 75 Years and over | 0 (0.0%) | 0 (0.0%) |
| Total | 11 (2.5%) | 24 (5.5%) |
Income Above Poverty by Sex and Age in Hi Nella borough
According to the poverty statistics in Hi Nella borough, males aged under 5 years and females aged under 5 years are the age groups that are most secure financially, with 100.0% of males and 100.0% of females in these age groups living above the poverty line.
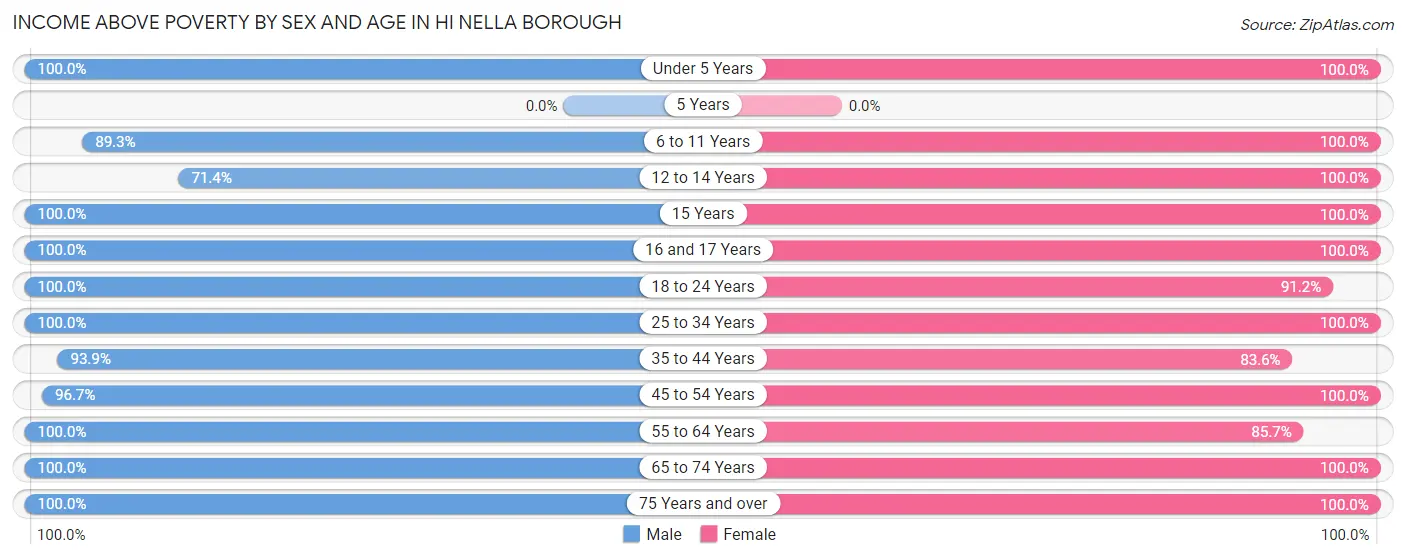
| Age Bracket | Male | Female |
| Under 5 Years | 5 (100.0%) | 8 (100.0%) |
| 5 Years | 0 (0.0%) | 0 (0.0%) |
| 6 to 11 Years | 25 (89.3%) | 28 (100.0%) |
| 12 to 14 Years | 5 (71.4%) | 8 (100.0%) |
| 15 Years | 12 (100.0%) | 2 (100.0%) |
| 16 and 17 Years | 12 (100.0%) | 6 (100.0%) |
| 18 to 24 Years | 78 (100.0%) | 62 (91.2%) |
| 25 to 34 Years | 96 (100.0%) | 72 (100.0%) |
| 35 to 44 Years | 46 (93.9%) | 46 (83.6%) |
| 45 to 54 Years | 89 (96.7%) | 81 (100.0%) |
| 55 to 64 Years | 41 (100.0%) | 54 (85.7%) |
| 65 to 74 Years | 12 (100.0%) | 29 (100.0%) |
| 75 Years and over | 15 (100.0%) | 16 (100.0%) |
| Total | 436 (97.5%) | 412 (94.5%) |
Income Below Poverty Among Married-Couple Families in Hi Nella borough
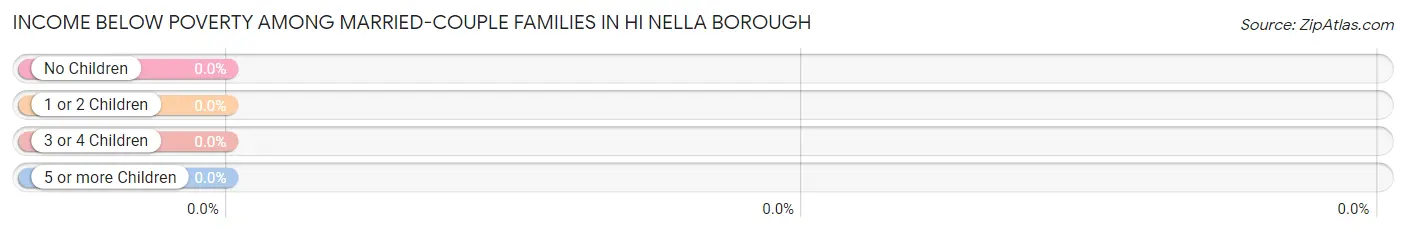
| Children | Above Poverty | Below Poverty |
| No Children | 67 (100.0%) | 0 (0.0%) |
| 1 or 2 Children | 50 (100.0%) | 0 (0.0%) |
| 3 or 4 Children | 0 (0.0%) | 0 (0.0%) |
| 5 or more Children | 0 (0.0%) | 0 (0.0%) |
| Total | 117 (100.0%) | 0 (0.0%) |
Income Below Poverty Among Single-Parent Households in Hi Nella borough
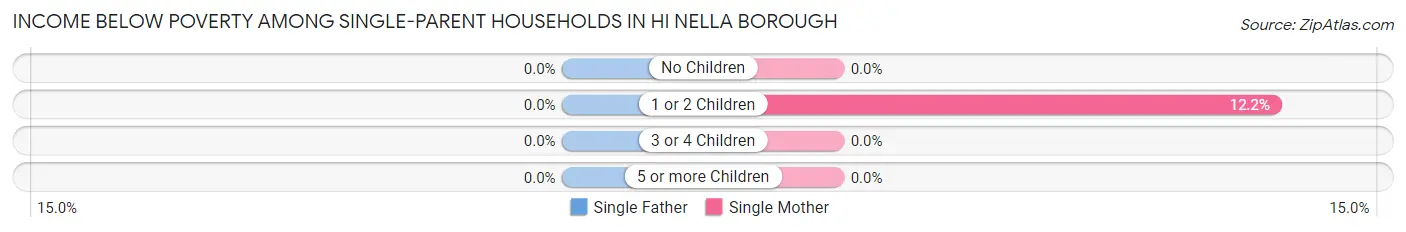
| Children | Single Father | Single Mother |
| No Children | 0 (0.0%) | 0 (0.0%) |
| 1 or 2 Children | 0 (0.0%) | 6 (12.2%) |
| 3 or 4 Children | 0 (0.0%) | 0 (0.0%) |
| 5 or more Children | 0 (0.0%) | 0 (0.0%) |
| Total | 0 (0.0%) | 6 (6.3%) |
Income Below Poverty Among Married-Couple vs Single-Parent Households in Hi Nella borough
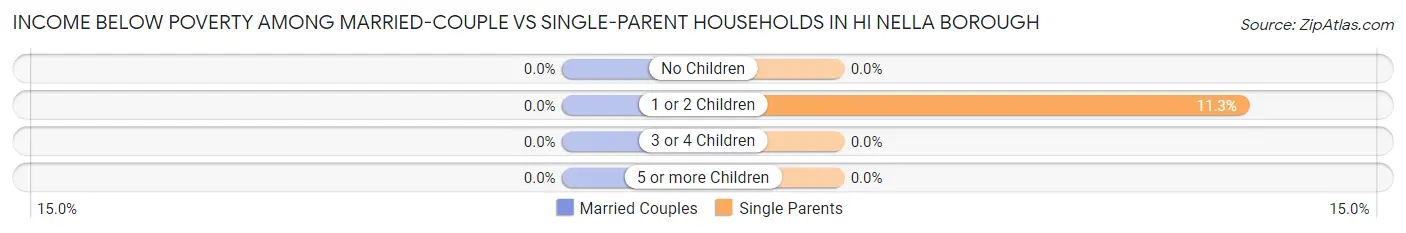
| Children | Married-Couple Families | Single-Parent Households |
| No Children | 0 (0.0%) | 0 (0.0%) |
| 1 or 2 Children | 0 (0.0%) | 6 (11.3%) |
| 3 or 4 Children | 0 (0.0%) | 0 (0.0%) |
| 5 or more Children | 0 (0.0%) | 0 (0.0%) |
| Total | 0 (0.0%) | 6 (5.0%) |
Race in Hi Nella borough
The most populous races in Hi Nella borough are White / Caucasian (462 | 52.3%), Hispanic or Latino (211 | 23.9%), and Two or more Races (148 | 16.8%).
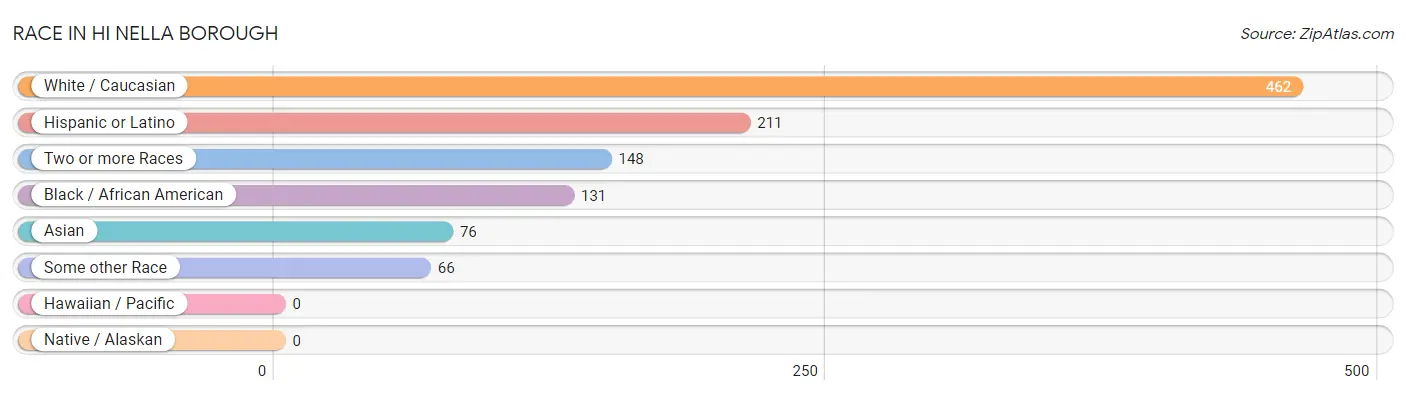
| Race | # Population | % Population |
| Asian | 76 | 8.6% |
| Black / African American | 131 | 14.8% |
| Hawaiian / Pacific | 0 | 0.0% |
| Hispanic or Latino | 211 | 23.9% |
| Native / Alaskan | 0 | 0.0% |
| White / Caucasian | 462 | 52.3% |
| Two or more Races | 148 | 16.8% |
| Some other Race | 66 | 7.5% |
| Total | 883 | 100.0% |
Ancestry in Hi Nella borough
The most populous ancestries reported in Hi Nella borough are Irish (170 | 19.3%), Italian (133 | 15.1%), Puerto Rican (105 | 11.9%), German (94 | 10.6%), and South American (69 | 7.8%), together accounting for 64.7% of all Hi Nella borough residents.
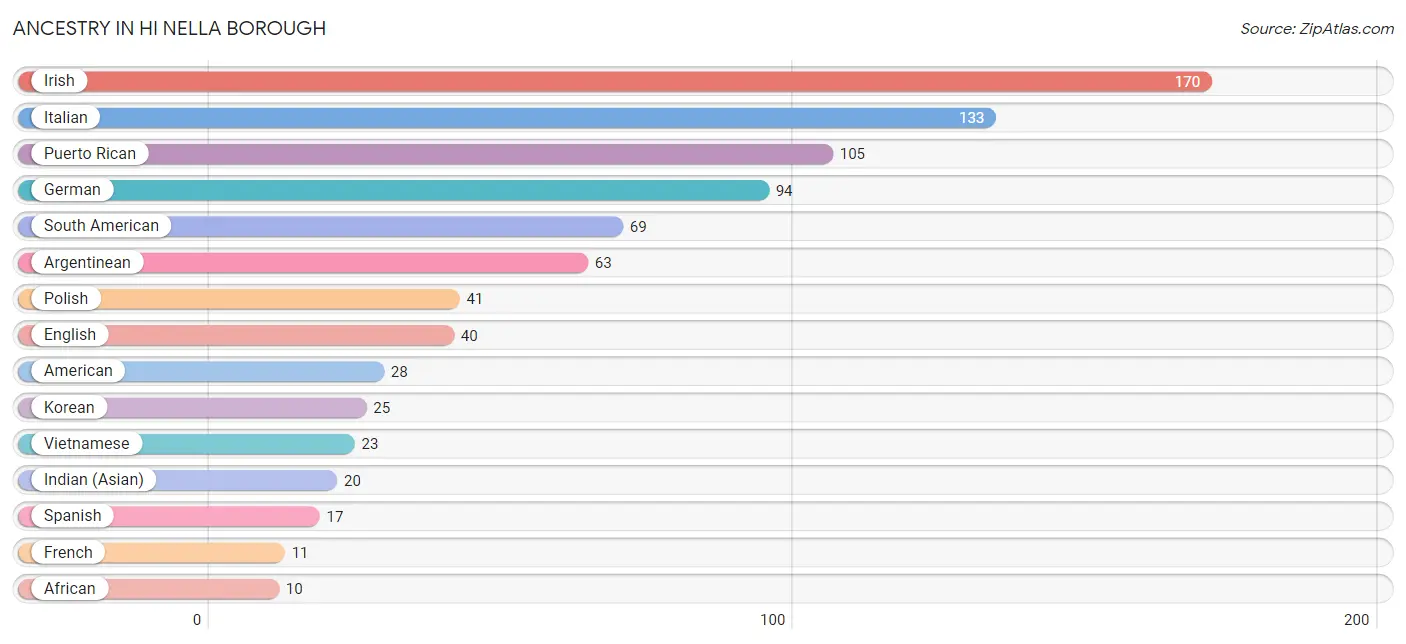
| Ancestry | # Population | % Population |
| African | 10 | 1.1% |
| American | 28 | 3.2% |
| Argentinean | 63 | 7.1% |
| Belgian | 3 | 0.3% |
| Canadian | 1 | 0.1% |
| Central American | 8 | 0.9% |
| Dominican | 3 | 0.3% |
| Dutch | 7 | 0.8% |
| English | 40 | 4.5% |
| European | 2 | 0.2% |
| French | 11 | 1.3% |
| German | 94 | 10.6% |
| Greek | 4 | 0.4% |
| Haitian | 3 | 0.3% |
| Honduran | 2 | 0.2% |
| Hungarian | 8 | 0.9% |
| Indian (Asian) | 20 | 2.3% |
| Iranian | 3 | 0.3% |
| Irish | 170 | 19.3% |
| Italian | 133 | 15.1% |
| Jamaican | 10 | 1.1% |
| Korean | 25 | 2.8% |
| Mexican | 6 | 0.7% |
| Nicaraguan | 3 | 0.3% |
| Norwegian | 6 | 0.7% |
| Pakistani | 6 | 0.7% |
| Peruvian | 6 | 0.7% |
| Polish | 41 | 4.6% |
| Puerto Rican | 105 | 11.9% |
| Romanian | 4 | 0.4% |
| Russian | 7 | 0.8% |
| Salvadoran | 3 | 0.3% |
| Scotch-Irish | 9 | 1.0% |
| Scottish | 2 | 0.2% |
| Seminole | 4 | 0.4% |
| South American | 69 | 7.8% |
| Spaniard | 3 | 0.3% |
| Spanish | 17 | 1.9% |
| Subsaharan African | 10 | 1.1% |
| Swiss | 3 | 0.3% |
| Thai | 2 | 0.2% |
| Ukrainian | 2 | 0.2% |
| Vietnamese | 23 | 2.6% |
| Welsh | 3 | 0.3% | View All 44 Rows |
Immigrants in Hi Nella borough
The most numerous immigrant groups reported in Hi Nella borough came from Latin America (59 | 6.7%), Asia (52 | 5.9%), South America (51 | 5.8%), Argentina (49 | 5.6%), and South Central Asia (28 | 3.2%), together accounting for 27.1% of all Hi Nella borough residents.
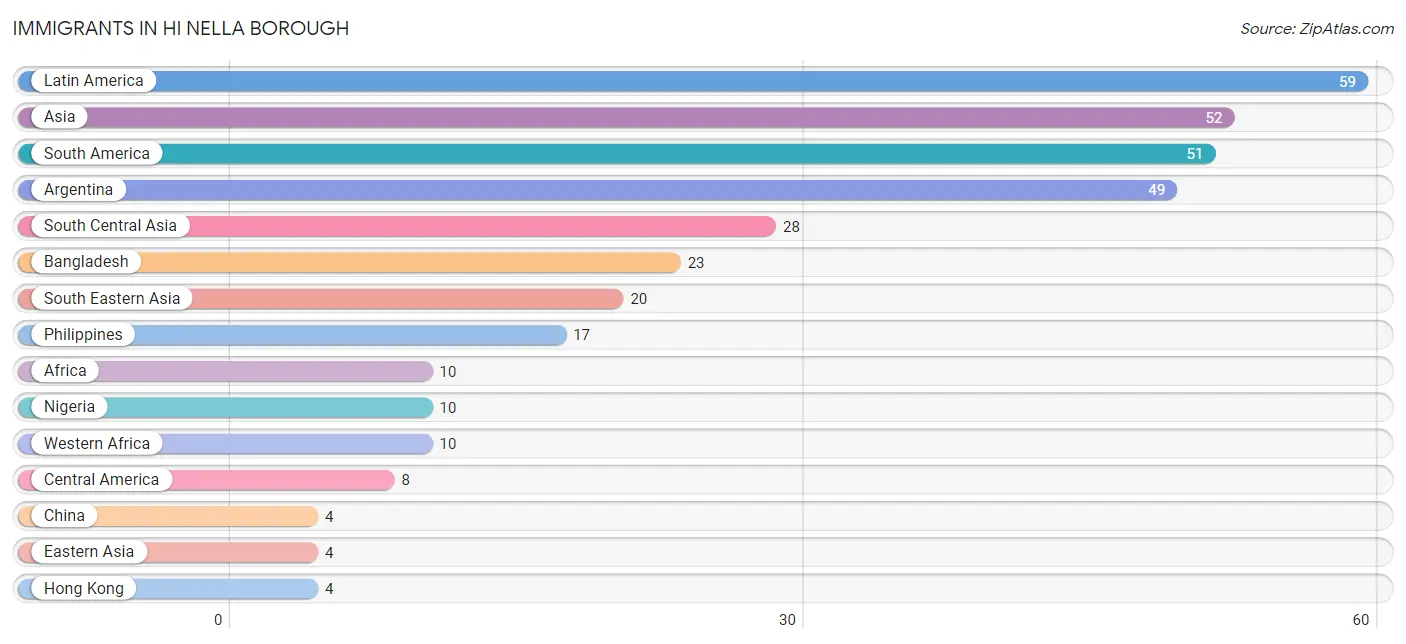
| Immigration Origin | # Population | % Population |
| Africa | 10 | 1.1% |
| Argentina | 49 | 5.6% |
| Asia | 52 | 5.9% |
| Bangladesh | 23 | 2.6% |
| Central America | 8 | 0.9% |
| China | 4 | 0.4% |
| Eastern Asia | 4 | 0.4% |
| El Salvador | 3 | 0.3% |
| Europe | 3 | 0.3% |
| Hong Kong | 4 | 0.4% |
| India | 2 | 0.2% |
| Iran | 3 | 0.3% |
| Ireland | 3 | 0.3% |
| Latin America | 59 | 6.7% |
| Nicaragua | 3 | 0.3% |
| Nigeria | 10 | 1.1% |
| Northern Europe | 3 | 0.3% |
| Peru | 2 | 0.2% |
| Philippines | 17 | 1.9% |
| South America | 51 | 5.8% |
| South Central Asia | 28 | 3.2% |
| South Eastern Asia | 20 | 2.3% |
| Thailand | 3 | 0.3% |
| Western Africa | 10 | 1.1% | View All 24 Rows |
Sex and Age in Hi Nella borough
Sex and Age in Hi Nella borough
The most populous age groups in Hi Nella borough are 20 to 24 Years (73 | 16.3%) for men and 20 to 24 Years (63 | 14.4%) for women.
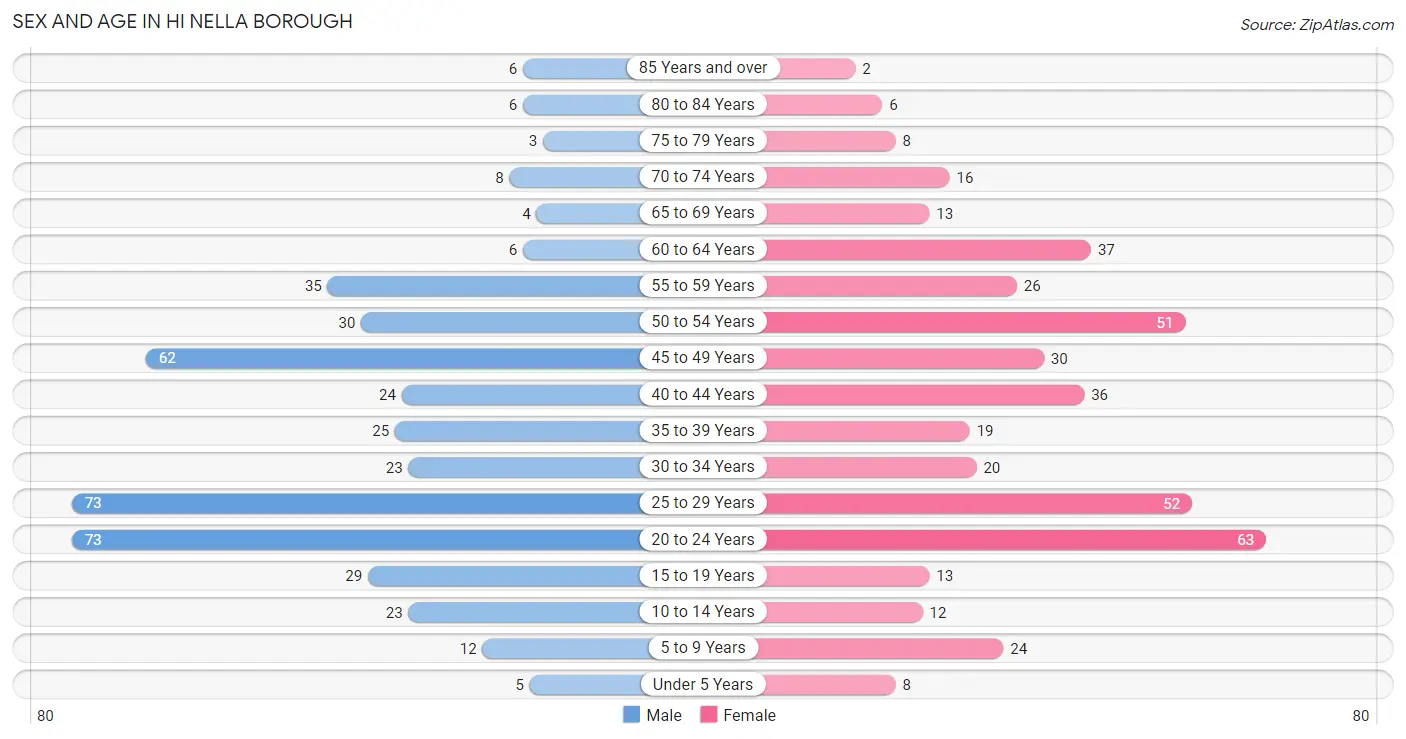
| Age Bracket | Male | Female |
| Under 5 Years | 5 (1.1%) | 8 (1.8%) |
| 5 to 9 Years | 12 (2.7%) | 24 (5.5%) |
| 10 to 14 Years | 23 (5.1%) | 12 (2.8%) |
| 15 to 19 Years | 29 (6.5%) | 13 (3.0%) |
| 20 to 24 Years | 73 (16.3%) | 63 (14.4%) |
| 25 to 29 Years | 73 (16.3%) | 52 (11.9%) |
| 30 to 34 Years | 23 (5.1%) | 20 (4.6%) |
| 35 to 39 Years | 25 (5.6%) | 19 (4.4%) |
| 40 to 44 Years | 24 (5.4%) | 36 (8.3%) |
| 45 to 49 Years | 62 (13.9%) | 30 (6.9%) |
| 50 to 54 Years | 30 (6.7%) | 51 (11.7%) |
| 55 to 59 Years | 35 (7.8%) | 26 (6.0%) |
| 60 to 64 Years | 6 (1.3%) | 37 (8.5%) |
| 65 to 69 Years | 4 (0.9%) | 13 (3.0%) |
| 70 to 74 Years | 8 (1.8%) | 16 (3.7%) |
| 75 to 79 Years | 3 (0.7%) | 8 (1.8%) |
| 80 to 84 Years | 6 (1.3%) | 6 (1.4%) |
| 85 Years and over | 6 (1.3%) | 2 (0.5%) |
| Total | 447 (100.0%) | 436 (100.0%) |
Families and Households in Hi Nella borough
Median Family Size in Hi Nella borough
The median family size in Hi Nella borough is 2.72 persons per family, with single male/father families (25 | 10.5%) accounting for the largest median family size of 3.04 persons per family. On the other hand, married-couple families (117 | 49.4%) represent the smallest median family size with 2.66 persons per family.
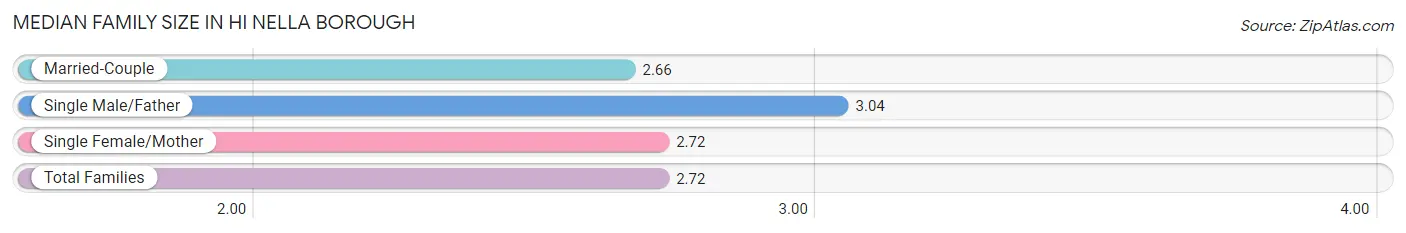
| Family Type | # Families | Family Size |
| Married-Couple | 117 (49.4%) | 2.66 |
| Single Male/Father | 25 (10.5%) | 3.04 |
| Single Female/Mother | 95 (40.1%) | 2.72 |
| Total Families | 237 (100.0%) | 2.72 |
Median Household Size in Hi Nella borough
The median household size in Hi Nella borough is 2.08 persons per household, with single male/father households (25 | 5.9%) accounting for the largest median household size of 3.12 persons per household. non-family households (187 | 44.1%) represent the smallest median household size with 1.24 persons per household.
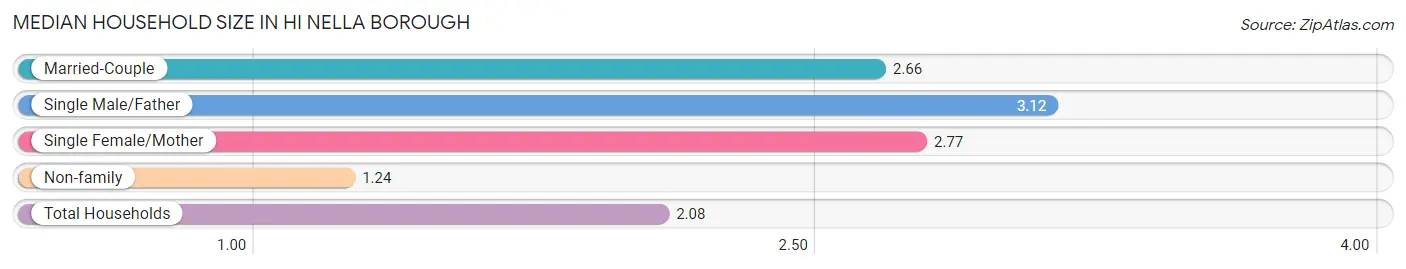
| Household Type | # Households | Household Size |
| Married-Couple | 117 (27.6%) | 2.66 |
| Single Male/Father | 25 (5.9%) | 3.12 |
| Single Female/Mother | 95 (22.4%) | 2.77 |
| Non-family | 187 (44.1%) | 1.24 |
| Total Households | 424 (100.0%) | 2.08 |
Household Size by Marriage Status in Hi Nella borough
Out of a total of 424 households in Hi Nella borough, 237 (55.9%) are family households, while 187 (44.1%) are nonfamily households. The most numerous type of family households are 2-person households, comprising 102, and the most common type of nonfamily households are 1-person households, comprising 128.
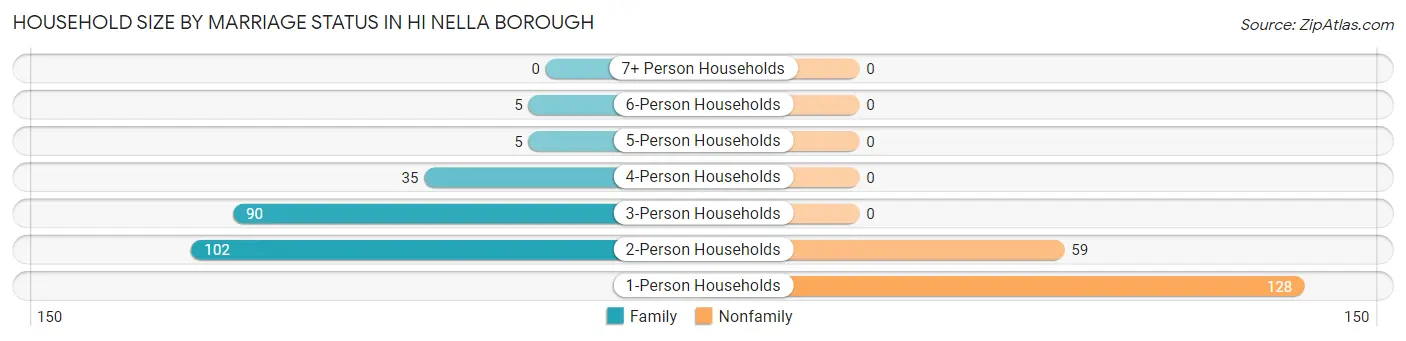
| Household Size | Family Households | Nonfamily Households |
| 1-Person Households | - | 128 (30.2%) |
| 2-Person Households | 102 (24.1%) | 59 (13.9%) |
| 3-Person Households | 90 (21.2%) | 0 (0.0%) |
| 4-Person Households | 35 (8.3%) | 0 (0.0%) |
| 5-Person Households | 5 (1.2%) | 0 (0.0%) |
| 6-Person Households | 5 (1.2%) | 0 (0.0%) |
| 7+ Person Households | 0 (0.0%) | 0 (0.0%) |
| Total | 237 (55.9%) | 187 (44.1%) |
Female Fertility in Hi Nella borough
Fertility by Age in Hi Nella borough
Average fertility rate in Hi Nella borough is 12.0 births per 1,000 women. Women in the age bracket of 20 to 34 years have the highest fertility rate with 22.0 births per 1,000 women. Women in the age bracket of 20 to 34 years acount for 100.0% of all women with births.
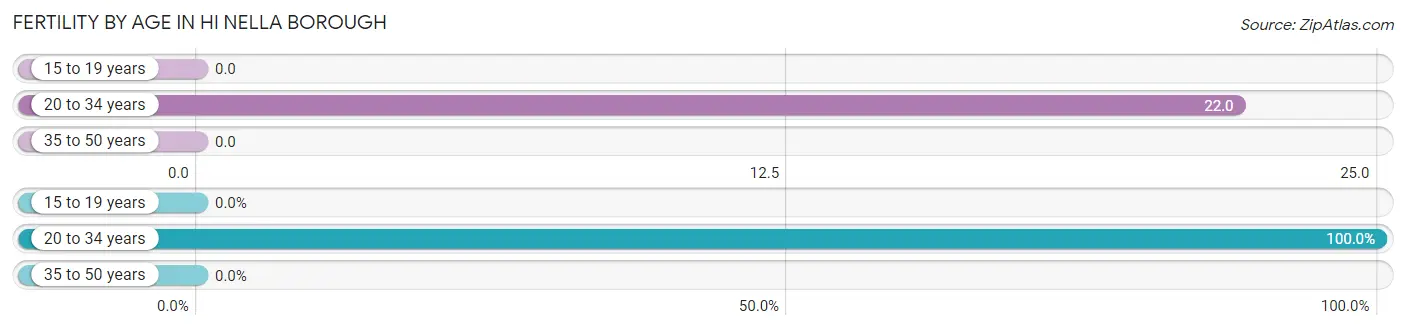
| Age Bracket | Women with Births | Births / 1,000 Women |
| 15 to 19 years | 0 (0.0%) | 0.0 |
| 20 to 34 years | 3 (100.0%) | 22.0 |
| 35 to 50 years | 0 (0.0%) | 0.0 |
| Total | 3 (100.0%) | 12.0 |
Fertility by Age by Marriage Status in Hi Nella borough
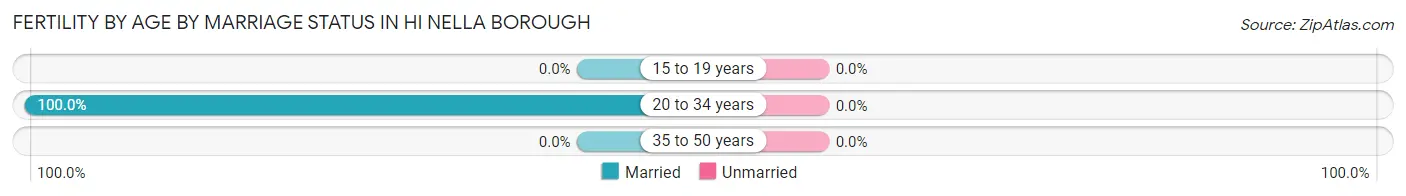
| Age Bracket | Married | Unmarried |
| 15 to 19 years | 0 (0.0%) | 0 (0.0%) |
| 20 to 34 years | 3 (100.0%) | 0 (0.0%) |
| 35 to 50 years | 0 (0.0%) | 0 (0.0%) |
| Total | 3 (100.0%) | 0 (0.0%) |
Fertility by Education in Hi Nella borough
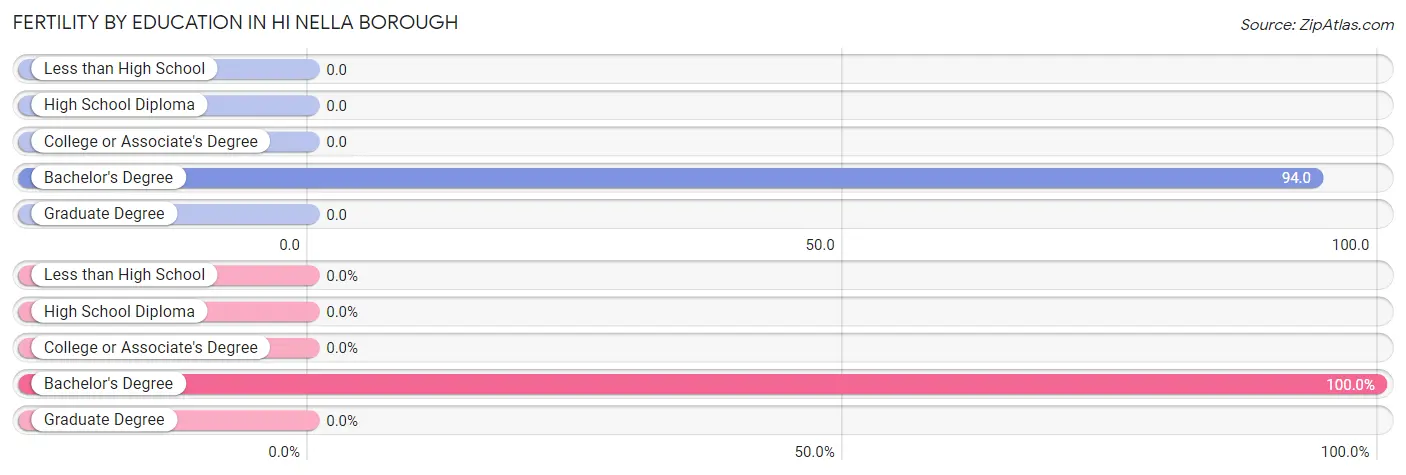
| Educational Attainment | Women with Births | Births / 1,000 Women |
| Less than High School | 0 (0.0%) | 0.0 |
| High School Diploma | 0 (0.0%) | 0.0 |
| College or Associate's Degree | 0 (0.0%) | 0.0 |
| Bachelor's Degree | 3 (100.0%) | 94.0 |
| Graduate Degree | 0 (0.0%) | 0.0 |
| Total | 3 (100.0%) | 12.0 |
Fertility by Education by Marriage Status in Hi Nella borough
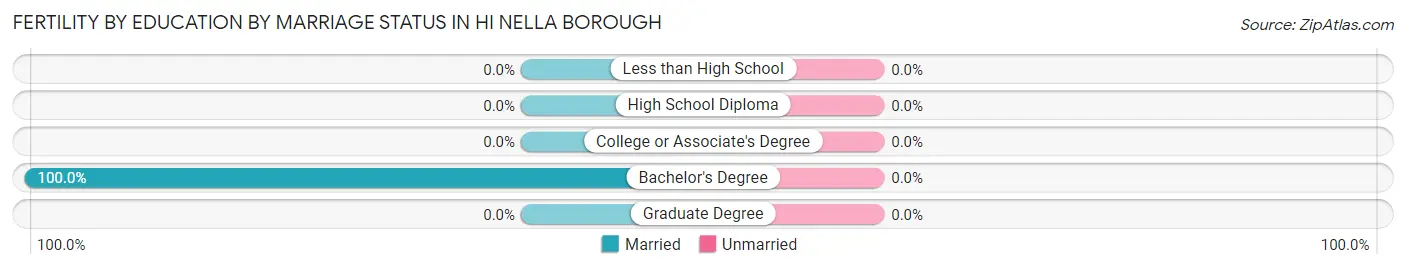
| Educational Attainment | Married | Unmarried |
| Less than High School | 0 (0.0%) | 0 (0.0%) |
| High School Diploma | 0 (0.0%) | 0 (0.0%) |
| College or Associate's Degree | 0 (0.0%) | 0 (0.0%) |
| Bachelor's Degree | 3 (100.0%) | 0 (0.0%) |
| Graduate Degree | 0 (0.0%) | 0 (0.0%) |
| Total | 3 (100.0%) | 0 (0.0%) |
Employment Characteristics in Hi Nella borough
Employment by Class of Employer in Hi Nella borough
Among the 562 employed individuals in Hi Nella borough, private company employees (442 | 78.6%), not-for-profit organizations (39 | 6.9%), and local government employees (28 | 5.0%) make up the most common classes of employment.
| Employer Class | # Employees | % Employees |
| Private Company Employees | 442 | 78.6% |
| Self-Employed (Incorporated) | 7 | 1.3% |
| Self-Employed (Not Incorporated) | 19 | 3.4% |
| Not-for-profit Organizations | 39 | 6.9% |
| Local Government Employees | 28 | 5.0% |
| State Government Employees | 18 | 3.2% |
| Federal Government Employees | 9 | 1.6% |
| Unpaid Family Workers | 0 | 0.0% |
| Total | 562 | 100.0% |
Employment Status by Age in Hi Nella borough
According to the labor force statistics for Hi Nella borough, out of the total population over 16 years of age (785), 76.4% or 600 individuals are in the labor force, with 5.4% or 32 of them unemployed. The age group with the highest labor force participation rate is 25 to 29 years, with 95.2% or 119 individuals in the labor force. Within the labor force, the 60 to 64 years age range has the highest percentage of unemployed individuals, with 17.6% or 3 of them being unemployed.
| Age Bracket | In Labor Force | Unemployed |
| 16 to 19 Years | 8 (28.6%) | 0 (0.0%) |
| 20 to 24 Years | 115 (84.6%) | 6 (5.2%) |
| 25 to 29 Years | 119 (95.2%) | 12 (10.3%) |
| 30 to 34 Years | 36 (83.7%) | 0 (0.0%) |
| 35 to 44 Years | 87 (83.7%) | 2 (2.3%) |
| 45 to 54 Years | 148 (85.5%) | 6 (4.1%) |
| 55 to 59 Years | 44 (72.1%) | 3 (6.8%) |
| 60 to 64 Years | 17 (39.5%) | 3 (17.6%) |
| 65 to 74 Years | 24 (58.5%) | 0 (0.0%) |
| 75 Years and over | 2 (6.5%) | 0 (0.0%) |
| Total | 600 (76.4%) | 32 (5.4%) |
Employment Status by Educational Attainment in Hi Nella borough
According to labor force statistics for Hi Nella borough, 82.1% of individuals (451) out of the total population between 25 and 64 years of age (549) are in the labor force, with 5.8% or 26 of them being unemployed. The group with the highest labor force participation rate are those with the educational attainment of college / associate degree, with 89.8% or 141 individuals in the labor force. Within the labor force, individuals with less than high school education have the highest percentage of unemployment, with 23.1% or 3 of them being unemployed.
| Educational Attainment | In Labor Force | Unemployed |
| Less than High School | 13 (59.1%) | 5 (23.1%) |
| High School Diploma | 198 (79.5%) | 6 (2.5%) |
| College / Associate Degree | 141 (89.8%) | 14 (8.7%) |
| Bachelor's Degree or higher | 99 (81.8%) | 7 (6.1%) |
| Total | 451 (82.1%) | 32 (5.8%) |
Employment Occupations by Sex in Hi Nella borough
Management, Business, Science and Arts Occupations
The most common Management, Business, Science and Arts occupations in Hi Nella borough are Community & Social Service (89 | 15.8%), Education Instruction & Library (59 | 10.4%), Management (44 | 7.8%), Business & Financial (23 | 4.1%), and Legal Services & Support (15 | 2.6%).
Management, Business, Science and Arts Occupations by Sex
Within the Management, Business, Science and Arts occupations in Hi Nella borough, the most male-oriented occupations are Computers & Mathematics (100.0%), Computers, Engineering & Science (78.6%), and Arts, Media & Entertainment (66.7%), while the most female-oriented occupations are Legal Services & Support (100.0%), Education Instruction & Library (89.8%), and Community & Social Service (84.3%).
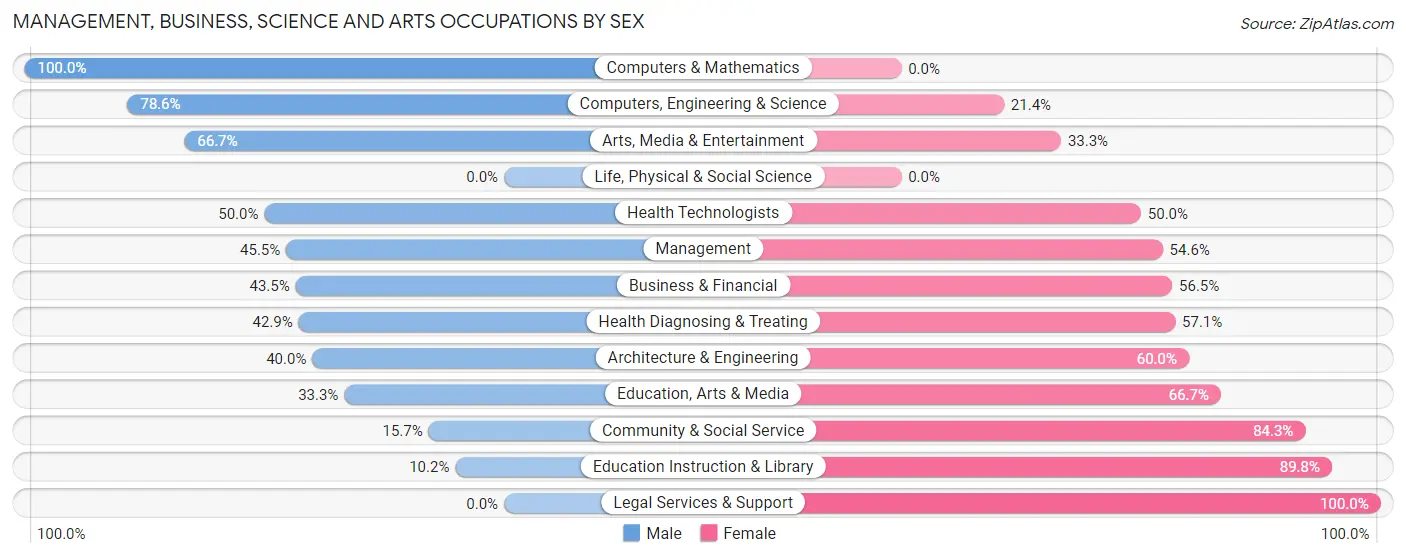
| Occupation | Male | Female |
| Management | 20 (45.5%) | 24 (54.5%) |
| Business & Financial | 10 (43.5%) | 13 (56.5%) |
| Computers, Engineering & Science | 11 (78.6%) | 3 (21.4%) |
| Computers & Mathematics | 9 (100.0%) | 0 (0.0%) |
| Architecture & Engineering | 2 (40.0%) | 3 (60.0%) |
| Life, Physical & Social Science | 0 (0.0%) | 0 (0.0%) |
| Community & Social Service | 14 (15.7%) | 75 (84.3%) |
| Education, Arts & Media | 2 (33.3%) | 4 (66.7%) |
| Legal Services & Support | 0 (0.0%) | 15 (100.0%) |
| Education Instruction & Library | 6 (10.2%) | 53 (89.8%) |
| Arts, Media & Entertainment | 6 (66.7%) | 3 (33.3%) |
| Health Diagnosing & Treating | 6 (42.9%) | 8 (57.1%) |
| Health Technologists | 4 (50.0%) | 4 (50.0%) |
| Total (Category) | 61 (33.2%) | 123 (66.8%) |
| Total (Overall) | 292 (51.7%) | 273 (48.3%) |
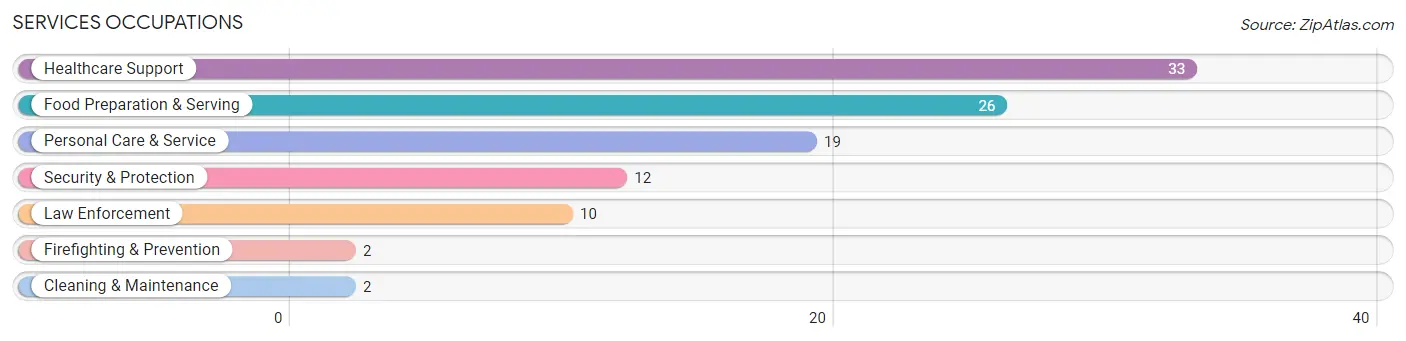
Services Occupations
The most common Services occupations in Hi Nella borough are Healthcare Support (33 | 5.8%), Food Preparation & Serving (26 | 4.6%), Personal Care & Service (19 | 3.4%), Security & Protection (12 | 2.1%), and Law Enforcement (10 | 1.8%).
Services Occupations by Sex
Within the Services occupations in Hi Nella borough, the most male-oriented occupations are Security & Protection (100.0%), Firefighting & Prevention (100.0%), and Law Enforcement (100.0%), while the most female-oriented occupations are Cleaning & Maintenance (100.0%), Personal Care & Service (84.2%), and Healthcare Support (69.7%).
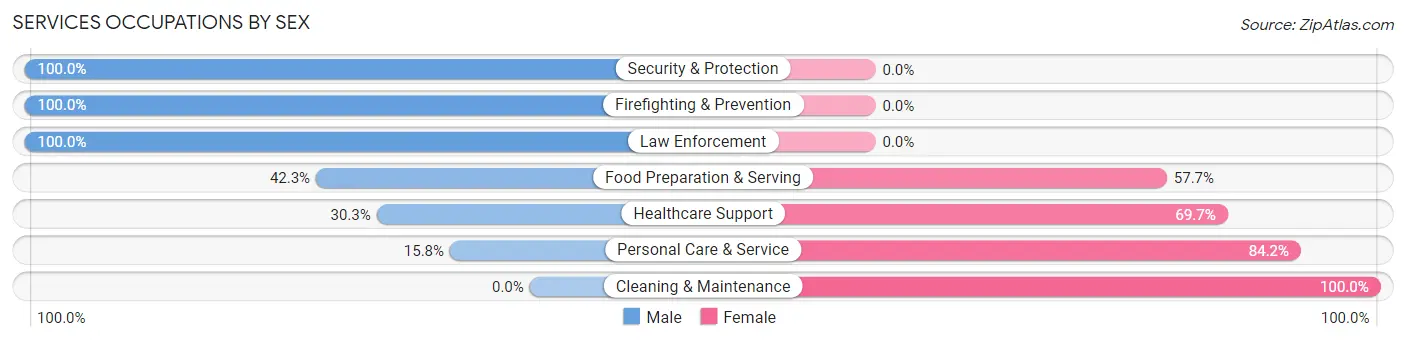
| Occupation | Male | Female |
| Healthcare Support | 10 (30.3%) | 23 (69.7%) |
| Security & Protection | 12 (100.0%) | 0 (0.0%) |
| Firefighting & Prevention | 2 (100.0%) | 0 (0.0%) |
| Law Enforcement | 10 (100.0%) | 0 (0.0%) |
| Food Preparation & Serving | 11 (42.3%) | 15 (57.7%) |
| Cleaning & Maintenance | 0 (0.0%) | 2 (100.0%) |
| Personal Care & Service | 3 (15.8%) | 16 (84.2%) |
| Total (Category) | 36 (39.1%) | 56 (60.9%) |
| Total (Overall) | 292 (51.7%) | 273 (48.3%) |
Sales and Office Occupations
The most common Sales and Office occupations in Hi Nella borough are Office & Administration (81 | 14.3%), and Sales & Related (45 | 8.0%).
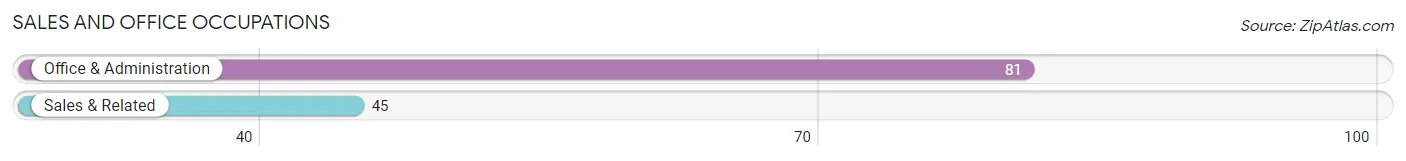
Sales and Office Occupations by Sex
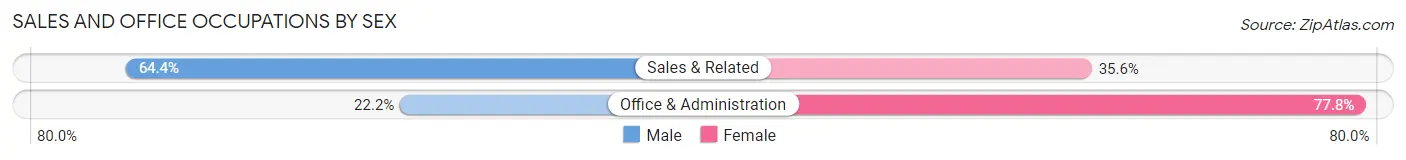
| Occupation | Male | Female |
| Sales & Related | 29 (64.4%) | 16 (35.6%) |
| Office & Administration | 18 (22.2%) | 63 (77.8%) |
| Total (Category) | 47 (37.3%) | 79 (62.7%) |
| Total (Overall) | 292 (51.7%) | 273 (48.3%) |
Natural Resources, Construction and Maintenance Occupations
The most common Natural Resources, Construction and Maintenance occupations in Hi Nella borough are Installation, Maintenance & Repair (44 | 7.8%), and Construction & Extraction (40 | 7.1%).
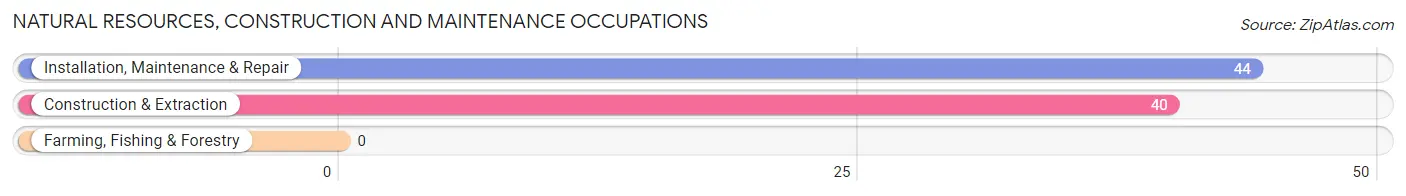
Natural Resources, Construction and Maintenance Occupations by Sex
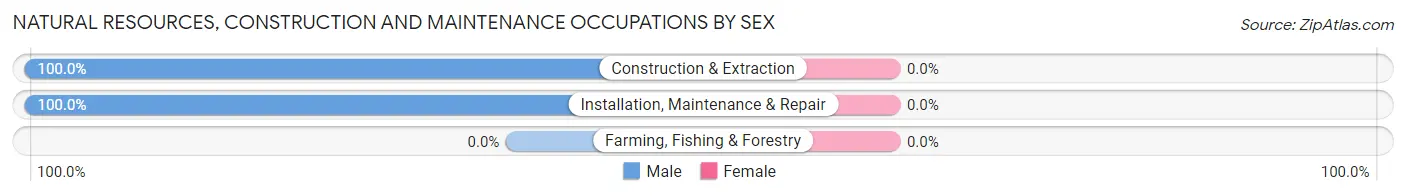
| Occupation | Male | Female |
| Farming, Fishing & Forestry | 0 (0.0%) | 0 (0.0%) |
| Construction & Extraction | 40 (100.0%) | 0 (0.0%) |
| Installation, Maintenance & Repair | 44 (100.0%) | 0 (0.0%) |
| Total (Category) | 84 (100.0%) | 0 (0.0%) |
| Total (Overall) | 292 (51.7%) | 273 (48.3%) |
Production, Transportation and Moving Occupations
The most common Production, Transportation and Moving occupations in Hi Nella borough are Material Moving (40 | 7.1%), Production (26 | 4.6%), and Transportation (13 | 2.3%).
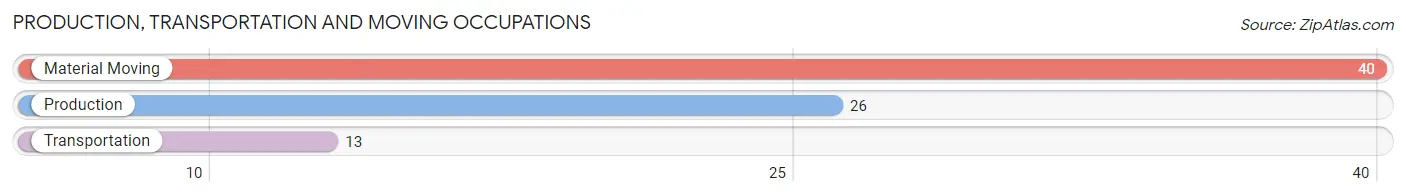
Production, Transportation and Moving Occupations by Sex
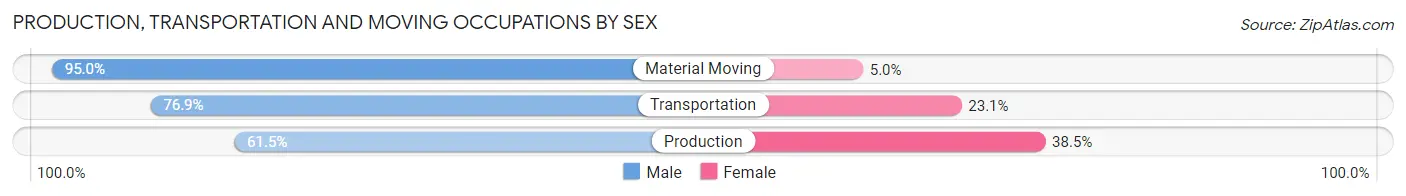
| Occupation | Male | Female |
| Production | 16 (61.5%) | 10 (38.5%) |
| Transportation | 10 (76.9%) | 3 (23.1%) |
| Material Moving | 38 (95.0%) | 2 (5.0%) |
| Total (Category) | 64 (81.0%) | 15 (19.0%) |
| Total (Overall) | 292 (51.7%) | 273 (48.3%) |
Employment Industries by Sex in Hi Nella borough
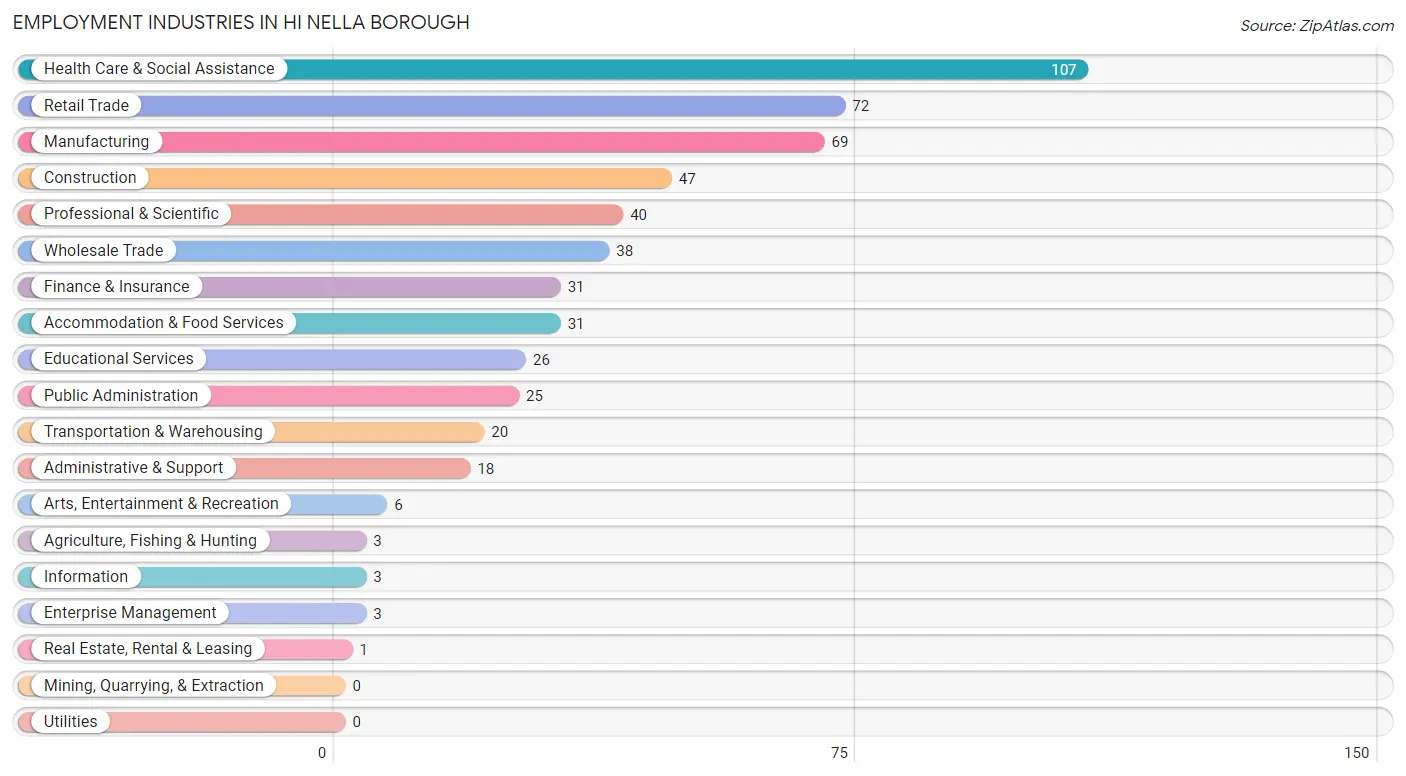
Employment Industries in Hi Nella borough
The major employment industries in Hi Nella borough include Health Care & Social Assistance (107 | 18.9%), Retail Trade (72 | 12.7%), Manufacturing (69 | 12.2%), Construction (47 | 8.3%), and Professional & Scientific (40 | 7.1%).
Employment Industries by Sex in Hi Nella borough
The Hi Nella borough industries that see more men than women are Agriculture, Fishing & Hunting (100.0%), Construction (100.0%), and Information (100.0%), whereas the industries that tend to have a higher number of women are Enterprise Management (100.0%), Health Care & Social Assistance (85.1%), and Administrative & Support (83.3%).
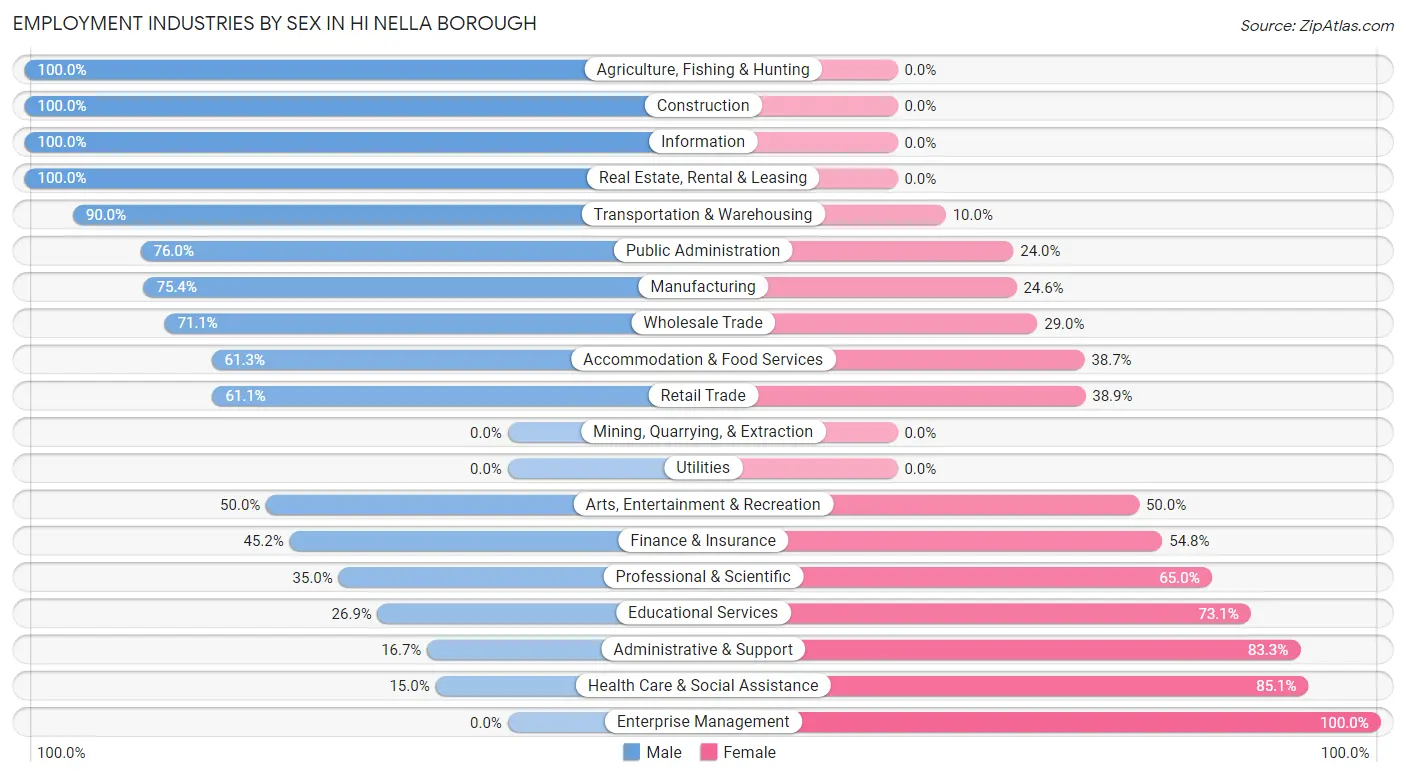
| Industry | Male | Female |
| Agriculture, Fishing & Hunting | 3 (100.0%) | 0 (0.0%) |
| Mining, Quarrying, & Extraction | 0 (0.0%) | 0 (0.0%) |
| Construction | 47 (100.0%) | 0 (0.0%) |
| Manufacturing | 52 (75.4%) | 17 (24.6%) |
| Wholesale Trade | 27 (71.1%) | 11 (28.9%) |
| Retail Trade | 44 (61.1%) | 28 (38.9%) |
| Transportation & Warehousing | 18 (90.0%) | 2 (10.0%) |
| Utilities | 0 (0.0%) | 0 (0.0%) |
| Information | 3 (100.0%) | 0 (0.0%) |
| Finance & Insurance | 14 (45.2%) | 17 (54.8%) |
| Real Estate, Rental & Leasing | 1 (100.0%) | 0 (0.0%) |
| Professional & Scientific | 14 (35.0%) | 26 (65.0%) |
| Enterprise Management | 0 (0.0%) | 3 (100.0%) |
| Administrative & Support | 3 (16.7%) | 15 (83.3%) |
| Educational Services | 7 (26.9%) | 19 (73.1%) |
| Health Care & Social Assistance | 16 (14.9%) | 91 (85.1%) |
| Arts, Entertainment & Recreation | 3 (50.0%) | 3 (50.0%) |
| Accommodation & Food Services | 19 (61.3%) | 12 (38.7%) |
| Public Administration | 19 (76.0%) | 6 (24.0%) |
| Total | 292 (51.7%) | 273 (48.3%) |
Education in Hi Nella borough
School Enrollment in Hi Nella borough
The most common levels of schooling among the 200 students in Hi Nella borough are college / undergraduate (61 | 30.5%), elementary school (43 | 21.5%), and high school (42 | 21.0%).
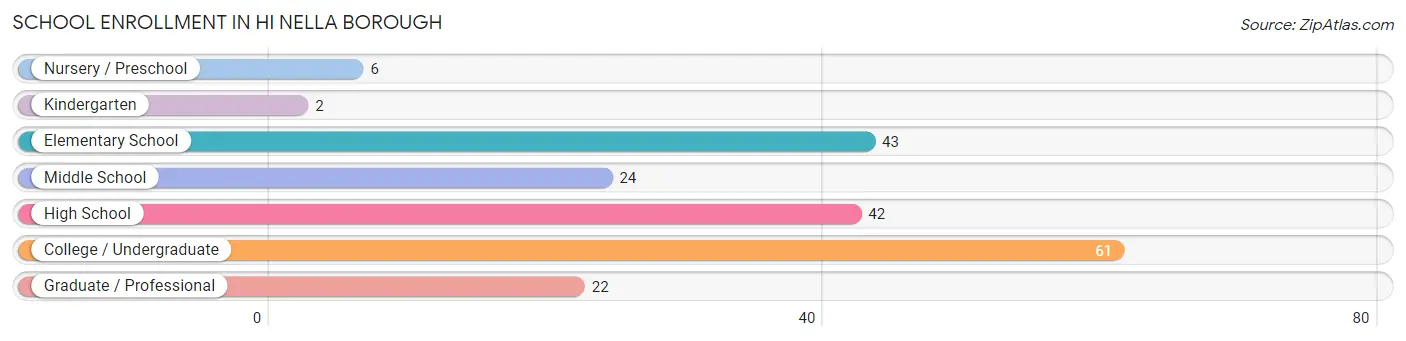
| School Level | # Students | % Students |
| Nursery / Preschool | 6 | 3.0% |
| Kindergarten | 2 | 1.0% |
| Elementary School | 43 | 21.5% |
| Middle School | 24 | 12.0% |
| High School | 42 | 21.0% |
| College / Undergraduate | 61 | 30.5% |
| Graduate / Professional | 22 | 11.0% |
| Total | 200 | 100.0% |
School Enrollment by Age by Funding Source in Hi Nella borough
Out of a total of 200 students who are enrolled in schools in Hi Nella borough, 33 (16.5%) attend a private institution, while the remaining 167 (83.5%) are enrolled in public schools. The age group of 3 to 4 year olds has the highest likelihood of being enrolled in private schools, with 3 (50.0% in the age bracket) enrolled. Conversely, the age group of 15 to 17 year olds has the lowest likelihood of being enrolled in a private school, with 32 (100.0% in the age bracket) attending a public institution.
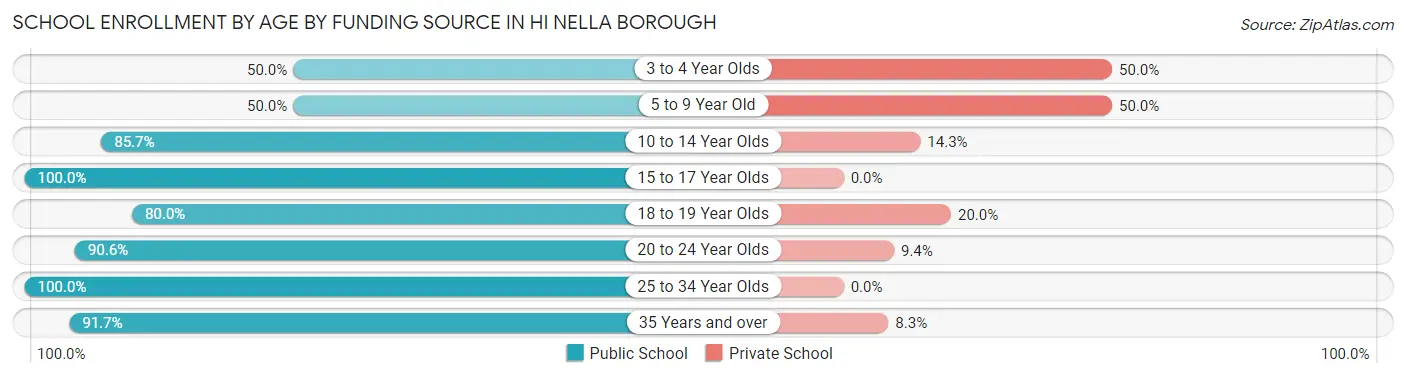
| Age Bracket | Public School | Private School |
| 3 to 4 Year Olds | 3 (50.0%) | 3 (50.0%) |
| 5 to 9 Year Old | 18 (50.0%) | 18 (50.0%) |
| 10 to 14 Year Olds | 30 (85.7%) | 5 (14.3%) |
| 15 to 17 Year Olds | 32 (100.0%) | 0 (0.0%) |
| 18 to 19 Year Olds | 8 (80.0%) | 2 (20.0%) |
| 20 to 24 Year Olds | 29 (90.6%) | 3 (9.4%) |
| 25 to 34 Year Olds | 25 (100.0%) | 0 (0.0%) |
| 35 Years and over | 22 (91.7%) | 2 (8.3%) |
| Total | 167 (83.5%) | 33 (16.5%) |
Educational Attainment by Field of Study in Hi Nella borough
Business (19 | 13.7%), education (18 | 13.0%), communications (17 | 12.2%), arts & humanities (16 | 11.5%), and psychology (13 | 9.3%) are the most common fields of study among 139 individuals in Hi Nella borough who have obtained a bachelor's degree or higher.
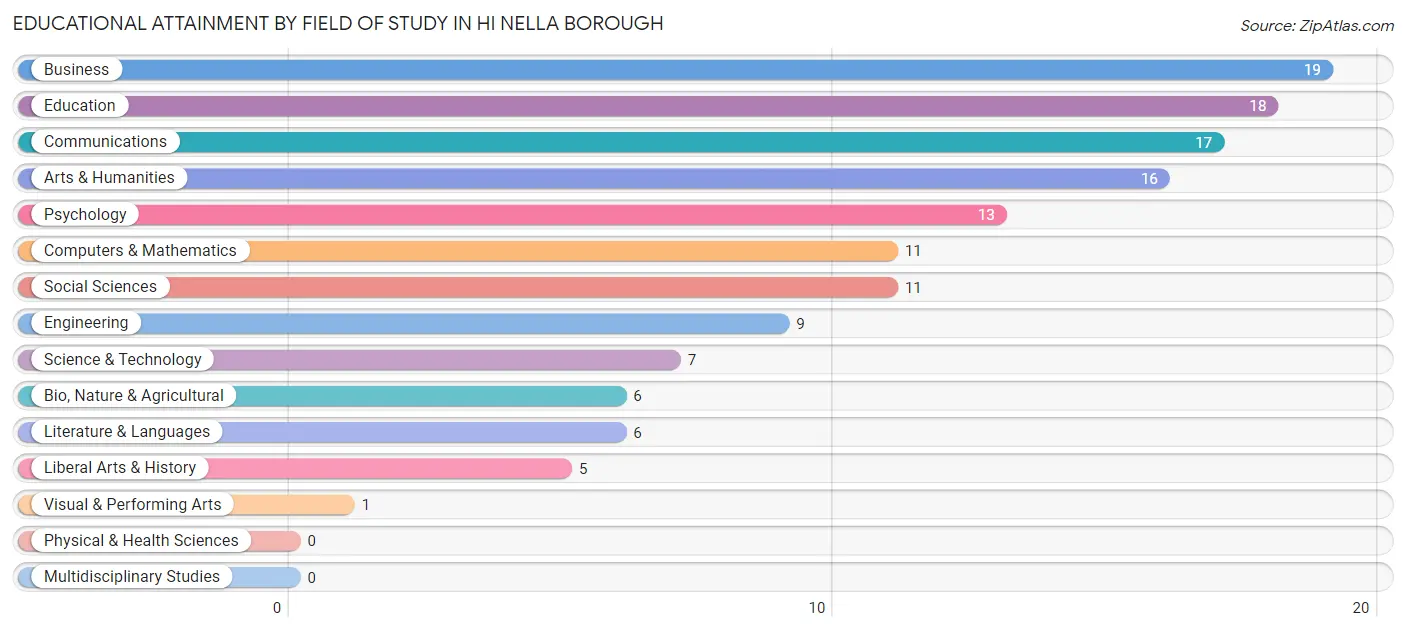
| Field of Study | # Graduates | % Graduates |
| Computers & Mathematics | 11 | 7.9% |
| Bio, Nature & Agricultural | 6 | 4.3% |
| Physical & Health Sciences | 0 | 0.0% |
| Psychology | 13 | 9.3% |
| Social Sciences | 11 | 7.9% |
| Engineering | 9 | 6.5% |
| Multidisciplinary Studies | 0 | 0.0% |
| Science & Technology | 7 | 5.0% |
| Business | 19 | 13.7% |
| Education | 18 | 13.0% |
| Literature & Languages | 6 | 4.3% |
| Liberal Arts & History | 5 | 3.6% |
| Visual & Performing Arts | 1 | 0.7% |
| Communications | 17 | 12.2% |
| Arts & Humanities | 16 | 11.5% |
| Total | 139 | 100.0% |
Transportation & Commute in Hi Nella borough
Vehicle Availability by Sex in Hi Nella borough
The most prevalent vehicle ownership categories in Hi Nella borough are males with 1 vehicle (97, accounting for 33.2%) and females with 1 vehicle (82, making up 35.9%).
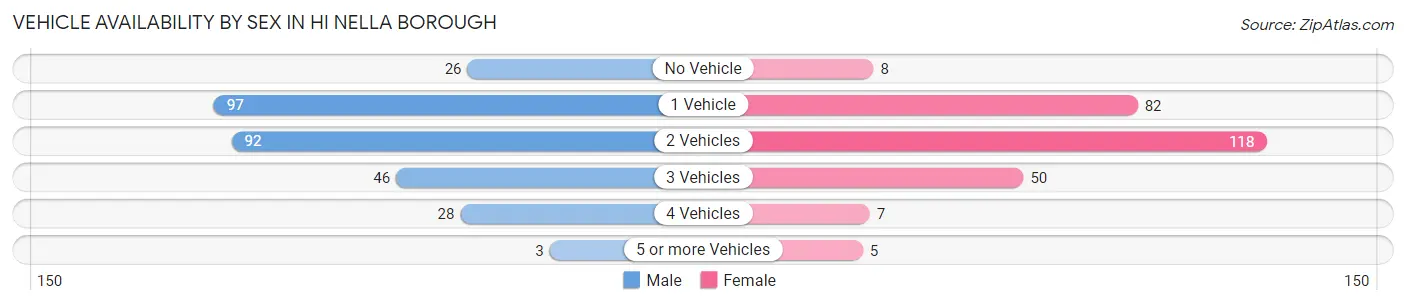
| Vehicles Available | Male | Female |
| No Vehicle | 26 (8.9%) | 8 (3.0%) |
| 1 Vehicle | 97 (33.2%) | 82 (30.4%) |
| 2 Vehicles | 92 (31.5%) | 118 (43.7%) |
| 3 Vehicles | 46 (15.8%) | 50 (18.5%) |
| 4 Vehicles | 28 (9.6%) | 7 (2.6%) |
| 5 or more Vehicles | 3 (1.0%) | 5 (1.8%) |
| Total | 292 (100.0%) | 270 (100.0%) |
Commute Time in Hi Nella borough
The most frequently occuring commute durations in Hi Nella borough are 30 to 34 minutes (141 commuters, 26.5%), 10 to 14 minutes (71 commuters, 13.4%), and 25 to 29 minutes (62 commuters, 11.7%).
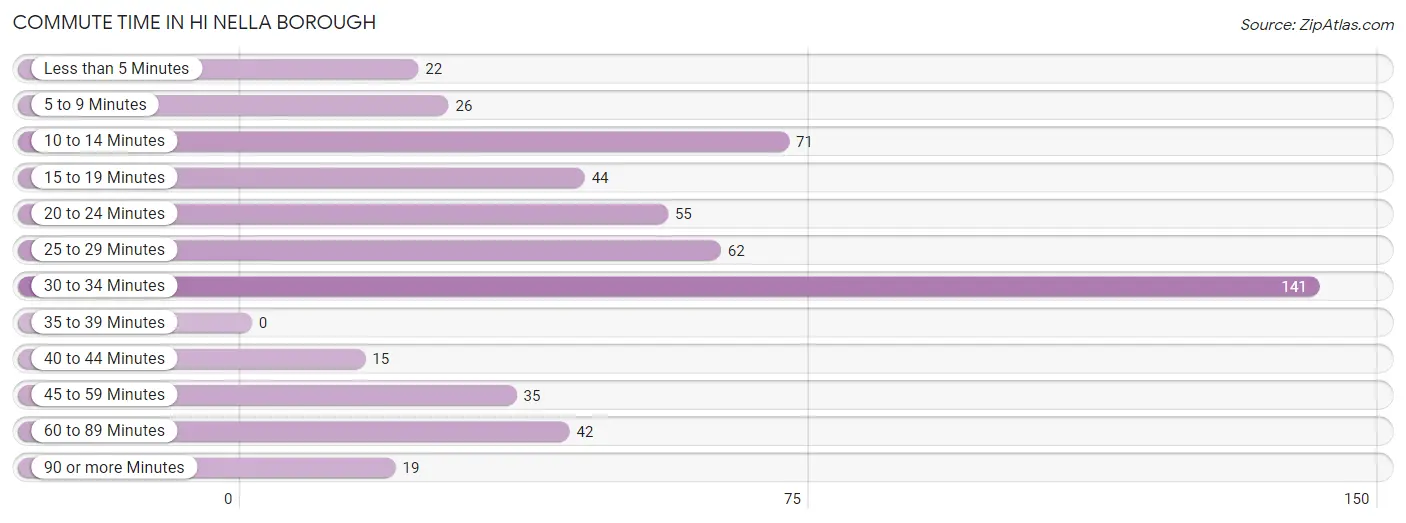
| Commute Time | # Commuters | % Commuters |
| Less than 5 Minutes | 22 | 4.1% |
| 5 to 9 Minutes | 26 | 4.9% |
| 10 to 14 Minutes | 71 | 13.4% |
| 15 to 19 Minutes | 44 | 8.3% |
| 20 to 24 Minutes | 55 | 10.3% |
| 25 to 29 Minutes | 62 | 11.7% |
| 30 to 34 Minutes | 141 | 26.5% |
| 35 to 39 Minutes | 0 | 0.0% |
| 40 to 44 Minutes | 15 | 2.8% |
| 45 to 59 Minutes | 35 | 6.6% |
| 60 to 89 Minutes | 42 | 7.9% |
| 90 or more Minutes | 19 | 3.6% |
Commute Time by Sex in Hi Nella borough
The most common commute times in Hi Nella borough are 30 to 34 minutes (111 commuters, 39.0%) for males and 25 to 29 minutes (55 commuters, 22.3%) for females.
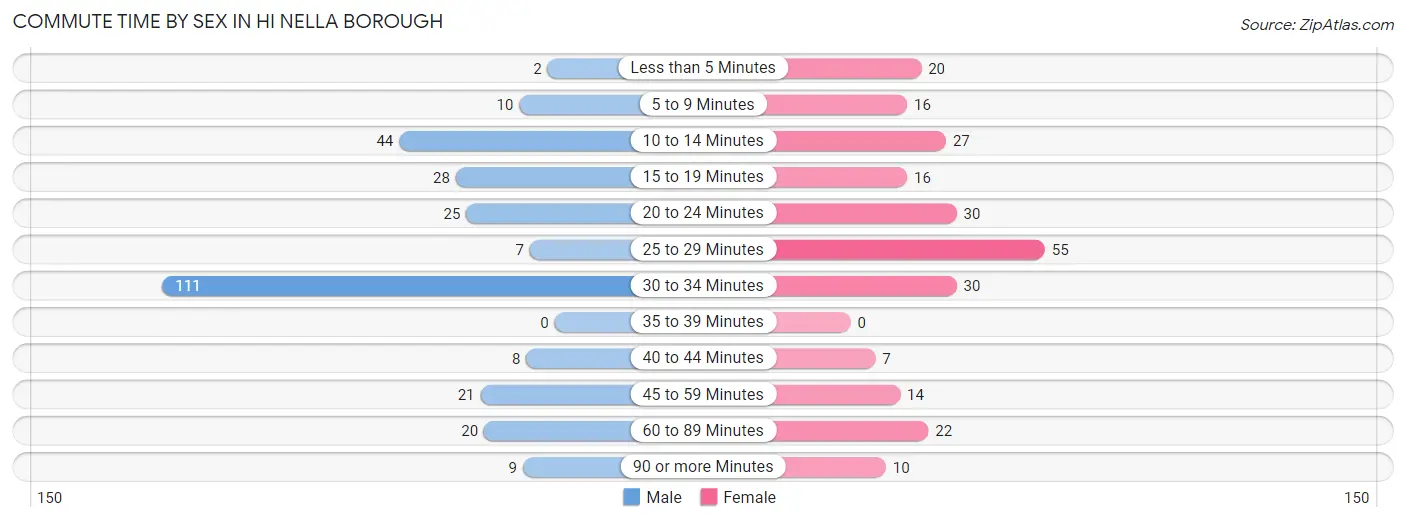
| Commute Time | Male | Female |
| Less than 5 Minutes | 2 (0.7%) | 20 (8.1%) |
| 5 to 9 Minutes | 10 (3.5%) | 16 (6.5%) |
| 10 to 14 Minutes | 44 (15.4%) | 27 (10.9%) |
| 15 to 19 Minutes | 28 (9.8%) | 16 (6.5%) |
| 20 to 24 Minutes | 25 (8.8%) | 30 (12.1%) |
| 25 to 29 Minutes | 7 (2.5%) | 55 (22.3%) |
| 30 to 34 Minutes | 111 (39.0%) | 30 (12.1%) |
| 35 to 39 Minutes | 0 (0.0%) | 0 (0.0%) |
| 40 to 44 Minutes | 8 (2.8%) | 7 (2.8%) |
| 45 to 59 Minutes | 21 (7.4%) | 14 (5.7%) |
| 60 to 89 Minutes | 20 (7.0%) | 22 (8.9%) |
| 90 or more Minutes | 9 (3.2%) | 10 (4.1%) |
Time of Departure to Work by Sex in Hi Nella borough
The most frequent times of departure to work in Hi Nella borough are 12:00 PM to 3:59 PM (62, 21.7%) for males and 8:00 AM to 8:29 AM (71, 28.7%) for females.
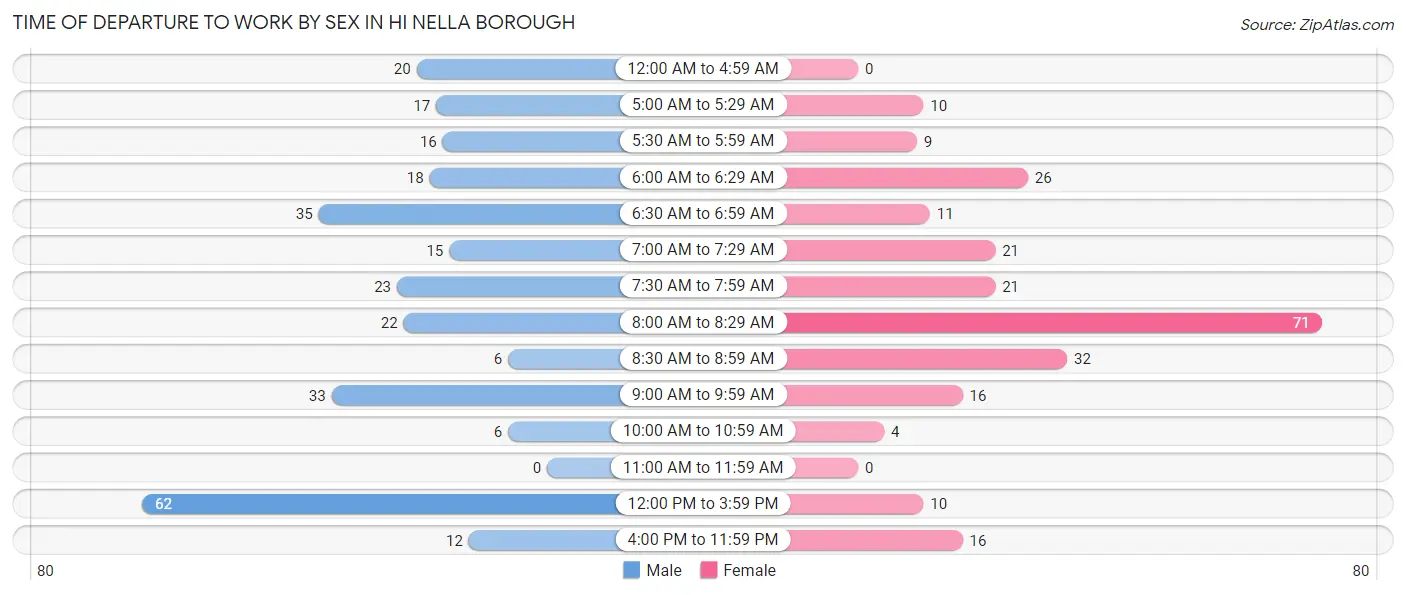
| Time of Departure | Male | Female |
| 12:00 AM to 4:59 AM | 20 (7.0%) | 0 (0.0%) |
| 5:00 AM to 5:29 AM | 17 (6.0%) | 10 (4.1%) |
| 5:30 AM to 5:59 AM | 16 (5.6%) | 9 (3.6%) |
| 6:00 AM to 6:29 AM | 18 (6.3%) | 26 (10.5%) |
| 6:30 AM to 6:59 AM | 35 (12.3%) | 11 (4.4%) |
| 7:00 AM to 7:29 AM | 15 (5.3%) | 21 (8.5%) |
| 7:30 AM to 7:59 AM | 23 (8.1%) | 21 (8.5%) |
| 8:00 AM to 8:29 AM | 22 (7.7%) | 71 (28.7%) |
| 8:30 AM to 8:59 AM | 6 (2.1%) | 32 (13.0%) |
| 9:00 AM to 9:59 AM | 33 (11.6%) | 16 (6.5%) |
| 10:00 AM to 10:59 AM | 6 (2.1%) | 4 (1.6%) |
| 11:00 AM to 11:59 AM | 0 (0.0%) | 0 (0.0%) |
| 12:00 PM to 3:59 PM | 62 (21.7%) | 10 (4.1%) |
| 4:00 PM to 11:59 PM | 12 (4.2%) | 16 (6.5%) |
| Total | 285 (100.0%) | 247 (100.0%) |
Housing Occupancy in Hi Nella borough
Occupancy by Ownership in Hi Nella borough
Of the total 424 dwellings in Hi Nella borough, owner-occupied units account for 143 (33.7%), while renter-occupied units make up 281 (66.3%).
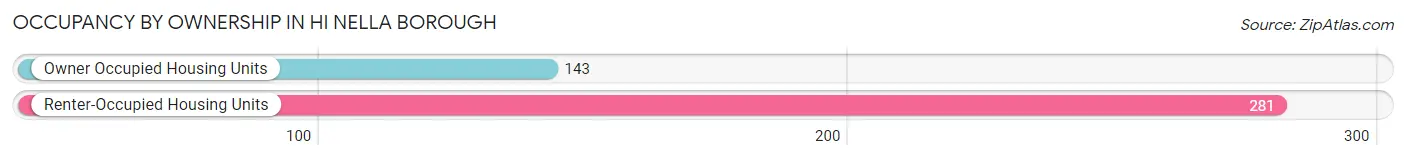
| Occupancy | # Housing Units | % Housing Units |
| Owner Occupied Housing Units | 143 | 33.7% |
| Renter-Occupied Housing Units | 281 | 66.3% |
| Total Occupied Housing Units | 424 | 100.0% |
Occupancy by Household Size in Hi Nella borough
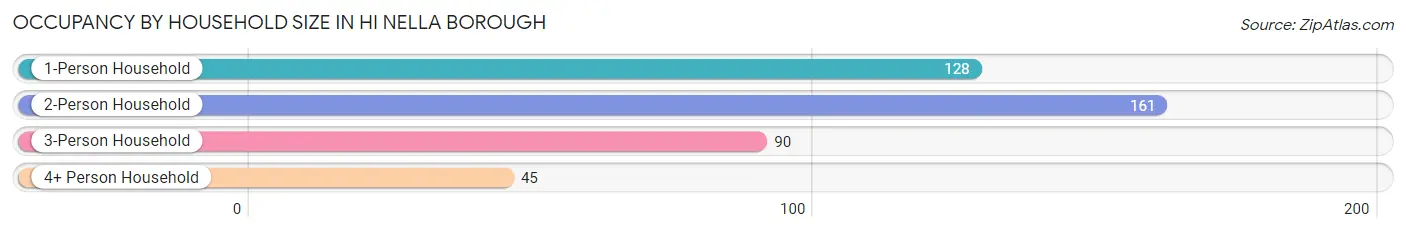
| Household Size | # Housing Units | % Housing Units |
| 1-Person Household | 128 | 30.2% |
| 2-Person Household | 161 | 38.0% |
| 3-Person Household | 90 | 21.2% |
| 4+ Person Household | 45 | 10.6% |
| Total Housing Units | 424 | 100.0% |
Occupancy by Ownership by Household Size in Hi Nella borough
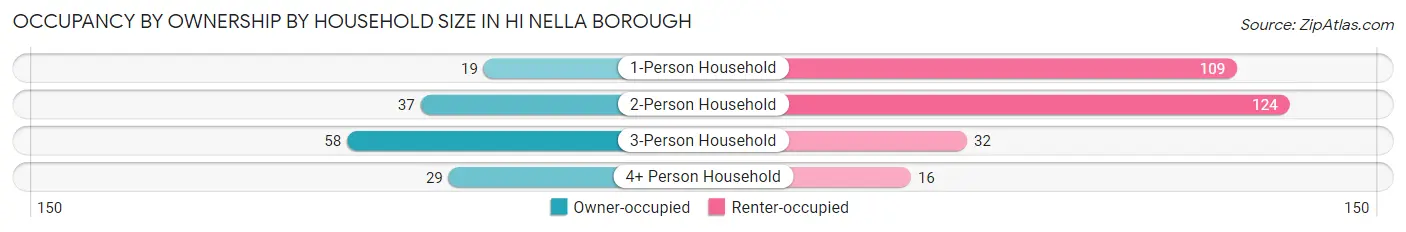
| Household Size | Owner-occupied | Renter-occupied |
| 1-Person Household | 19 (14.8%) | 109 (85.2%) |
| 2-Person Household | 37 (23.0%) | 124 (77.0%) |
| 3-Person Household | 58 (64.4%) | 32 (35.6%) |
| 4+ Person Household | 29 (64.4%) | 16 (35.6%) |
| Total Housing Units | 143 (33.7%) | 281 (66.3%) |
Occupancy by Educational Attainment in Hi Nella borough
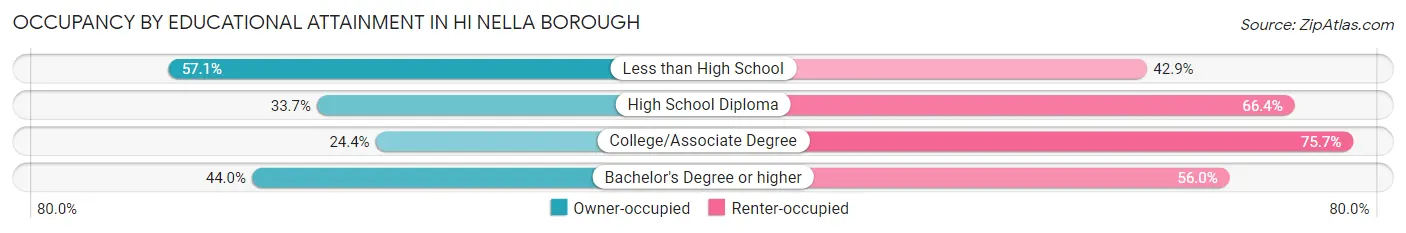
| Household Size | Owner-occupied | Renter-occupied |
| Less than High School | 4 (57.1%) | 3 (42.9%) |
| High School Diploma | 71 (33.7%) | 140 (66.3%) |
| College/Associate Degree | 28 (24.3%) | 87 (75.6%) |
| Bachelor's Degree or higher | 40 (44.0%) | 51 (56.0%) |
Occupancy by Age of Householder in Hi Nella borough
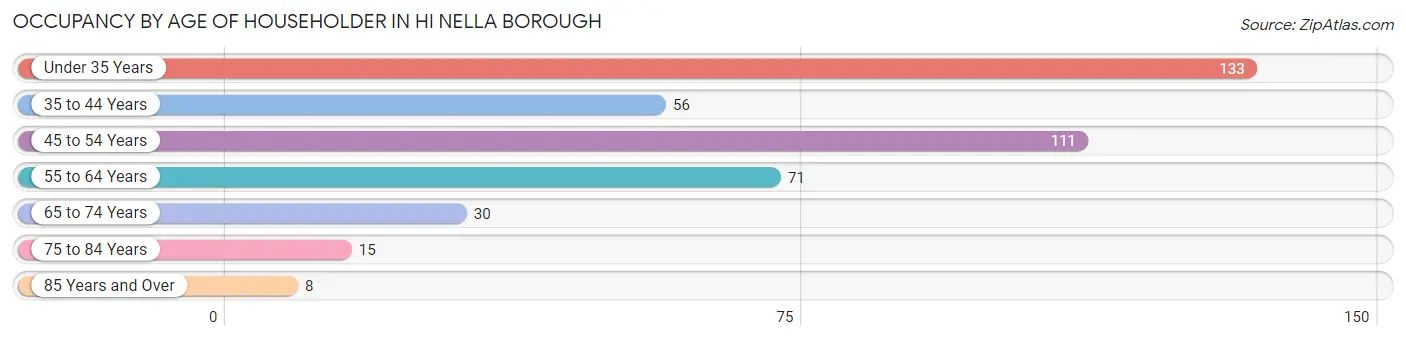
| Age Bracket | # Households | % Households |
| Under 35 Years | 133 | 31.4% |
| 35 to 44 Years | 56 | 13.2% |
| 45 to 54 Years | 111 | 26.2% |
| 55 to 64 Years | 71 | 16.8% |
| 65 to 74 Years | 30 | 7.1% |
| 75 to 84 Years | 15 | 3.5% |
| 85 Years and Over | 8 | 1.9% |
| Total | 424 | 100.0% |
Housing Finances in Hi Nella borough
Median Income by Occupancy in Hi Nella borough
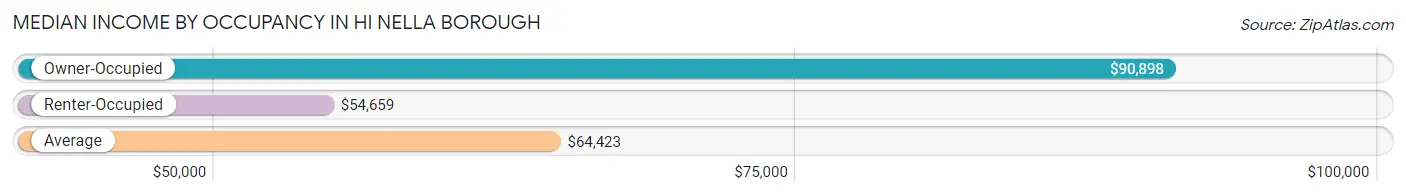
| Occupancy Type | # Households | Median Income |
| Owner-Occupied | 143 (33.7%) | $90,898 |
| Renter-Occupied | 281 (66.3%) | $54,659 |
| Average | 424 (100.0%) | $64,423 |
Occupancy by Householder Income Bracket in Hi Nella borough
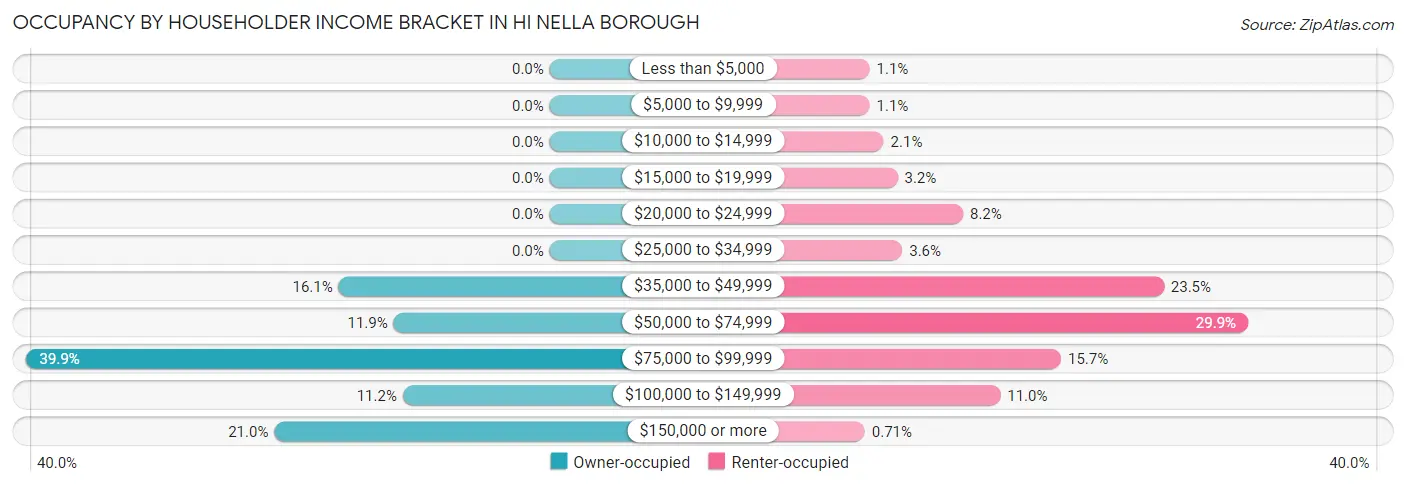
| Income Bracket | Owner-occupied | Renter-occupied |
| Less than $5,000 | 0 (0.0%) | 3 (1.1%) |
| $5,000 to $9,999 | 0 (0.0%) | 3 (1.1%) |
| $10,000 to $14,999 | 0 (0.0%) | 6 (2.1%) |
| $15,000 to $19,999 | 0 (0.0%) | 9 (3.2%) |
| $20,000 to $24,999 | 0 (0.0%) | 23 (8.2%) |
| $25,000 to $34,999 | 0 (0.0%) | 10 (3.6%) |
| $35,000 to $49,999 | 23 (16.1%) | 66 (23.5%) |
| $50,000 to $74,999 | 17 (11.9%) | 84 (29.9%) |
| $75,000 to $99,999 | 57 (39.9%) | 44 (15.7%) |
| $100,000 to $149,999 | 16 (11.2%) | 31 (11.0%) |
| $150,000 or more | 30 (21.0%) | 2 (0.7%) |
| Total | 143 (100.0%) | 281 (100.0%) |
Monthly Housing Cost Tiers in Hi Nella borough
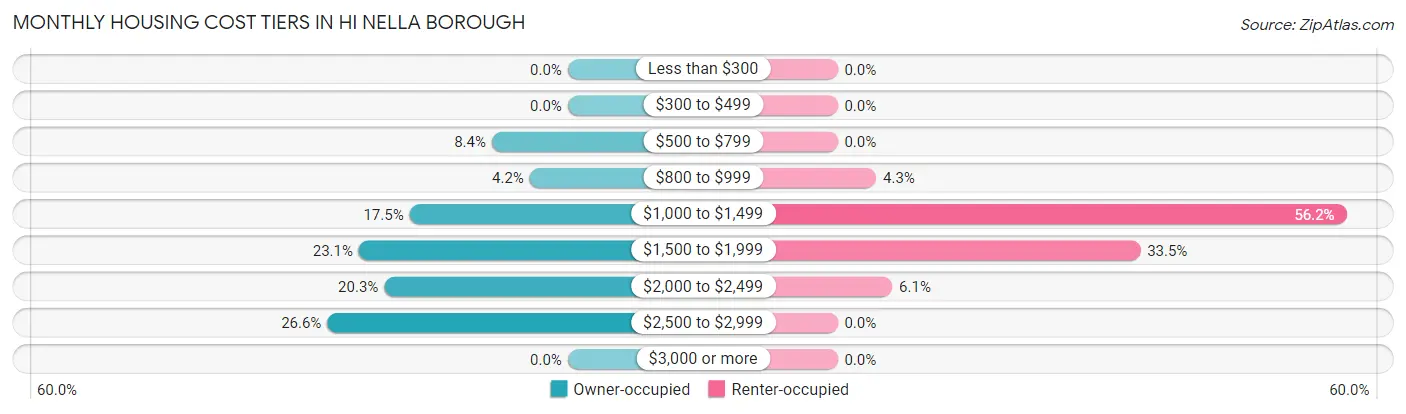
| Monthly Cost | Owner-occupied | Renter-occupied |
| Less than $300 | 0 (0.0%) | 0 (0.0%) |
| $300 to $499 | 0 (0.0%) | 0 (0.0%) |
| $500 to $799 | 12 (8.4%) | 0 (0.0%) |
| $800 to $999 | 6 (4.2%) | 12 (4.3%) |
| $1,000 to $1,499 | 25 (17.5%) | 158 (56.2%) |
| $1,500 to $1,999 | 33 (23.1%) | 94 (33.5%) |
| $2,000 to $2,499 | 29 (20.3%) | 17 (6.0%) |
| $2,500 to $2,999 | 38 (26.6%) | 0 (0.0%) |
| $3,000 or more | 0 (0.0%) | 0 (0.0%) |
| Total | 143 (100.0%) | 281 (100.0%) |
Physical Housing Characteristics in Hi Nella borough
Housing Structures in Hi Nella borough
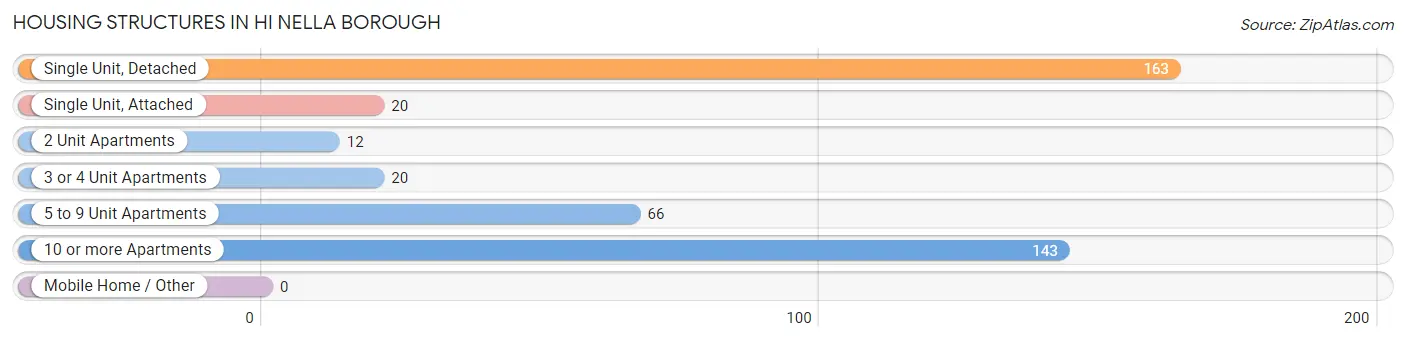
| Structure Type | # Housing Units | % Housing Units |
| Single Unit, Detached | 163 | 38.4% |
| Single Unit, Attached | 20 | 4.7% |
| 2 Unit Apartments | 12 | 2.8% |
| 3 or 4 Unit Apartments | 20 | 4.7% |
| 5 to 9 Unit Apartments | 66 | 15.6% |
| 10 or more Apartments | 143 | 33.7% |
| Mobile Home / Other | 0 | 0.0% |
| Total | 424 | 100.0% |
Housing Structures by Occupancy in Hi Nella borough
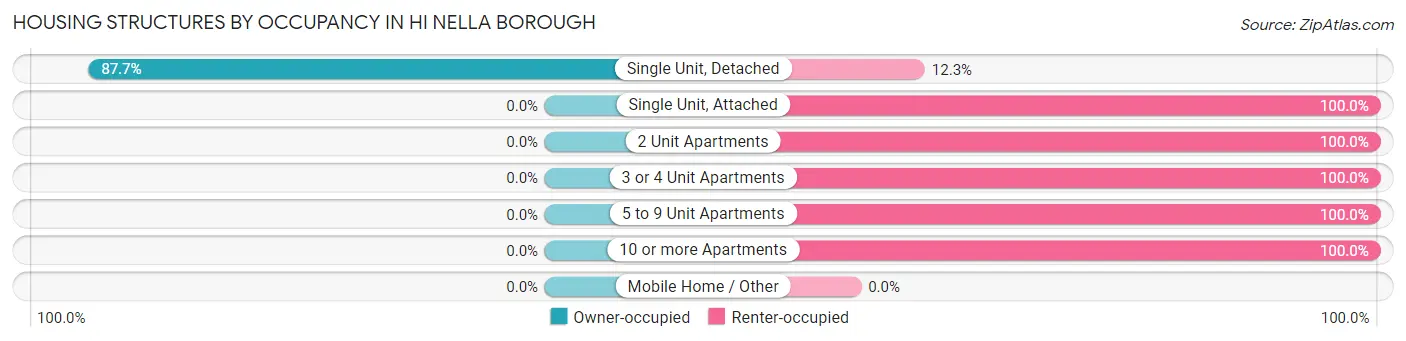
| Structure Type | Owner-occupied | Renter-occupied |
| Single Unit, Detached | 143 (87.7%) | 20 (12.3%) |
| Single Unit, Attached | 0 (0.0%) | 20 (100.0%) |
| 2 Unit Apartments | 0 (0.0%) | 12 (100.0%) |
| 3 or 4 Unit Apartments | 0 (0.0%) | 20 (100.0%) |
| 5 to 9 Unit Apartments | 0 (0.0%) | 66 (100.0%) |
| 10 or more Apartments | 0 (0.0%) | 143 (100.0%) |
| Mobile Home / Other | 0 (0.0%) | 0 (0.0%) |
| Total | 143 (33.7%) | 281 (66.3%) |
Housing Structures by Number of Rooms in Hi Nella borough
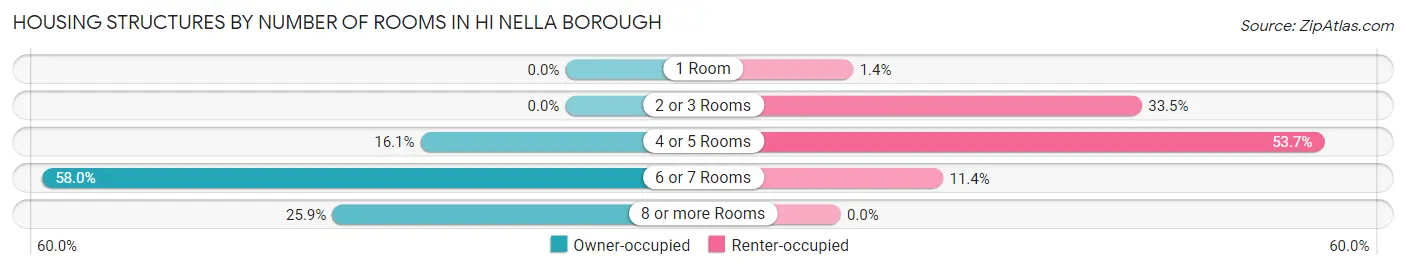
| Number of Rooms | Owner-occupied | Renter-occupied |
| 1 Room | 0 (0.0%) | 4 (1.4%) |
| 2 or 3 Rooms | 0 (0.0%) | 94 (33.5%) |
| 4 or 5 Rooms | 23 (16.1%) | 151 (53.7%) |
| 6 or 7 Rooms | 83 (58.0%) | 32 (11.4%) |
| 8 or more Rooms | 37 (25.9%) | 0 (0.0%) |
| Total | 143 (100.0%) | 281 (100.0%) |
Housing Structure by Heating Type in Hi Nella borough
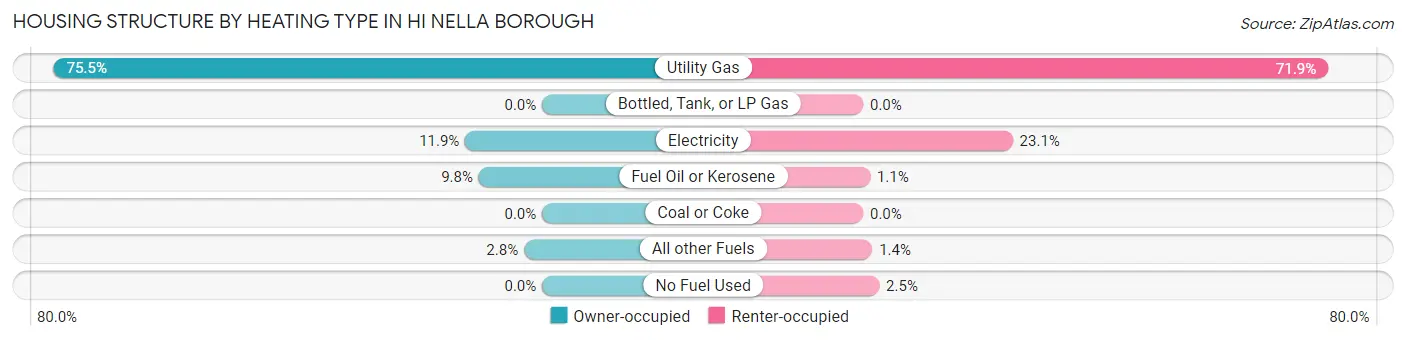
| Heating Type | Owner-occupied | Renter-occupied |
| Utility Gas | 108 (75.5%) | 202 (71.9%) |
| Bottled, Tank, or LP Gas | 0 (0.0%) | 0 (0.0%) |
| Electricity | 17 (11.9%) | 65 (23.1%) |
| Fuel Oil or Kerosene | 14 (9.8%) | 3 (1.1%) |
| Coal or Coke | 0 (0.0%) | 0 (0.0%) |
| All other Fuels | 4 (2.8%) | 4 (1.4%) |
| No Fuel Used | 0 (0.0%) | 7 (2.5%) |
| Total | 143 (100.0%) | 281 (100.0%) |
Household Vehicle Usage in Hi Nella borough
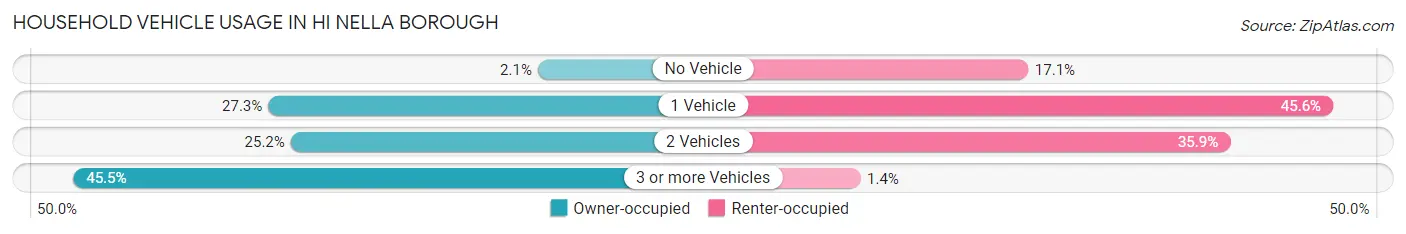
| Vehicles per Household | Owner-occupied | Renter-occupied |
| No Vehicle | 3 (2.1%) | 48 (17.1%) |
| 1 Vehicle | 39 (27.3%) | 128 (45.6%) |
| 2 Vehicles | 36 (25.2%) | 101 (35.9%) |
| 3 or more Vehicles | 65 (45.5%) | 4 (1.4%) |
| Total | 143 (100.0%) | 281 (100.0%) |
Real Estate & Mortgages in Hi Nella borough
Real Estate and Mortgage Overview in Hi Nella borough
| Characteristic | Without Mortgage | With Mortgage |
| Housing Units | 38 | 105 |
| Median Property Value | $185,900 | $212,700 |
| Median Household Income | $66,250 | $20 |
| Monthly Housing Costs | $1,013 | $0 |
| Real Estate Taxes | $7,692 | $0 |
Property Value by Mortgage Status in Hi Nella borough
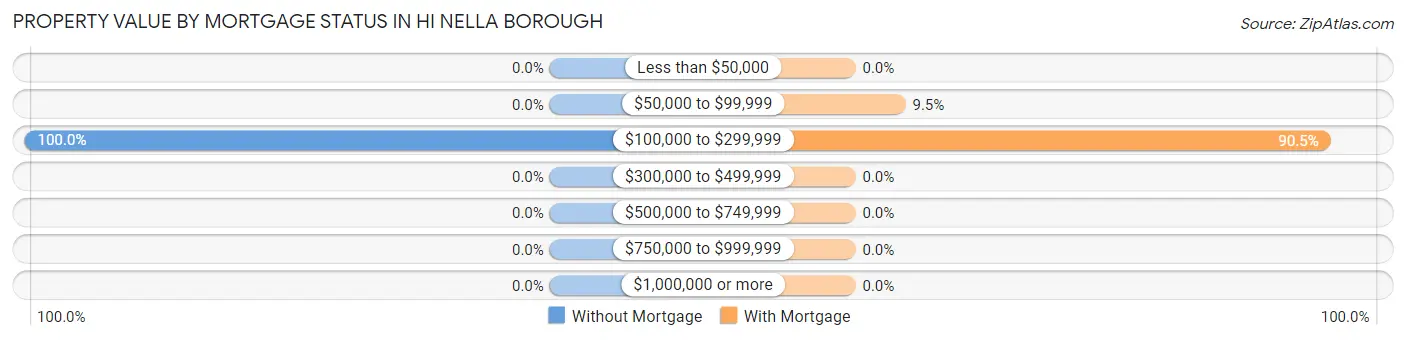
| Property Value | Without Mortgage | With Mortgage |
| Less than $50,000 | 0 (0.0%) | 0 (0.0%) |
| $50,000 to $99,999 | 0 (0.0%) | 10 (9.5%) |
| $100,000 to $299,999 | 38 (100.0%) | 95 (90.5%) |
| $300,000 to $499,999 | 0 (0.0%) | 0 (0.0%) |
| $500,000 to $749,999 | 0 (0.0%) | 0 (0.0%) |
| $750,000 to $999,999 | 0 (0.0%) | 0 (0.0%) |
| $1,000,000 or more | 0 (0.0%) | 0 (0.0%) |
| Total | 38 (100.0%) | 105 (100.0%) |
Household Income by Mortgage Status in Hi Nella borough
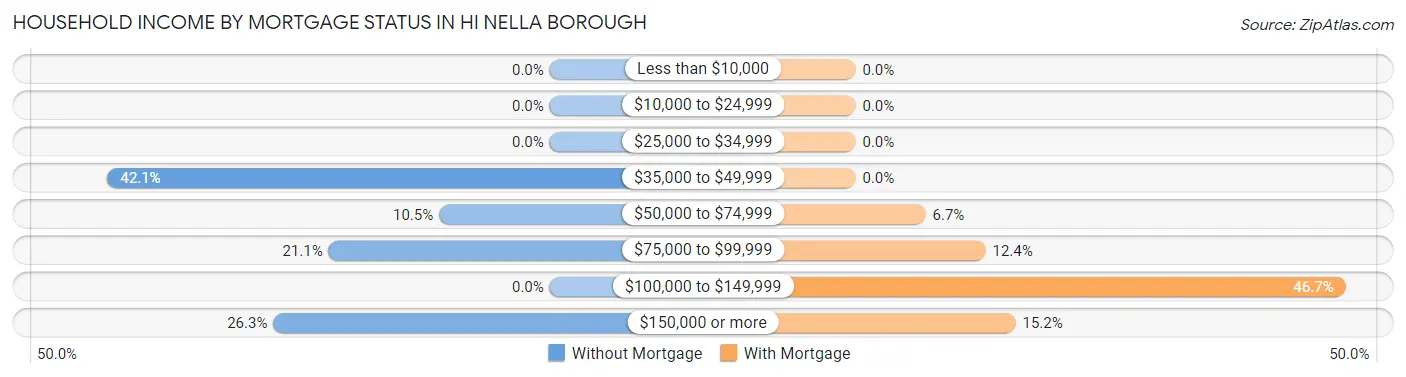
| Household Income | Without Mortgage | With Mortgage |
| Less than $10,000 | 0 (0.0%) | 0 (0.0%) |
| $10,000 to $24,999 | 0 (0.0%) | 0 (0.0%) |
| $25,000 to $34,999 | 0 (0.0%) | 0 (0.0%) |
| $35,000 to $49,999 | 16 (42.1%) | 0 (0.0%) |
| $50,000 to $74,999 | 4 (10.5%) | 7 (6.7%) |
| $75,000 to $99,999 | 8 (21.0%) | 13 (12.4%) |
| $100,000 to $149,999 | 0 (0.0%) | 49 (46.7%) |
| $150,000 or more | 10 (26.3%) | 16 (15.2%) |
| Total | 38 (100.0%) | 105 (100.0%) |
Property Value to Household Income Ratio in Hi Nella borough
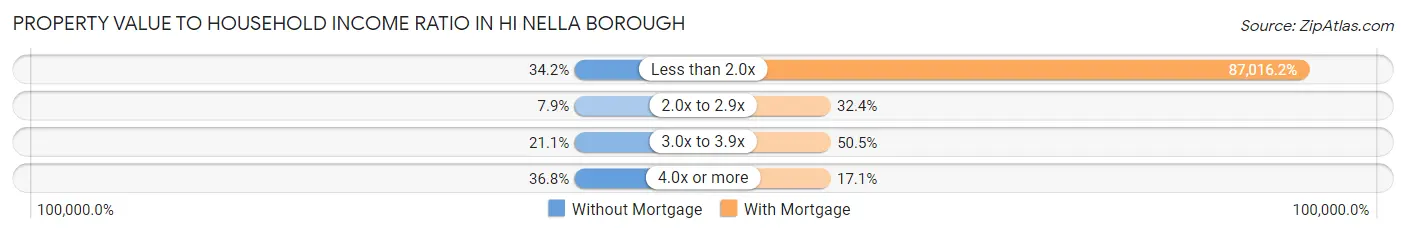
| Value-to-Income Ratio | Without Mortgage | With Mortgage |
| Less than 2.0x | 13 (34.2%) | 91,367 (87,016.2%) |
| 2.0x to 2.9x | 3 (7.9%) | 34 (32.4%) |
| 3.0x to 3.9x | 8 (21.0%) | 53 (50.5%) |
| 4.0x or more | 14 (36.8%) | 18 (17.1%) |
| Total | 38 (100.0%) | 105 (100.0%) |
Real Estate Taxes by Mortgage Status in Hi Nella borough
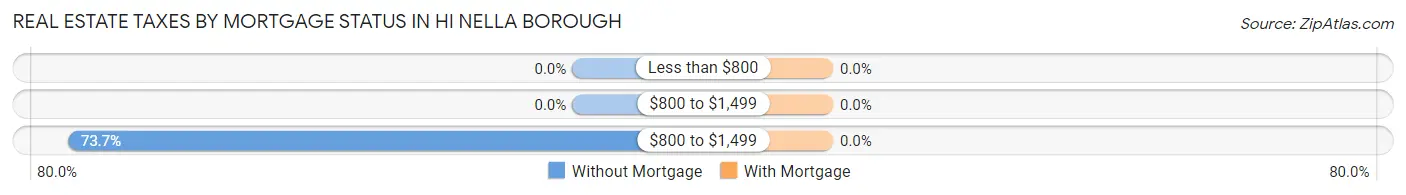
| Property Taxes | Without Mortgage | With Mortgage |
| Less than $800 | 0 (0.0%) | 0 (0.0%) |
| $800 to $1,499 | 0 (0.0%) | 0 (0.0%) |
| $800 to $1,499 | 28 (73.7%) | 0 (0.0%) |
| Total | 38 (100.0%) | 105 (100.0%) |
Health & Disability in Hi Nella borough
Health Insurance Coverage by Age in Hi Nella borough
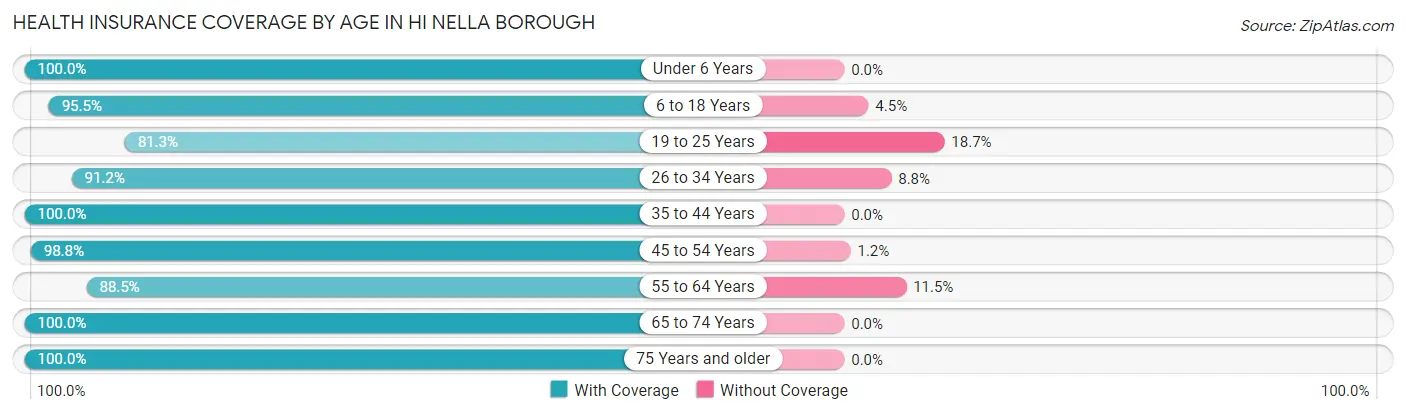
| Age Bracket | With Coverage | Without Coverage |
| Under 6 Years | 13 (100.0%) | 0 (0.0%) |
| 6 to 18 Years | 106 (95.5%) | 5 (4.5%) |
| 19 to 25 Years | 135 (81.3%) | 31 (18.7%) |
| 26 to 34 Years | 125 (91.2%) | 12 (8.8%) |
| 35 to 44 Years | 104 (100.0%) | 0 (0.0%) |
| 45 to 54 Years | 171 (98.8%) | 2 (1.2%) |
| 55 to 64 Years | 92 (88.5%) | 12 (11.5%) |
| 65 to 74 Years | 41 (100.0%) | 0 (0.0%) |
| 75 Years and older | 31 (100.0%) | 0 (0.0%) |
| Total | 818 (92.9%) | 62 (7.0%) |
Health Insurance Coverage by Citizenship Status in Hi Nella borough
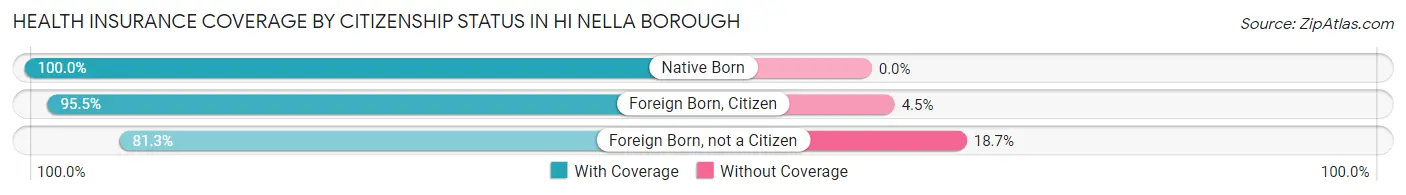
| Citizenship Status | With Coverage | Without Coverage |
| Native Born | 13 (100.0%) | 0 (0.0%) |
| Foreign Born, Citizen | 106 (95.5%) | 5 (4.5%) |
| Foreign Born, not a Citizen | 135 (81.3%) | 31 (18.7%) |
Health Insurance Coverage by Household Income in Hi Nella borough
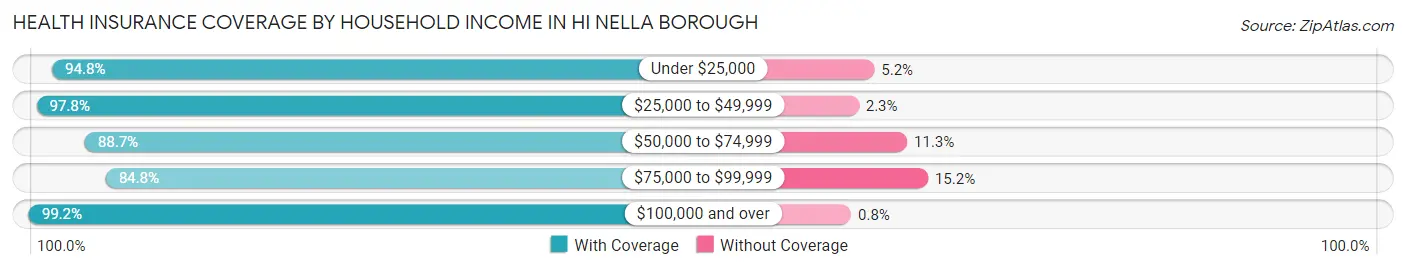
| Household Income | With Coverage | Without Coverage |
| Under $25,000 | 55 (94.8%) | 3 (5.2%) |
| $25,000 to $49,999 | 174 (97.8%) | 4 (2.2%) |
| $50,000 to $74,999 | 157 (88.7%) | 20 (11.3%) |
| $75,000 to $99,999 | 184 (84.8%) | 33 (15.2%) |
| $100,000 and over | 248 (99.2%) | 2 (0.8%) |
Public vs Private Health Insurance Coverage by Age in Hi Nella borough
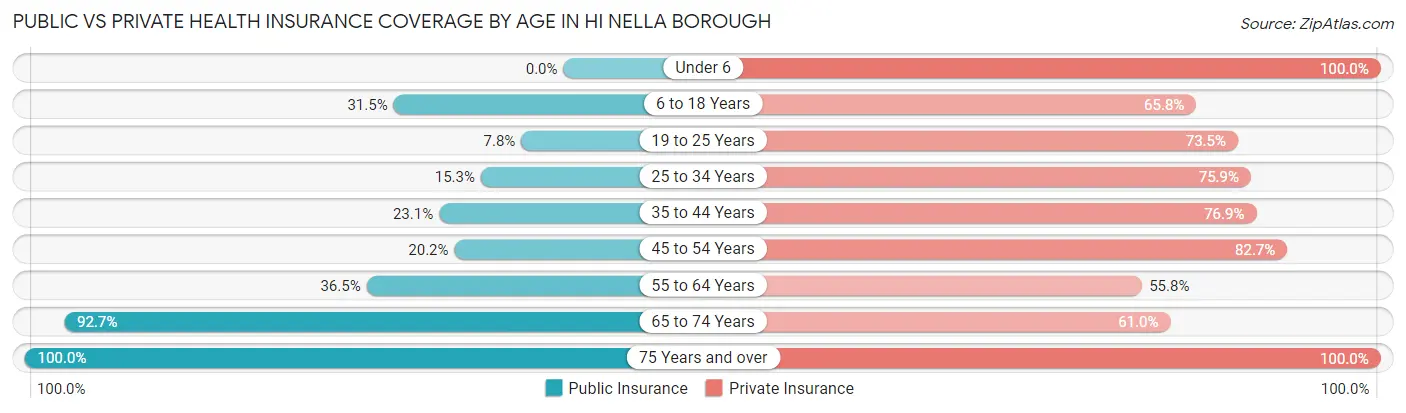
| Age Bracket | Public Insurance | Private Insurance |
| Under 6 | 0 (0.0%) | 13 (100.0%) |
| 6 to 18 Years | 35 (31.5%) | 73 (65.8%) |
| 19 to 25 Years | 13 (7.8%) | 122 (73.5%) |
| 25 to 34 Years | 21 (15.3%) | 104 (75.9%) |
| 35 to 44 Years | 24 (23.1%) | 80 (76.9%) |
| 45 to 54 Years | 35 (20.2%) | 143 (82.7%) |
| 55 to 64 Years | 38 (36.5%) | 58 (55.8%) |
| 65 to 74 Years | 38 (92.7%) | 25 (61.0%) |
| 75 Years and over | 31 (100.0%) | 31 (100.0%) |
| Total | 235 (26.7%) | 649 (73.8%) |
Disability Status by Sex by Age in Hi Nella borough
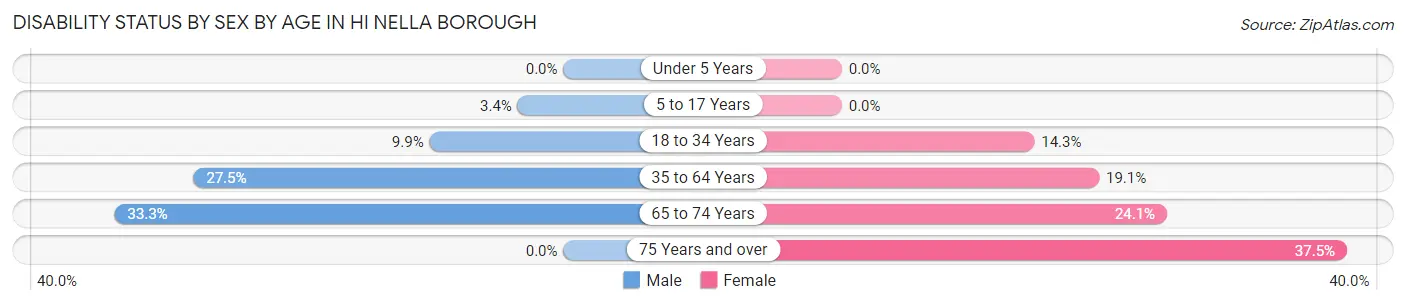
| Age Bracket | Male | Female |
| Under 5 Years | 0 (0.0%) | 0 (0.0%) |
| 5 to 17 Years | 2 (3.4%) | 0 (0.0%) |
| 18 to 34 Years | 17 (9.9%) | 20 (14.3%) |
| 35 to 64 Years | 50 (27.5%) | 38 (19.1%) |
| 65 to 74 Years | 4 (33.3%) | 7 (24.1%) |
| 75 Years and over | 0 (0.0%) | 6 (37.5%) |
Disability Class by Sex by Age in Hi Nella borough
Disability Class: Hearing Difficulty
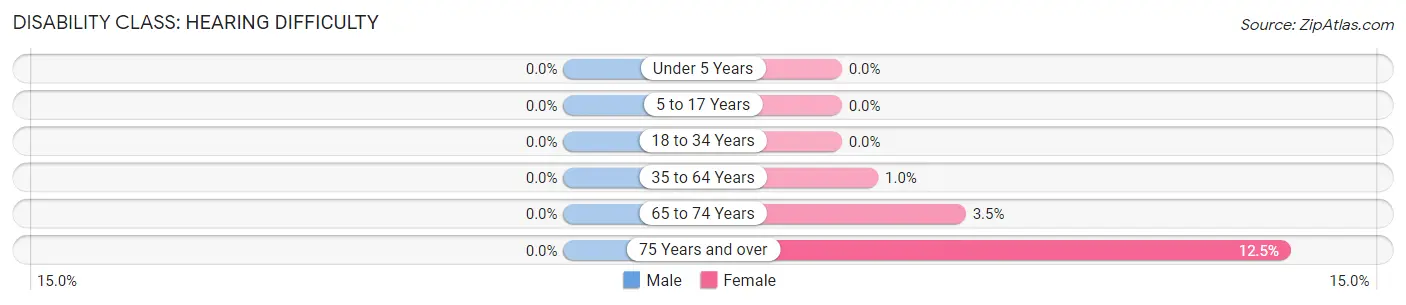
| Age Bracket | Male | Female |
| Under 5 Years | 0 (0.0%) | 0 (0.0%) |
| 5 to 17 Years | 0 (0.0%) | 0 (0.0%) |
| 18 to 34 Years | 0 (0.0%) | 0 (0.0%) |
| 35 to 64 Years | 0 (0.0%) | 2 (1.0%) |
| 65 to 74 Years | 0 (0.0%) | 1 (3.5%) |
| 75 Years and over | 0 (0.0%) | 2 (12.5%) |
Disability Class: Vision Difficulty
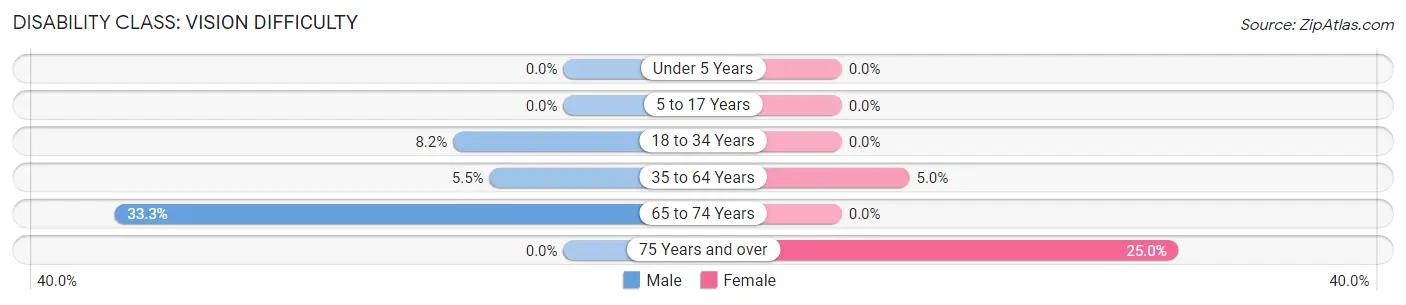
| Age Bracket | Male | Female |
| Under 5 Years | 0 (0.0%) | 0 (0.0%) |
| 5 to 17 Years | 0 (0.0%) | 0 (0.0%) |
| 18 to 34 Years | 14 (8.2%) | 0 (0.0%) |
| 35 to 64 Years | 10 (5.5%) | 10 (5.0%) |
| 65 to 74 Years | 4 (33.3%) | 0 (0.0%) |
| 75 Years and over | 0 (0.0%) | 4 (25.0%) |
Disability Class: Cognitive Difficulty
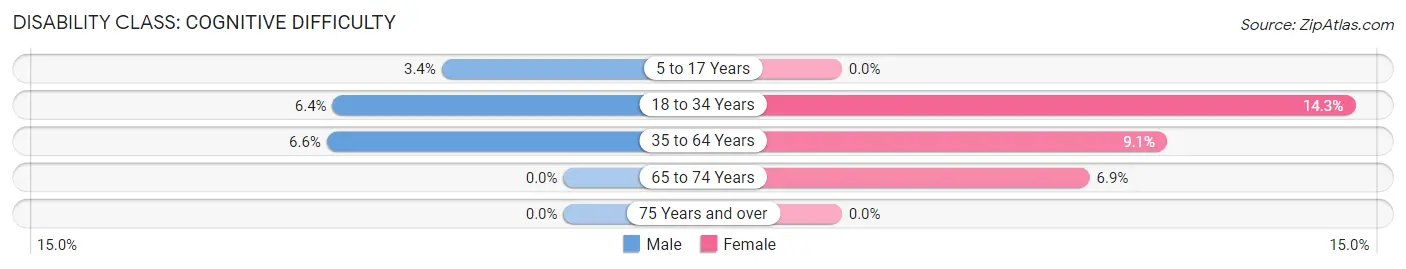
| Age Bracket | Male | Female |
| 5 to 17 Years | 2 (3.4%) | 0 (0.0%) |
| 18 to 34 Years | 11 (6.4%) | 20 (14.3%) |
| 35 to 64 Years | 12 (6.6%) | 18 (9.0%) |
| 65 to 74 Years | 0 (0.0%) | 2 (6.9%) |
| 75 Years and over | 0 (0.0%) | 0 (0.0%) |
Disability Class: Ambulatory Difficulty
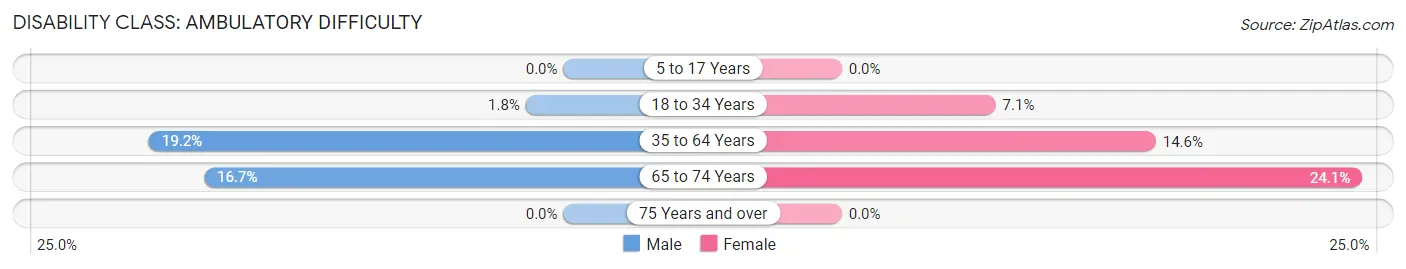
| Age Bracket | Male | Female |
| 5 to 17 Years | 0 (0.0%) | 0 (0.0%) |
| 18 to 34 Years | 3 (1.8%) | 10 (7.1%) |
| 35 to 64 Years | 35 (19.2%) | 29 (14.6%) |
| 65 to 74 Years | 2 (16.7%) | 7 (24.1%) |
| 75 Years and over | 0 (0.0%) | 0 (0.0%) |
Disability Class: Self-Care Difficulty
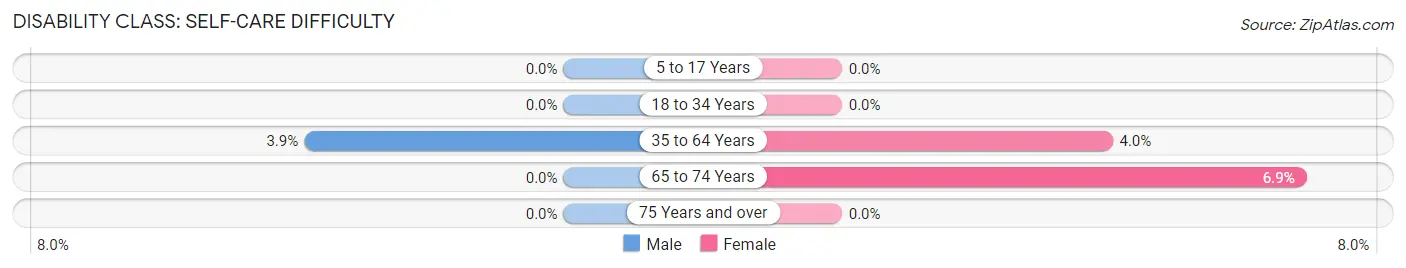
| Age Bracket | Male | Female |
| 5 to 17 Years | 0 (0.0%) | 0 (0.0%) |
| 18 to 34 Years | 0 (0.0%) | 0 (0.0%) |
| 35 to 64 Years | 7 (3.8%) | 8 (4.0%) |
| 65 to 74 Years | 0 (0.0%) | 2 (6.9%) |
| 75 Years and over | 0 (0.0%) | 0 (0.0%) |
Technology Access in Hi Nella borough
Computing Device Access in Hi Nella borough
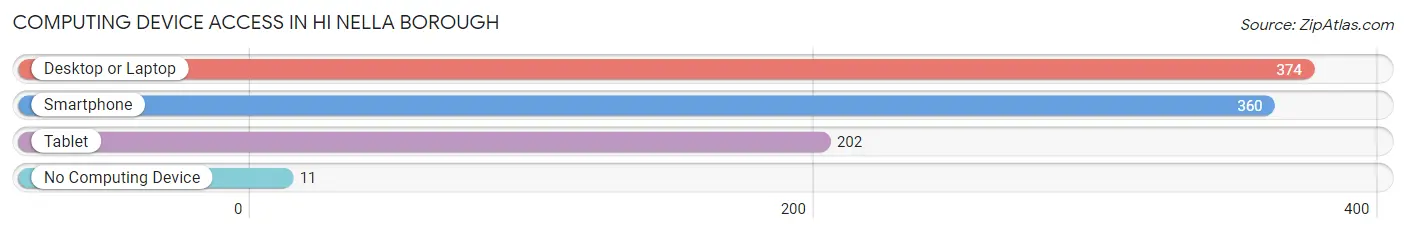
| Device Type | # Households | % Households |
| Desktop or Laptop | 374 | 88.2% |
| Smartphone | 360 | 84.9% |
| Tablet | 202 | 47.6% |
| No Computing Device | 11 | 2.6% |
| Total | 424 | 100.0% |
Internet Access in Hi Nella borough
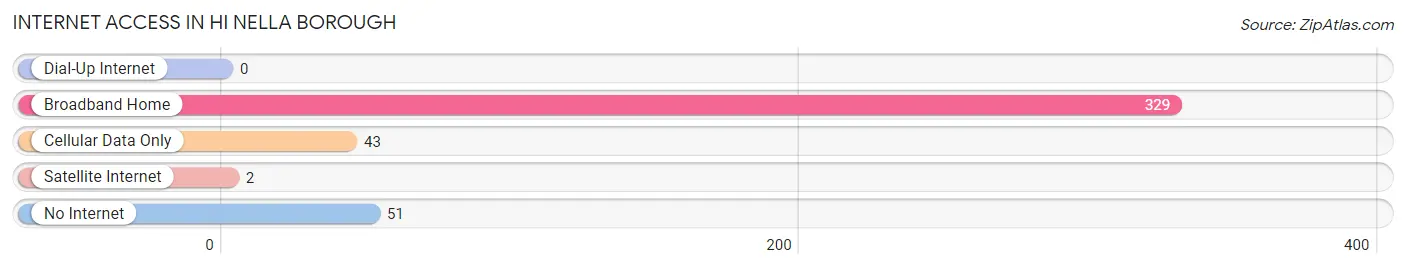
| Internet Type | # Households | % Households |
| Dial-Up Internet | 0 | 0.0% |
| Broadband Home | 329 | 77.6% |
| Cellular Data Only | 43 | 10.1% |
| Satellite Internet | 2 | 0.5% |
| No Internet | 51 | 12.0% |
| Total | 424 | 100.0% |
Hi Nella borough Summary
Nella Borough is a small borough located in Bergen County, New Jersey. It is situated in the northern part of the state, just south of the New York border. The borough is home to a population of just over 4,000 people, making it one of the smallest municipalities in the state. Despite its small size, Nella Borough has a rich history, diverse geography, and a vibrant economy.
History
Nella Borough was first settled in the late 1700s by Dutch and German immigrants. The area was originally known as “New Hackensack” and was part of the larger Hackensack Township. In 1871, the area was incorporated as the Borough of Nella, named after the wife of the first mayor, John Nella.
Throughout the 19th century, Nella Borough was a rural farming community. The area was known for its dairy farms and orchards, and the local economy was largely based on agriculture. In the early 20th century, the borough began to experience a period of growth and development. The population increased, and new businesses and industries began to move into the area.
Geography
Nella Borough is located in the northern part of Bergen County, just south of the New York border. The borough is situated on the Hackensack River, and is bordered by the towns of Hackensack, Teaneck, and Englewood. The borough covers an area of just over one square mile, and is home to a population of 4,072 people.
The borough is largely residential, with a mix of single-family homes, townhouses, and apartment buildings. The area is also home to several parks and recreational areas, including the Nella Borough Park and the Hackensack River Greenway.
Economy
Nella Borough has a vibrant economy, with a mix of small businesses, retail stores, and professional services. The borough is home to several large employers, including the Hackensack University Medical Center, the Hackensack Meridian Health Network, and the Bergen County Technical Schools.
The borough is also home to several small businesses, including restaurants, cafes, and specialty shops. The local economy is largely driven by the service sector, with many residents employed in healthcare, education, and retail.
Demographics
As of the 2010 census, Nella Borough had a population of 4,072 people. The population is largely white (83.3%), with smaller percentages of African American (7.2%), Asian (4.3%), and Hispanic (3.7%) residents. The median household income is $68,944, and the median age is 43.
Nella Borough is a diverse community, with a mix of cultures and backgrounds. The borough is home to a large Jewish population, as well as a growing Hispanic population. The borough is also home to a large number of immigrants, with over 20% of the population born outside of the United States.
Conclusion
Nella Borough is a small borough located in Bergen County, New Jersey. Despite its small size, the borough has a rich history, diverse geography, and a vibrant economy. The borough is home to a population of just over 4,000 people, and is largely white, with smaller percentages of African American, Asian, and Hispanic residents. The local economy is largely driven by the service sector, with many residents employed in healthcare, education, and retail. Nella Borough is a diverse community, with a mix of cultures and backgrounds, and is a great place to live and work.
Common Questions
What is Per Capita Income in Hi Nella borough?
Per Capita income in Hi Nella borough is $35,684.
What is the Median Family Income in Hi Nella borough?
Median Family Income in Hi Nella borough is $83,542.
What is the Median Household income in Hi Nella borough?
Median Household Income in Hi Nella borough is $64,423.
What is Income or Wage Gap in Hi Nella borough?
Income or Wage Gap in Hi Nella borough is 46.1%.
Women in Hi Nella borough earn 53.9 cents for every dollar earned by a man.
What is Inequality or Gini Index in Hi Nella borough?
Inequality or Gini Index in Hi Nella borough is 0.32.
What is the Total Population of Hi Nella borough?
Total Population of Hi Nella borough is 883.
What is the Total Male Population of Hi Nella borough?
Total Male Population of Hi Nella borough is 447.
What is the Total Female Population of Hi Nella borough?
Total Female Population of Hi Nella borough is 436.
What is the Ratio of Males per 100 Females in Hi Nella borough?
There are 102.52 Males per 100 Females in Hi Nella borough.
What is the Ratio of Females per 100 Males in Hi Nella borough?
There are 97.54 Females per 100 Males in Hi Nella borough.
What is the Median Population Age in Hi Nella borough?
Median Population Age in Hi Nella borough is 36.2 Years.
What is the Average Family Size in Hi Nella borough
Average Family Size in Hi Nella borough is 2.7 People.
What is the Average Household Size in Hi Nella borough
Average Household Size in Hi Nella borough is 2.1 People.
How Large is the Labor Force in Hi Nella borough?
There are 600 People in the Labor Forcein in Hi Nella borough.
What is the Percentage of People in the Labor Force in Hi Nella borough?
76.4% of People are in the Labor Force in Hi Nella borough.
What is the Unemployment Rate in Hi Nella borough?
Unemployment Rate in Hi Nella borough is 5.4%.