Mount Hermon, NJ Map & Demographics
Mount Hermon Map
Mount Hermon Overview
$51,651
PER CAPITA INCOME
48.1%
WAGE / INCOME GAP [ % ]
51.9¢/ $1
WAGE / INCOME GAP [ $ ]
0.40
INEQUALITY / GINI INDEX
230
TOTAL POPULATION
133
MALE POPULATION
97
FEMALE POPULATION
137.11
MALES / 100 FEMALES
72.93
FEMALES / 100 MALES
45.5
MEDIAN AGE
3.2
AVG FAMILY SIZE
2.6
AVG HOUSEHOLD SIZE
123
LABOR FORCE [ PEOPLE ]
64.7%
PERCENT IN LABOR FORCE
Income in Mount Hermon
Income Overview in Mount Hermon
| Characteristic | Number | Measure |
| Per Capita Income | 230 | $51,651 |
| Median Family Income | 66 | $0 |
| Mean Family Income | 66 | $160,083 |
| Median Household Income | 87 | $0 |
| Mean Household Income | 87 | $135,292 |
| Income Deficit | 66 | $0 |
| Wage / Income Gap (%) | 230 | 48.10% |
| Wage / Income Gap ($) | 230 | 51.90¢ per $1 |
| Gini / Inequality Index | 230 | 0.40 |
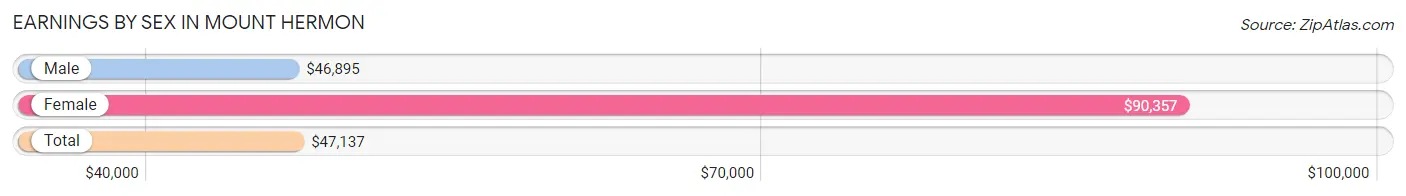
Earnings by Sex in Mount Hermon
Average Earnings in Mount Hermon are $47,137, $46,895 for men and $90,357 for women, a difference of 48.1%.
| Sex | Number | Average Earnings |
| Male | 91 (70.5%) | $46,895 |
| Female | 38 (29.5%) | $90,357 |
| Total | 129 (100.0%) | $47,137 |
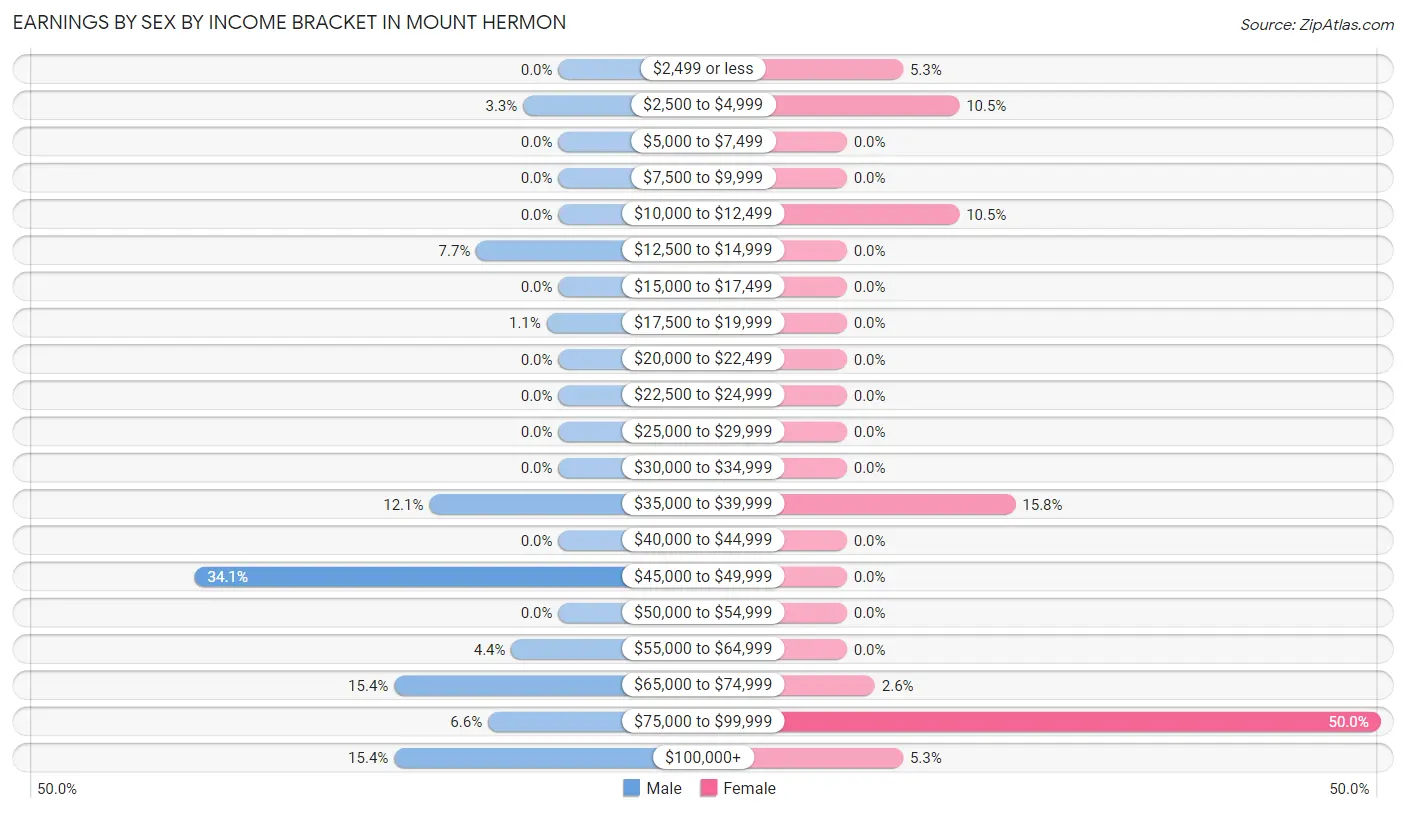
Earnings by Sex by Income Bracket in Mount Hermon
The most common earnings brackets in Mount Hermon are $45,000 to $49,999 for men (31 | 34.1%) and $75,000 to $99,999 for women (19 | 50.0%).
| Income | Male | Female |
| $2,499 or less | 0 (0.0%) | 2 (5.3%) |
| $2,500 to $4,999 | 3 (3.3%) | 4 (10.5%) |
| $5,000 to $7,499 | 0 (0.0%) | 0 (0.0%) |
| $7,500 to $9,999 | 0 (0.0%) | 0 (0.0%) |
| $10,000 to $12,499 | 0 (0.0%) | 4 (10.5%) |
| $12,500 to $14,999 | 7 (7.7%) | 0 (0.0%) |
| $15,000 to $17,499 | 0 (0.0%) | 0 (0.0%) |
| $17,500 to $19,999 | 1 (1.1%) | 0 (0.0%) |
| $20,000 to $22,499 | 0 (0.0%) | 0 (0.0%) |
| $22,500 to $24,999 | 0 (0.0%) | 0 (0.0%) |
| $25,000 to $29,999 | 0 (0.0%) | 0 (0.0%) |
| $30,000 to $34,999 | 0 (0.0%) | 0 (0.0%) |
| $35,000 to $39,999 | 11 (12.1%) | 6 (15.8%) |
| $40,000 to $44,999 | 0 (0.0%) | 0 (0.0%) |
| $45,000 to $49,999 | 31 (34.1%) | 0 (0.0%) |
| $50,000 to $54,999 | 0 (0.0%) | 0 (0.0%) |
| $55,000 to $64,999 | 4 (4.4%) | 0 (0.0%) |
| $65,000 to $74,999 | 14 (15.4%) | 1 (2.6%) |
| $75,000 to $99,999 | 6 (6.6%) | 19 (50.0%) |
| $100,000+ | 14 (15.4%) | 2 (5.3%) |
| Total | 91 (100.0%) | 38 (100.0%) |
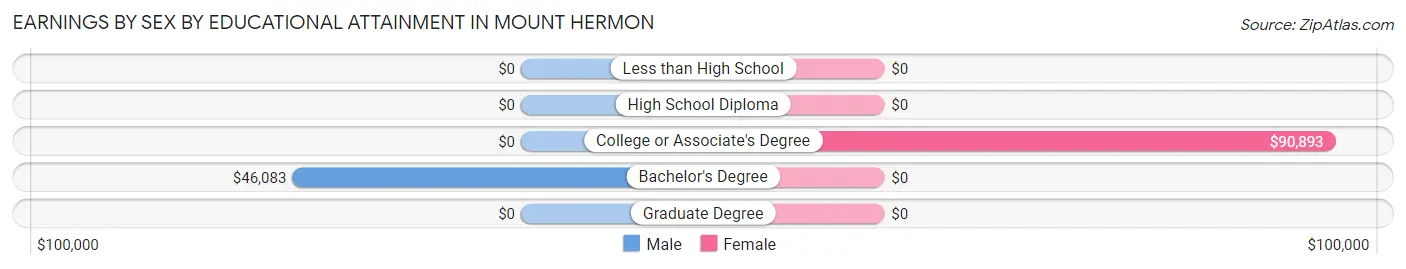
Earnings by Sex by Educational Attainment in Mount Hermon
Average earnings in Mount Hermon are $57,813 for men and $90,357 for women, a difference of 36.0%. Men with an educational attainment of bachelor's degree enjoy the highest average annual earnings of $46,083, while those with bachelor's degree education earn the least with $46,083. Women with an educational attainment of college or associate's degree earn the most with the average annual earnings of $90,893, while those with college or associate's degree education have the smallest earnings of $90,893.
| Educational Attainment | Male Income | Female Income |
| Less than High School | - | - |
| High School Diploma | - | - |
| College or Associate's Degree | - | - |
| Bachelor's Degree | $46,083 | $0 |
| Graduate Degree | - | - |
| Total | $57,813 | $90,357 |
Family Income in Mount Hermon
Family Income Brackets in Mount Hermon
According to the Mount Hermon family income data, there are 31 families falling into the $200,000+ income range, which is the most common income bracket and makes up 47.0% of all families.
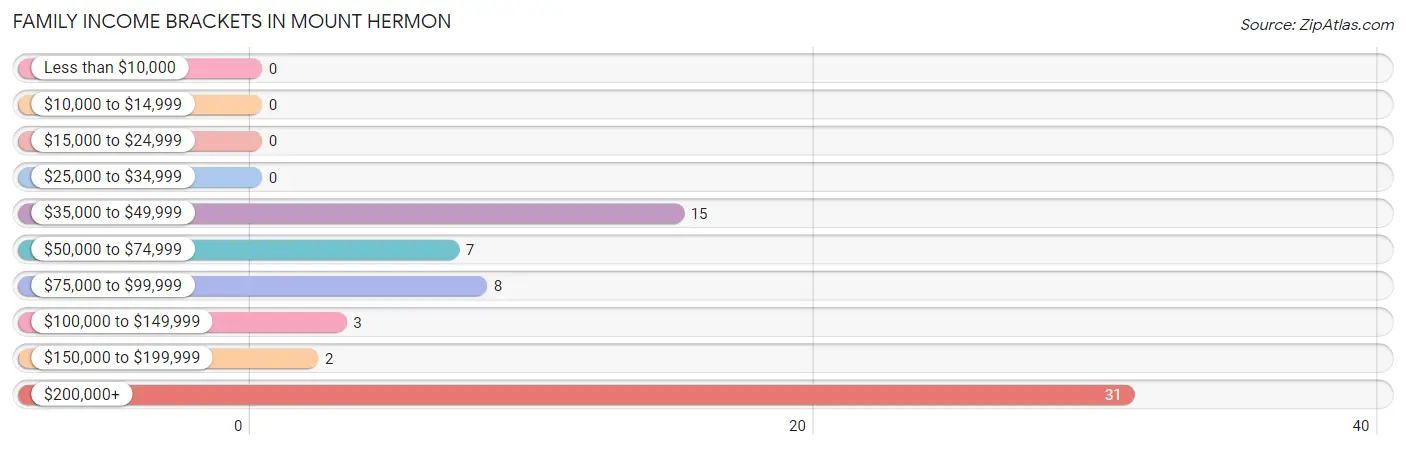
| Income Bracket | # Families | % Families |
| Less than $10,000 | 0 | 0.0% |
| $10,000 to $14,999 | 0 | 0.0% |
| $15,000 to $24,999 | 0 | 0.0% |
| $25,000 to $34,999 | 0 | 0.0% |
| $35,000 to $49,999 | 15 | 22.7% |
| $50,000 to $74,999 | 7 | 10.6% |
| $75,000 to $99,999 | 8 | 12.1% |
| $100,000 to $149,999 | 3 | 4.5% |
| $150,000 to $199,999 | 2 | 3.0% |
| $200,000+ | 31 | 47.0% |
Family Income by Famaliy Size in Mount Hermon
4-person families (27 | 40.9%) account for the highest median family income in Mount Hermon with $250,001 per family, while 4-person families (27 | 40.9%) have the highest median income of $62,500 per family member.
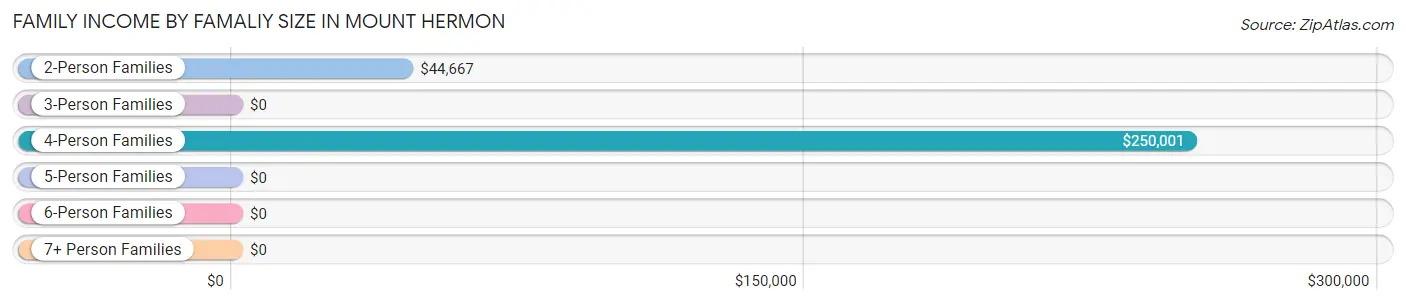
| Income Bracket | # Families | Median Income |
| 2-Person Families | 26 (39.4%) | $44,667 |
| 3-Person Families | 4 (6.1%) | $0 |
| 4-Person Families | 27 (40.9%) | $250,001 |
| 5-Person Families | 8 (12.1%) | $0 |
| 6-Person Families | 1 (1.5%) | $0 |
| 7+ Person Families | 0 (0.0%) | $0 |
| Total | 66 (100.0%) | $0 |
Family Income by Number of Earners in Mount Hermon
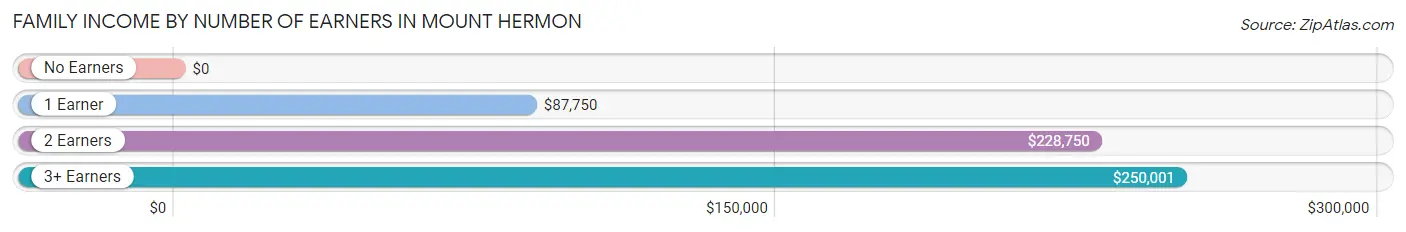
| Number of Earners | # Families | Median Income |
| No Earners | 15 (22.7%) | $0 |
| 1 Earner | 15 (22.7%) | $87,750 |
| 2 Earners | 18 (27.3%) | $228,750 |
| 3+ Earners | 18 (27.3%) | $250,001 |
| Total | 66 (100.0%) | $0 |
Household Income in Mount Hermon
Household Income Brackets in Mount Hermon
With 31 households falling in the category, the $200,000+ income range is the most frequent in Mount Hermon, accounting for 35.6% of all households.
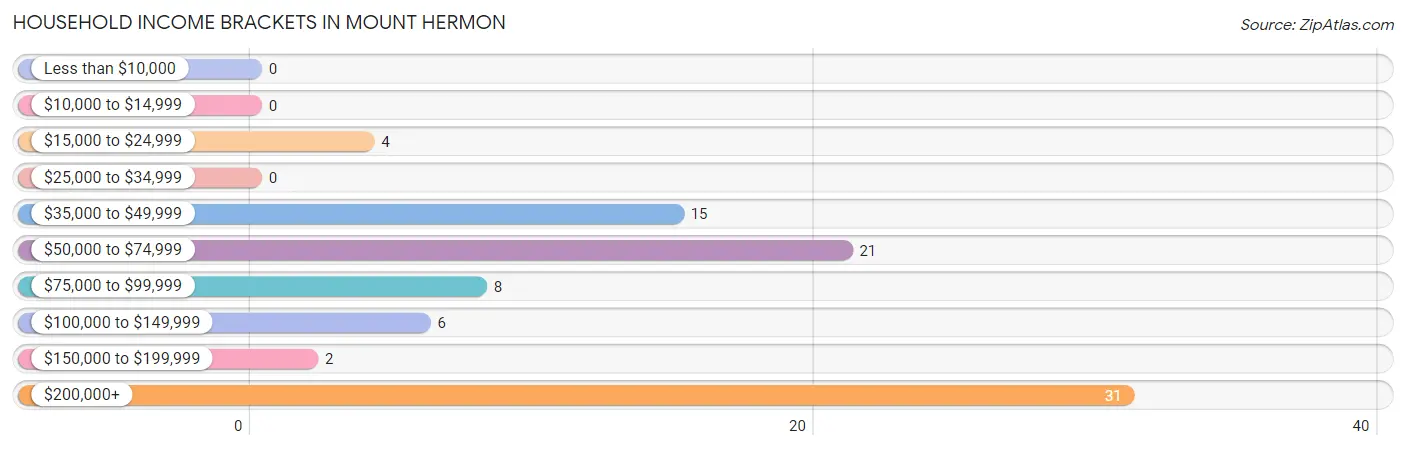
| Income Bracket | # Households | % Households |
| Less than $10,000 | 0 | 0.0% |
| $10,000 to $14,999 | 0 | 0.0% |
| $15,000 to $24,999 | 4 | 4.6% |
| $25,000 to $34,999 | 0 | 0.0% |
| $35,000 to $49,999 | 15 | 17.2% |
| $50,000 to $74,999 | 21 | 24.1% |
| $75,000 to $99,999 | 8 | 9.2% |
| $100,000 to $149,999 | 6 | 6.9% |
| $150,000 to $199,999 | 2 | 2.3% |
| $200,000+ | 31 | 35.6% |
Household Income by Householder Age in Mount Hermon
The median household income in Mount Hermon is $0, with the highest median household income of $228,750 found in the 25 to 44 years age bracket for the primary householder. A total of 18 households (20.7%) fall into this category.
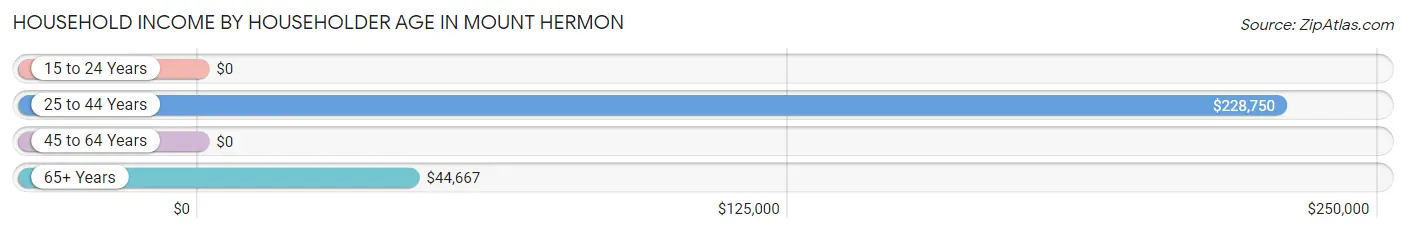
| Income Bracket | # Households | Median Income |
| 15 to 24 Years | 0 (0.0%) | $0 |
| 25 to 44 Years | 18 (20.7%) | $228,750 |
| 45 to 64 Years | 35 (40.2%) | $0 |
| 65+ Years | 34 (39.1%) | $44,667 |
| Total | 87 (100.0%) | $0 |
Poverty in Mount Hermon
Income Below Poverty by Sex and Age in Mount Hermon
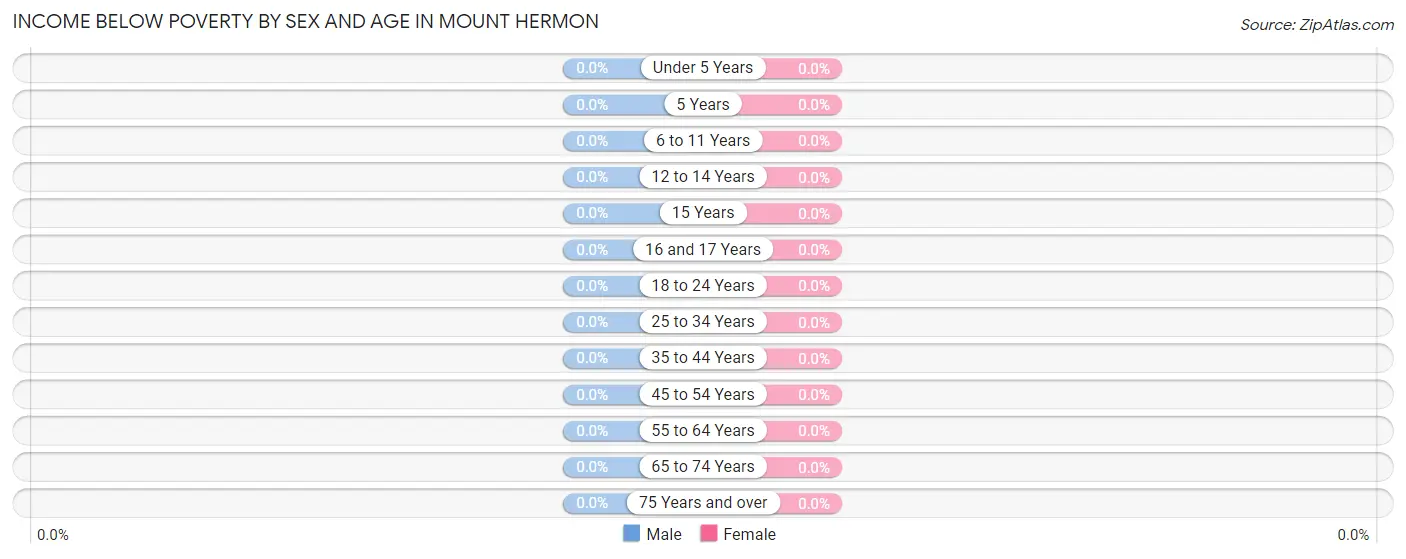
| Age Bracket | Male | Female |
| Under 5 Years | 0 (0.0%) | 0 (0.0%) |
| 5 Years | 0 (0.0%) | 0 (0.0%) |
| 6 to 11 Years | 0 (0.0%) | 0 (0.0%) |
| 12 to 14 Years | 0 (0.0%) | 0 (0.0%) |
| 15 Years | 0 (0.0%) | 0 (0.0%) |
| 16 and 17 Years | 0 (0.0%) | 0 (0.0%) |
| 18 to 24 Years | 0 (0.0%) | 0 (0.0%) |
| 25 to 34 Years | 0 (0.0%) | 0 (0.0%) |
| 35 to 44 Years | 0 (0.0%) | 0 (0.0%) |
| 45 to 54 Years | 0 (0.0%) | 0 (0.0%) |
| 55 to 64 Years | 0 (0.0%) | 0 (0.0%) |
| 65 to 74 Years | 0 (0.0%) | 0 (0.0%) |
| 75 Years and over | 0 (0.0%) | 0 (0.0%) |
| Total | 0 (0.0%) | 0 (0.0%) |
Income Above Poverty by Sex and Age in Mount Hermon
According to the poverty statistics in Mount Hermon, males aged under 5 years and females aged under 5 years are the age groups that are most secure financially, with 100.0% of males and 100.0% of females in these age groups living above the poverty line.
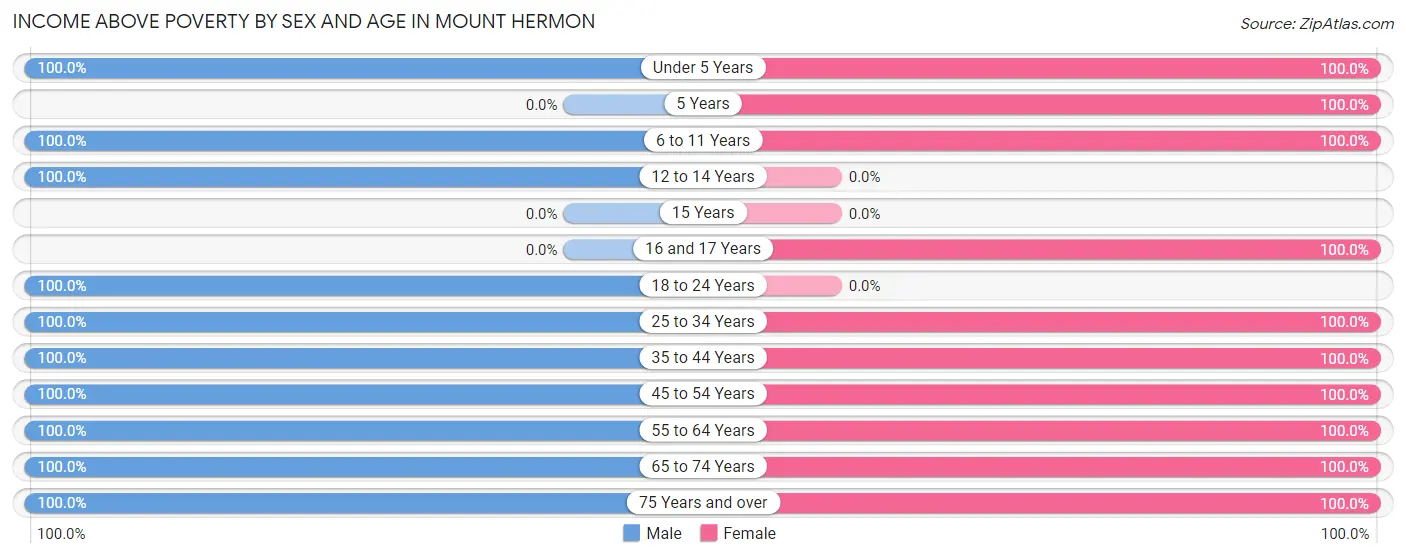
| Age Bracket | Male | Female |
| Under 5 Years | 5 (100.0%) | 4 (100.0%) |
| 5 Years | 0 (0.0%) | 2 (100.0%) |
| 6 to 11 Years | 8 (100.0%) | 17 (100.0%) |
| 12 to 14 Years | 4 (100.0%) | 0 (0.0%) |
| 15 Years | 0 (0.0%) | 0 (0.0%) |
| 16 and 17 Years | 0 (0.0%) | 4 (100.0%) |
| 18 to 24 Years | 16 (100.0%) | 0 (0.0%) |
| 25 to 34 Years | 24 (100.0%) | 4 (100.0%) |
| 35 to 44 Years | 6 (100.0%) | 16 (100.0%) |
| 45 to 54 Years | 15 (100.0%) | 18 (100.0%) |
| 55 to 64 Years | 27 (100.0%) | 8 (100.0%) |
| 65 to 74 Years | 9 (100.0%) | 5 (100.0%) |
| 75 Years and over | 19 (100.0%) | 19 (100.0%) |
| Total | 133 (100.0%) | 97 (100.0%) |
Income Below Poverty Among Married-Couple Families in Mount Hermon
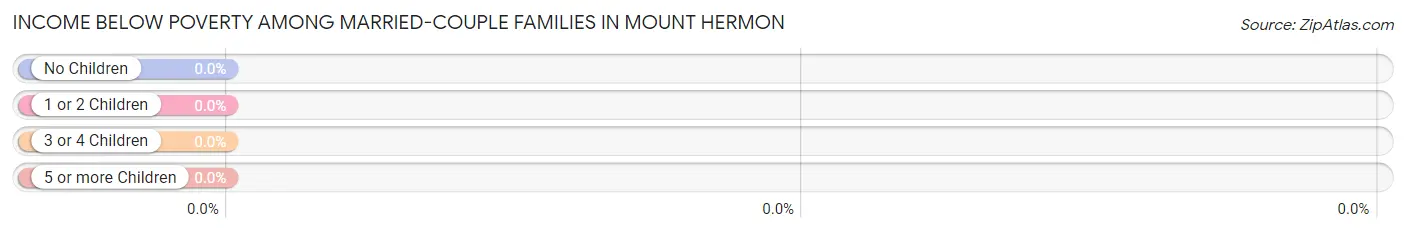
| Children | Above Poverty | Below Poverty |
| No Children | 37 (100.0%) | 0 (0.0%) |
| 1 or 2 Children | 17 (100.0%) | 0 (0.0%) |
| 3 or 4 Children | 5 (100.0%) | 0 (0.0%) |
| 5 or more Children | 0 (0.0%) | 0 (0.0%) |
| Total | 59 (100.0%) | 0 (0.0%) |
Income Below Poverty Among Single-Parent Households in Mount Hermon
| Children | Single Father | Single Mother |
| No Children | 0 (0.0%) | 0 (0.0%) |
| 1 or 2 Children | 0 (0.0%) | 0 (0.0%) |
| 3 or 4 Children | 0 (0.0%) | 0 (0.0%) |
| 5 or more Children | 0 (0.0%) | 0 (0.0%) |
| Total | 0 (0.0%) | 0 (0.0%) |
Income Below Poverty Among Married-Couple vs Single-Parent Households in Mount Hermon
| Children | Married-Couple Families | Single-Parent Households |
| No Children | 0 (0.0%) | 0 (0.0%) |
| 1 or 2 Children | 0 (0.0%) | 0 (0.0%) |
| 3 or 4 Children | 0 (0.0%) | 0 (0.0%) |
| 5 or more Children | 0 (0.0%) | 0 (0.0%) |
| Total | 0 (0.0%) | 0 (0.0%) |
Race in Mount Hermon
The most populous races in Mount Hermon are White / Caucasian (228 | 99.1%), Hispanic or Latino (32 | 13.9%), and Two or more Races (2 | 0.9%).
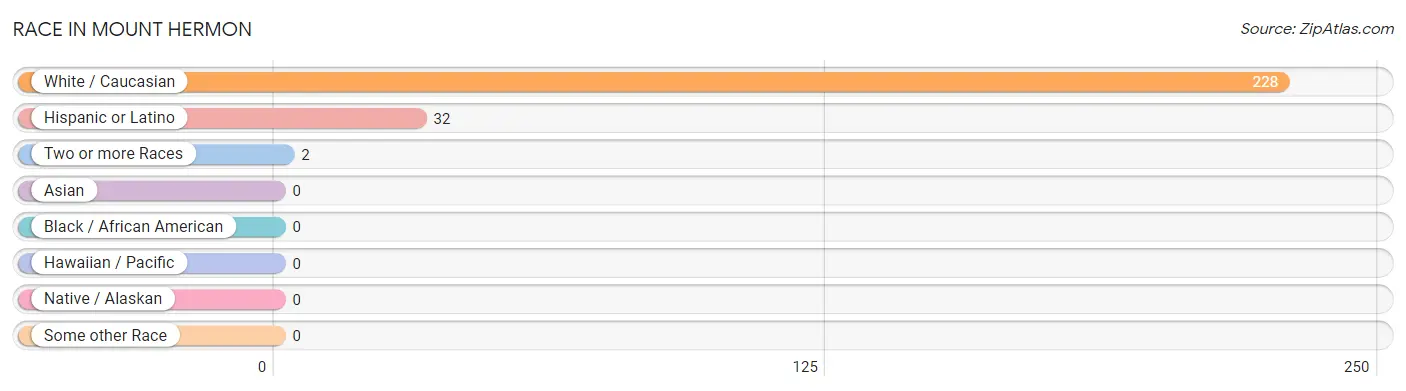
| Race | # Population | % Population |
| Asian | 0 | 0.0% |
| Black / African American | 0 | 0.0% |
| Hawaiian / Pacific | 0 | 0.0% |
| Hispanic or Latino | 32 | 13.9% |
| Native / Alaskan | 0 | 0.0% |
| White / Caucasian | 228 | 99.1% |
| Two or more Races | 2 | 0.9% |
| Some other Race | 0 | 0.0% |
| Total | 230 | 100.0% |
Ancestry in Mount Hermon
The most populous ancestries reported in Mount Hermon are German (87 | 37.8%), French (57 | 24.8%), Irish (49 | 21.3%), Italian (28 | 12.2%), and American (23 | 10.0%), together accounting for 106.1% of all Mount Hermon residents.
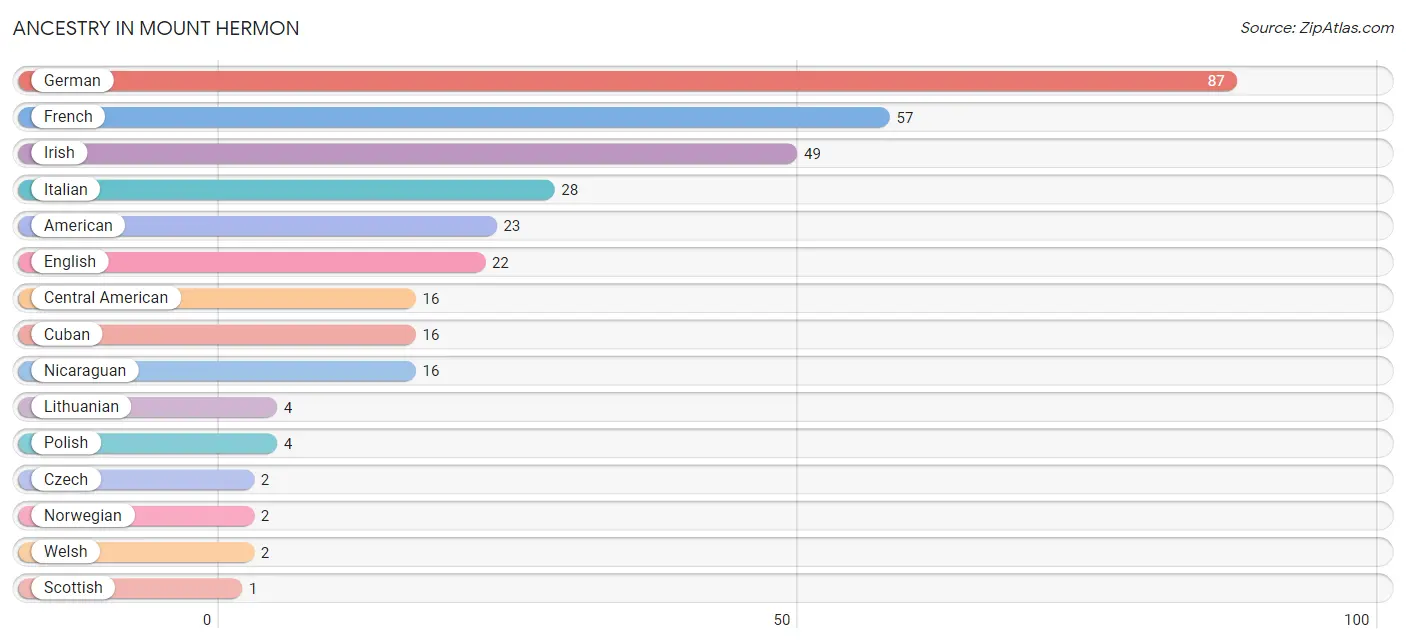
| Ancestry | # Population | % Population |
| American | 23 | 10.0% |
| Central American | 16 | 7.0% |
| Cuban | 16 | 7.0% |
| Czech | 2 | 0.9% |
| English | 22 | 9.6% |
| French | 57 | 24.8% |
| German | 87 | 37.8% |
| Irish | 49 | 21.3% |
| Italian | 28 | 12.2% |
| Lithuanian | 4 | 1.7% |
| Nicaraguan | 16 | 7.0% |
| Norwegian | 2 | 0.9% |
| Polish | 4 | 1.7% |
| Scottish | 1 | 0.4% |
| Welsh | 2 | 0.9% | View All 15 Rows |
Immigrants in Mount Hermon

| Immigration Origin | # Population | % Population | View All 0 Rows |
Sex and Age in Mount Hermon
Sex and Age in Mount Hermon
The most populous age groups in Mount Hermon are 55 to 59 Years (25 | 18.8%) for men and 5 to 9 Years (19 | 19.6%) for women.
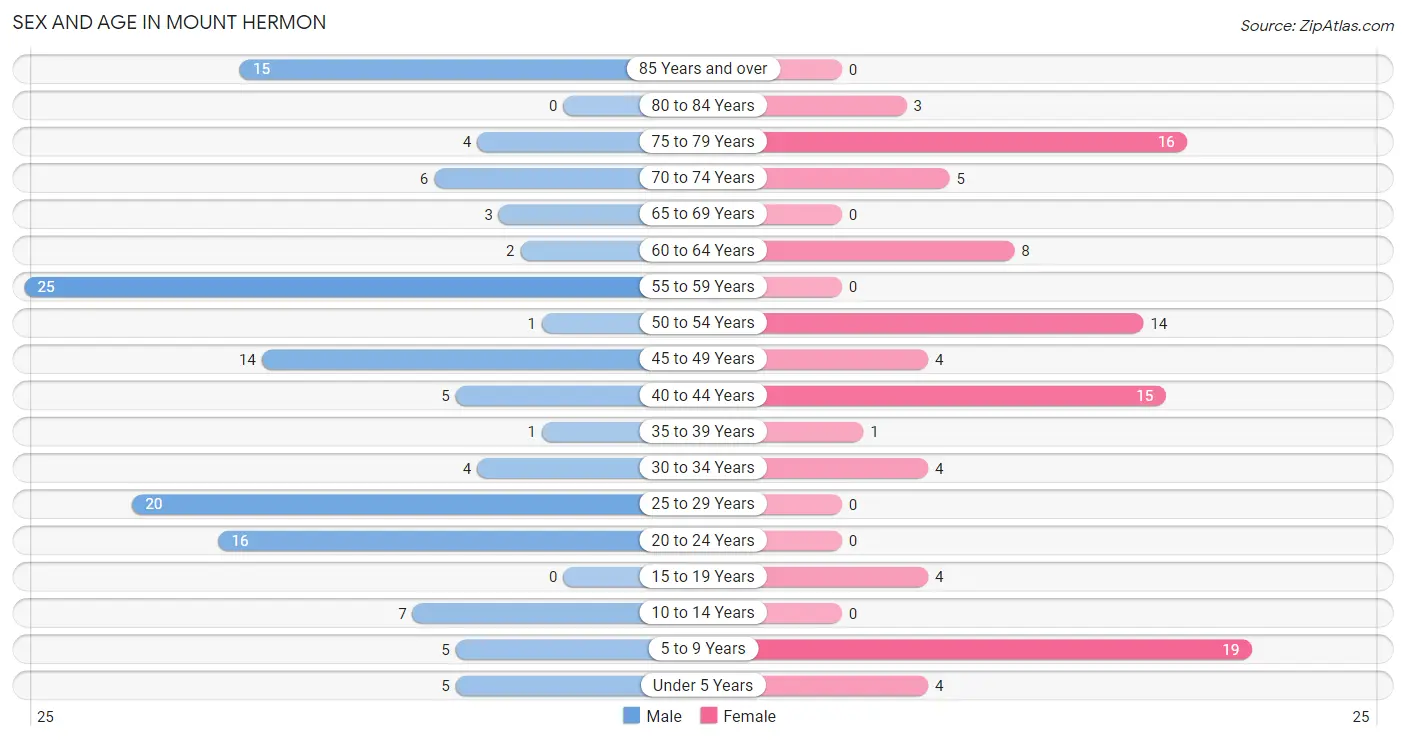
| Age Bracket | Male | Female |
| Under 5 Years | 5 (3.8%) | 4 (4.1%) |
| 5 to 9 Years | 5 (3.8%) | 19 (19.6%) |
| 10 to 14 Years | 7 (5.3%) | 0 (0.0%) |
| 15 to 19 Years | 0 (0.0%) | 4 (4.1%) |
| 20 to 24 Years | 16 (12.0%) | 0 (0.0%) |
| 25 to 29 Years | 20 (15.0%) | 0 (0.0%) |
| 30 to 34 Years | 4 (3.0%) | 4 (4.1%) |
| 35 to 39 Years | 1 (0.7%) | 1 (1.0%) |
| 40 to 44 Years | 5 (3.8%) | 15 (15.5%) |
| 45 to 49 Years | 14 (10.5%) | 4 (4.1%) |
| 50 to 54 Years | 1 (0.7%) | 14 (14.4%) |
| 55 to 59 Years | 25 (18.8%) | 0 (0.0%) |
| 60 to 64 Years | 2 (1.5%) | 8 (8.3%) |
| 65 to 69 Years | 3 (2.3%) | 0 (0.0%) |
| 70 to 74 Years | 6 (4.5%) | 5 (5.1%) |
| 75 to 79 Years | 4 (3.0%) | 16 (16.5%) |
| 80 to 84 Years | 0 (0.0%) | 3 (3.1%) |
| 85 Years and over | 15 (11.3%) | 0 (0.0%) |
| Total | 133 (100.0%) | 97 (100.0%) |
Families and Households in Mount Hermon
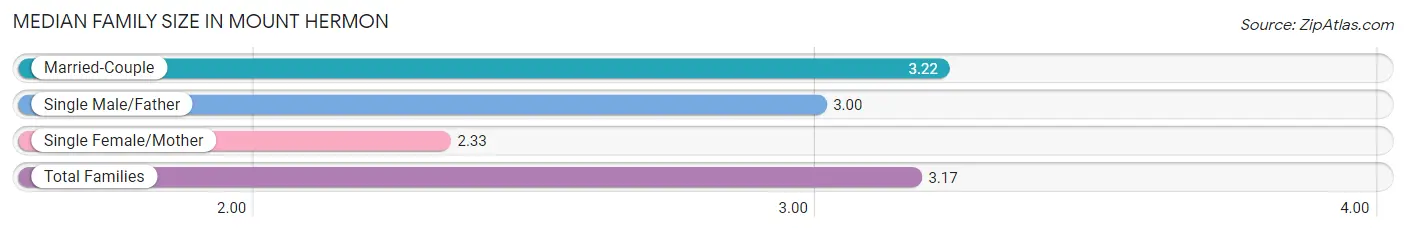
Median Family Size in Mount Hermon
The median family size in Mount Hermon is 3.17 persons per family, with married-couple families (59 | 89.4%) accounting for the largest median family size of 3.22 persons per family. On the other hand, single female/mother families (3 | 4.5%) represent the smallest median family size with 2.33 persons per family.
| Family Type | # Families | Family Size |
| Married-Couple | 59 (89.4%) | 3.22 |
| Single Male/Father | 4 (6.1%) | 3.00 |
| Single Female/Mother | 3 (4.5%) | 2.33 |
| Total Families | 66 (100.0%) | 3.17 |
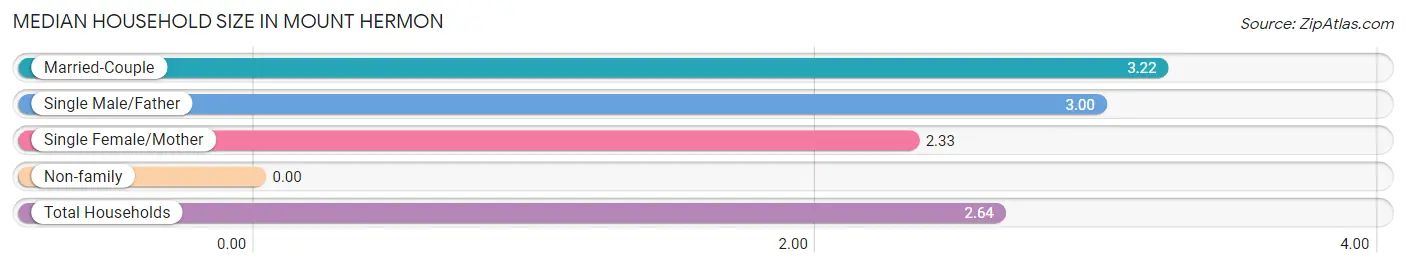
Median Household Size in Mount Hermon
| Household Type | # Households | Household Size |
| Married-Couple | 59 (67.8%) | 3.22 |
| Single Male/Father | 4 (4.6%) | 3.00 |
| Single Female/Mother | 3 (3.5%) | 2.33 |
| Non-family | 21 (24.1%) | - |
| Total Households | 87 (100.0%) | 2.64 |
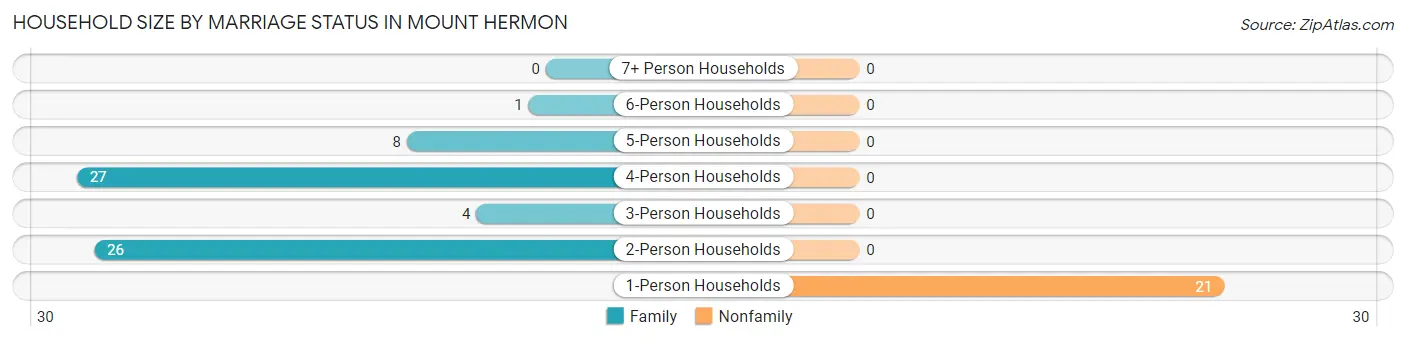
Household Size by Marriage Status in Mount Hermon
Out of a total of 87 households in Mount Hermon, 66 (75.9%) are family households, while 21 (24.1%) are nonfamily households. The most numerous type of family households are 4-person households, comprising 27, and the most common type of nonfamily households are 1-person households, comprising 21.
| Household Size | Family Households | Nonfamily Households |
| 1-Person Households | - | 21 (24.1%) |
| 2-Person Households | 26 (29.9%) | 0 (0.0%) |
| 3-Person Households | 4 (4.6%) | 0 (0.0%) |
| 4-Person Households | 27 (31.0%) | 0 (0.0%) |
| 5-Person Households | 8 (9.2%) | 0 (0.0%) |
| 6-Person Households | 1 (1.1%) | 0 (0.0%) |
| 7+ Person Households | 0 (0.0%) | 0 (0.0%) |
| Total | 66 (75.9%) | 21 (24.1%) |
Female Fertility in Mount Hermon
Fertility by Age in Mount Hermon
Average fertility rate in Mount Hermon is 95.0 births per 1,000 women. Women in the age bracket of 20 to 34 years have the highest fertility rate with 1,000.0 births per 1,000 women. Women in the age bracket of 20 to 34 years acount for 100.0% of all women with births.
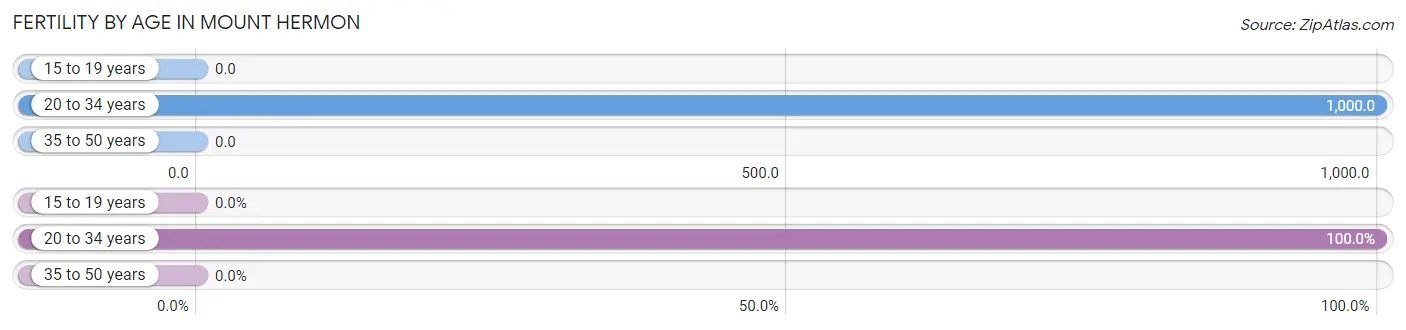
| Age Bracket | Women with Births | Births / 1,000 Women |
| 15 to 19 years | 0 (0.0%) | 0.0 |
| 20 to 34 years | 4 (100.0%) | 1,000.0 |
| 35 to 50 years | 0 (0.0%) | 0.0 |
| Total | 4 (100.0%) | 95.0 |
Fertility by Age by Marriage Status in Mount Hermon
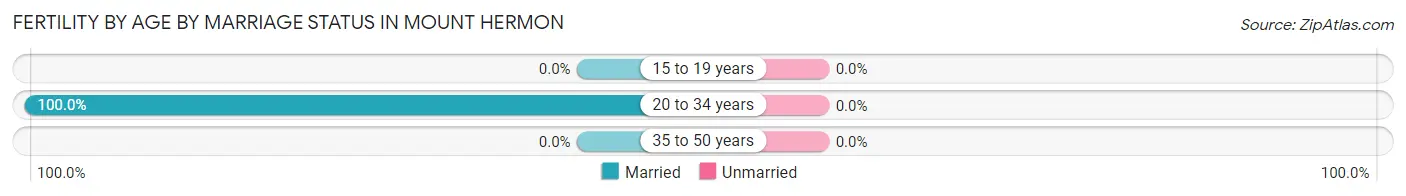
| Age Bracket | Married | Unmarried |
| 15 to 19 years | 0 (0.0%) | 0 (0.0%) |
| 20 to 34 years | 4 (100.0%) | 0 (0.0%) |
| 35 to 50 years | 0 (0.0%) | 0 (0.0%) |
| Total | 4 (100.0%) | 0 (0.0%) |
Fertility by Education in Mount Hermon
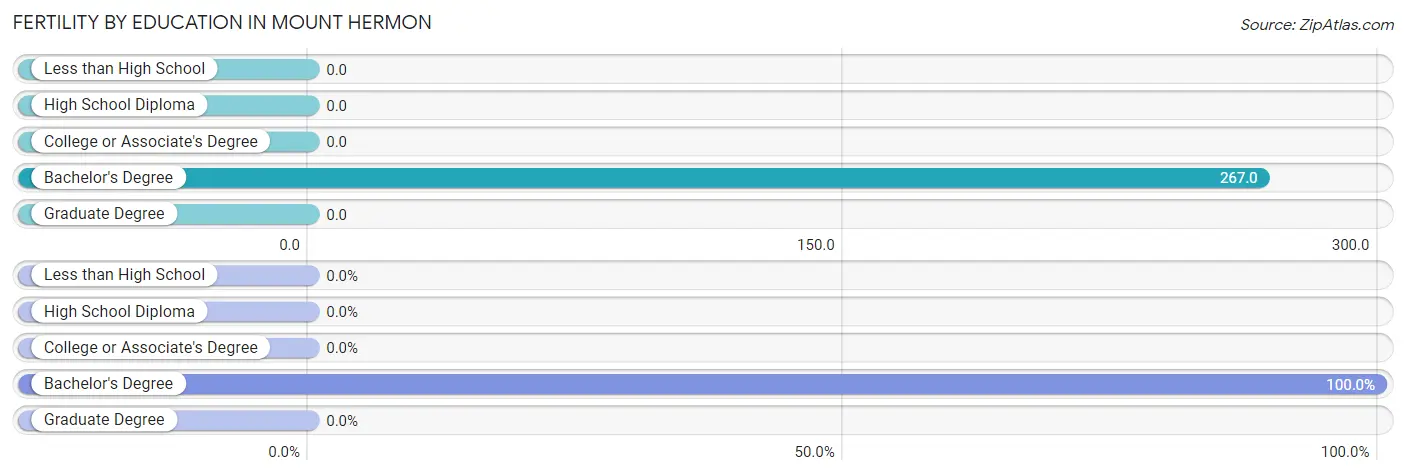
| Educational Attainment | Women with Births | Births / 1,000 Women |
| Less than High School | 0 (0.0%) | 0.0 |
| High School Diploma | 0 (0.0%) | 0.0 |
| College or Associate's Degree | 0 (0.0%) | 0.0 |
| Bachelor's Degree | 4 (100.0%) | 267.0 |
| Graduate Degree | 0 (0.0%) | 0.0 |
| Total | 4 (100.0%) | 95.0 |
Fertility by Education by Marriage Status in Mount Hermon
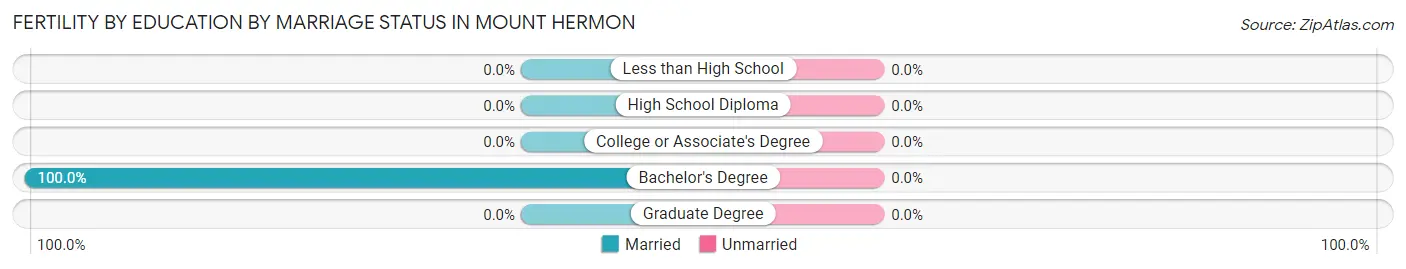
| Educational Attainment | Married | Unmarried |
| Less than High School | 0 (0.0%) | 0 (0.0%) |
| High School Diploma | 0 (0.0%) | 0 (0.0%) |
| College or Associate's Degree | 0 (0.0%) | 0 (0.0%) |
| Bachelor's Degree | 4 (100.0%) | 0 (0.0%) |
| Graduate Degree | 0 (0.0%) | 0 (0.0%) |
| Total | 4 (100.0%) | 0 (0.0%) |
Employment Characteristics in Mount Hermon
Employment by Class of Employer in Mount Hermon
Among the 119 employed individuals in Mount Hermon, private company employees (99 | 83.2%), local government employees (8 | 6.7%), and not-for-profit organizations (5 | 4.2%) make up the most common classes of employment.
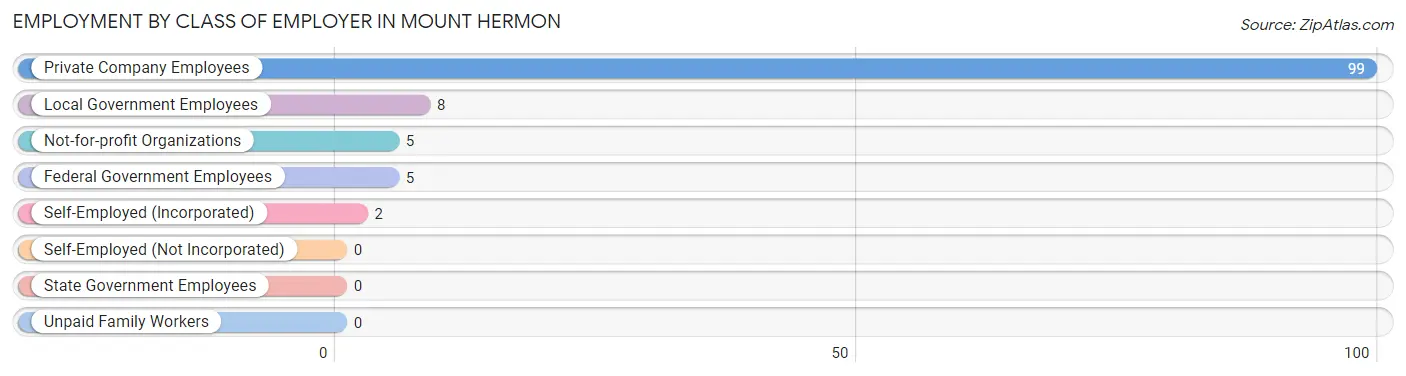
| Employer Class | # Employees | % Employees |
| Private Company Employees | 99 | 83.2% |
| Self-Employed (Incorporated) | 2 | 1.7% |
| Self-Employed (Not Incorporated) | 0 | 0.0% |
| Not-for-profit Organizations | 5 | 4.2% |
| Local Government Employees | 8 | 6.7% |
| State Government Employees | 0 | 0.0% |
| Federal Government Employees | 5 | 4.2% |
| Unpaid Family Workers | 0 | 0.0% |
| Total | 119 | 100.0% |
Employment Status by Age in Mount Hermon
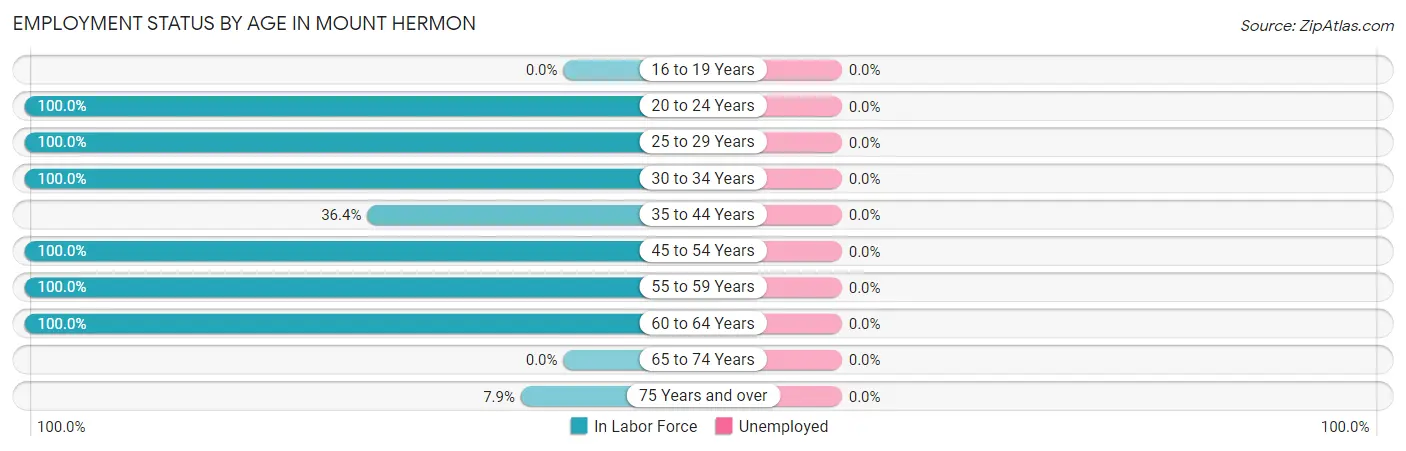
| Age Bracket | In Labor Force | Unemployed |
| 16 to 19 Years | 0 (0.0%) | 0 (0.0%) |
| 20 to 24 Years | 16 (100.0%) | 0 (0.0%) |
| 25 to 29 Years | 20 (100.0%) | 0 (0.0%) |
| 30 to 34 Years | 8 (100.0%) | 0 (0.0%) |
| 35 to 44 Years | 8 (36.4%) | 0 (0.0%) |
| 45 to 54 Years | 33 (100.0%) | 0 (0.0%) |
| 55 to 59 Years | 25 (100.0%) | 0 (0.0%) |
| 60 to 64 Years | 10 (100.0%) | 0 (0.0%) |
| 65 to 74 Years | 0 (0.0%) | 0 (0.0%) |
| 75 Years and over | 3 (7.9%) | 0 (0.0%) |
| Total | 123 (64.7%) | 0 (0.0%) |
Employment Status by Educational Attainment in Mount Hermon
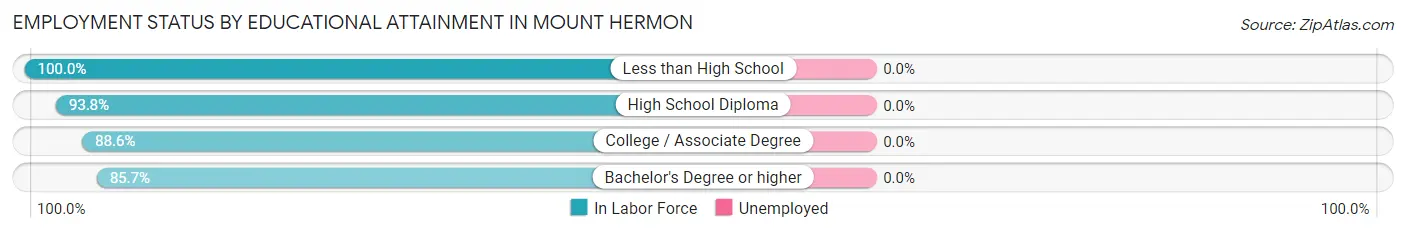
| Educational Attainment | In Labor Force | Unemployed |
| Less than High School | 4 (100.0%) | 0 (0.0%) |
| High School Diploma | 15 (93.8%) | 0 (0.0%) |
| College / Associate Degree | 31 (88.6%) | 0 (0.0%) |
| Bachelor's Degree or higher | 54 (85.7%) | 0 (0.0%) |
| Total | 104 (88.1%) | 0 (0.0%) |
Employment Occupations by Sex in Mount Hermon
Management, Business, Science and Arts Occupations
The most common Management, Business, Science and Arts occupations in Mount Hermon are Management (14 | 11.5%), Business & Financial (13 | 10.7%), Community & Social Service (6 | 4.9%), Education Instruction & Library (4 | 3.3%), and Health Diagnosing & Treating (3 | 2.5%).
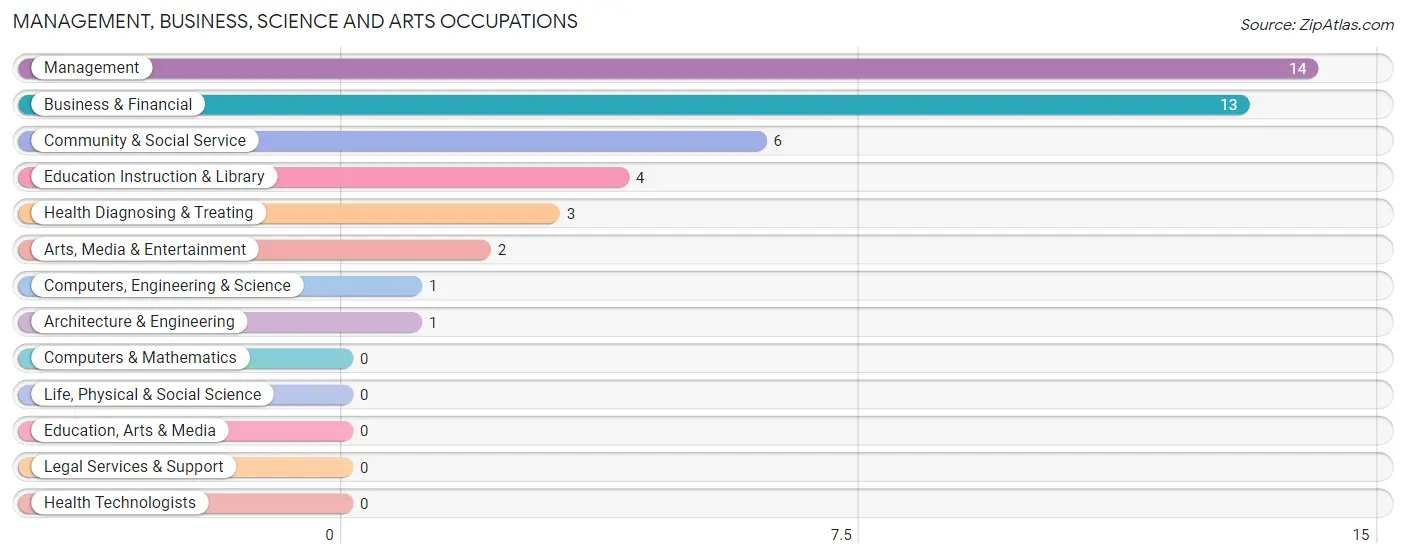
Management, Business, Science and Arts Occupations by Sex
Within the Management, Business, Science and Arts occupations in Mount Hermon, the most male-oriented occupations are Computers, Engineering & Science (100.0%), Architecture & Engineering (100.0%), and Arts, Media & Entertainment (100.0%), while the most female-oriented occupations are Management (100.0%), Education Instruction & Library (100.0%), and Health Diagnosing & Treating (100.0%).
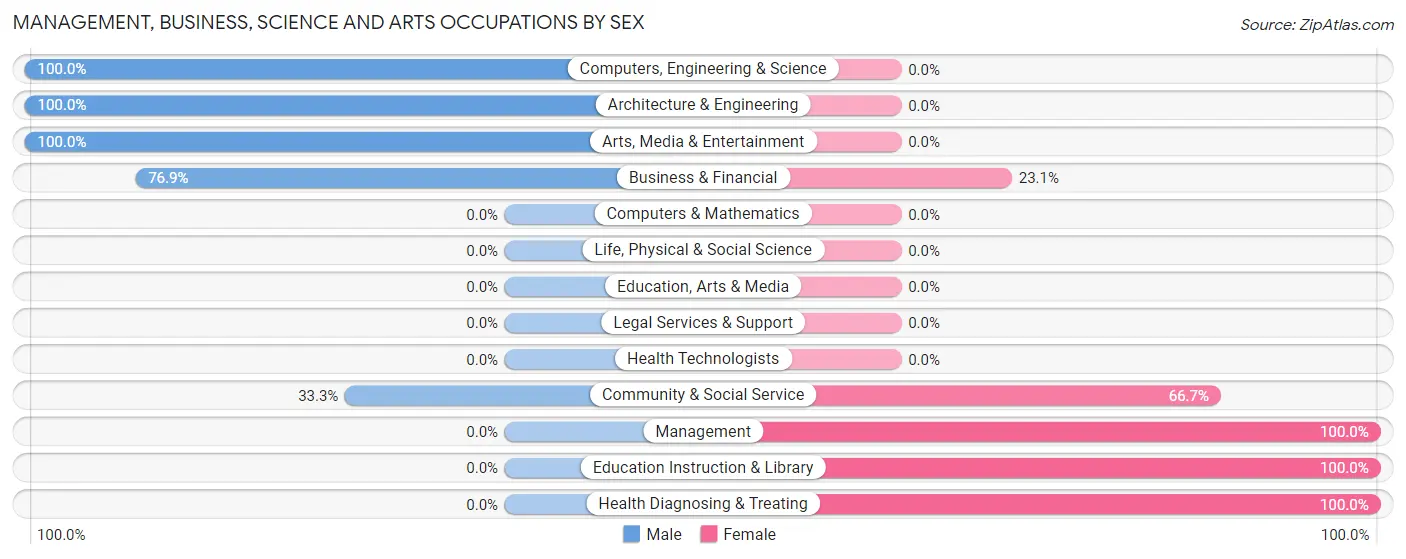
| Occupation | Male | Female |
| Management | 0 (0.0%) | 14 (100.0%) |
| Business & Financial | 10 (76.9%) | 3 (23.1%) |
| Computers, Engineering & Science | 1 (100.0%) | 0 (0.0%) |
| Computers & Mathematics | 0 (0.0%) | 0 (0.0%) |
| Architecture & Engineering | 1 (100.0%) | 0 (0.0%) |
| Life, Physical & Social Science | 0 (0.0%) | 0 (0.0%) |
| Community & Social Service | 2 (33.3%) | 4 (66.7%) |
| Education, Arts & Media | 0 (0.0%) | 0 (0.0%) |
| Legal Services & Support | 0 (0.0%) | 0 (0.0%) |
| Education Instruction & Library | 0 (0.0%) | 4 (100.0%) |
| Arts, Media & Entertainment | 2 (100.0%) | 0 (0.0%) |
| Health Diagnosing & Treating | 0 (0.0%) | 3 (100.0%) |
| Health Technologists | 0 (0.0%) | 0 (0.0%) |
| Total (Category) | 13 (35.1%) | 24 (64.9%) |
| Total (Overall) | 87 (71.3%) | 35 (28.7%) |
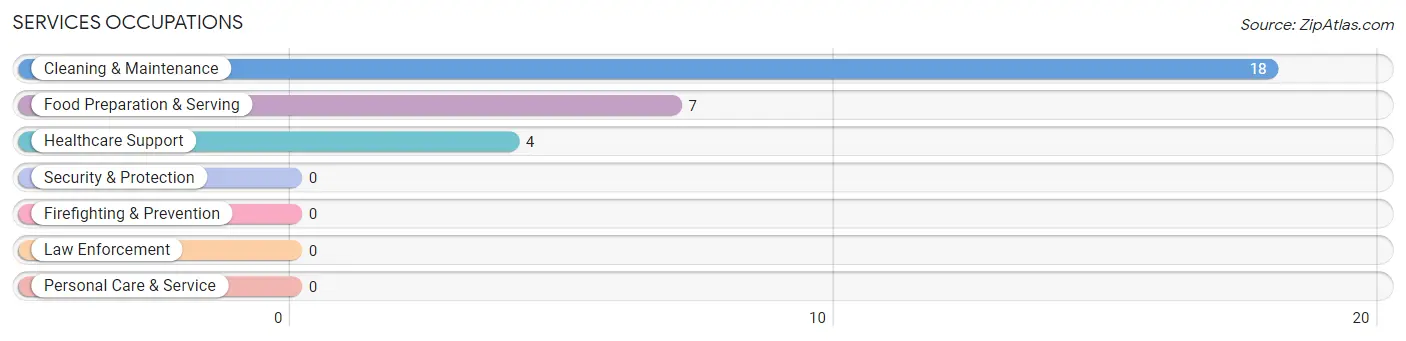
Services Occupations
The most common Services occupations in Mount Hermon are Cleaning & Maintenance (18 | 14.7%), Food Preparation & Serving (7 | 5.7%), and Healthcare Support (4 | 3.3%).
Services Occupations by Sex
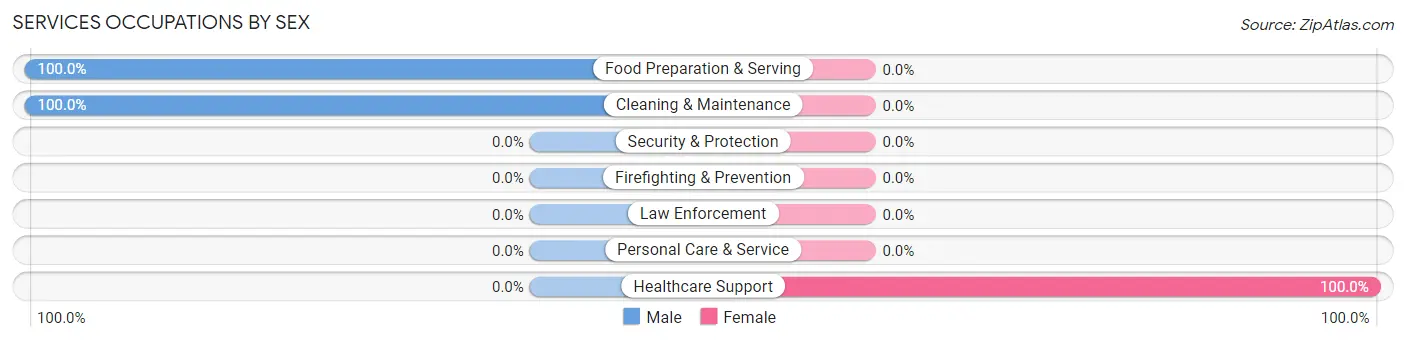
| Occupation | Male | Female |
| Healthcare Support | 0 (0.0%) | 4 (100.0%) |
| Security & Protection | 0 (0.0%) | 0 (0.0%) |
| Firefighting & Prevention | 0 (0.0%) | 0 (0.0%) |
| Law Enforcement | 0 (0.0%) | 0 (0.0%) |
| Food Preparation & Serving | 7 (100.0%) | 0 (0.0%) |
| Cleaning & Maintenance | 18 (100.0%) | 0 (0.0%) |
| Personal Care & Service | 0 (0.0%) | 0 (0.0%) |
| Total (Category) | 25 (86.2%) | 4 (13.8%) |
| Total (Overall) | 87 (71.3%) | 35 (28.7%) |
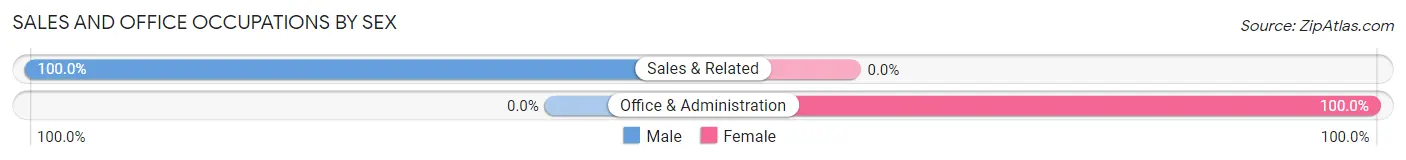
Sales and Office Occupations
The most common Sales and Office occupations in Mount Hermon are Sales & Related (29 | 23.8%), and Office & Administration (7 | 5.7%).
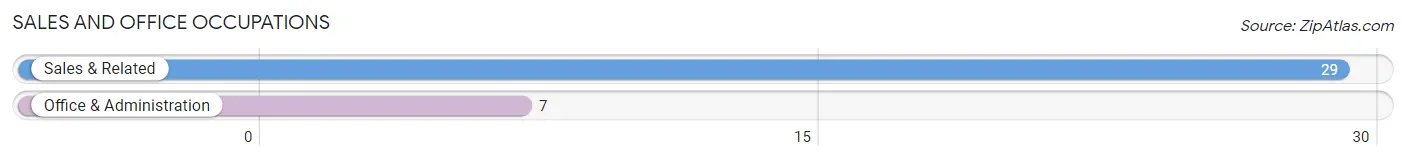
Sales and Office Occupations by Sex
| Occupation | Male | Female |
| Sales & Related | 29 (100.0%) | 0 (0.0%) |
| Office & Administration | 0 (0.0%) | 7 (100.0%) |
| Total (Category) | 29 (80.6%) | 7 (19.4%) |
| Total (Overall) | 87 (71.3%) | 35 (28.7%) |
Natural Resources, Construction and Maintenance Occupations
The most common Natural Resources, Construction and Maintenance occupations in Mount Hermon are , and Construction & Extraction (5 | 4.1%).
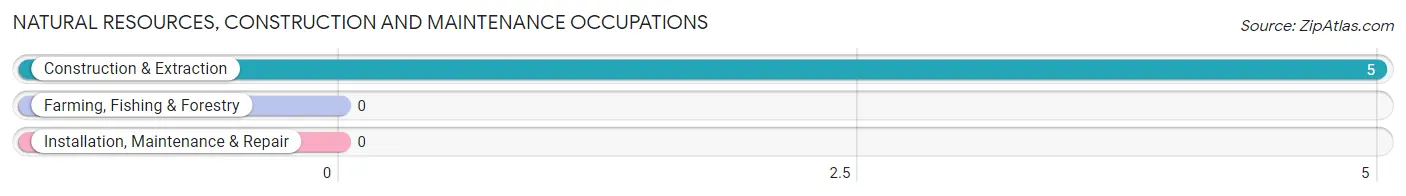
Natural Resources, Construction and Maintenance Occupations by Sex
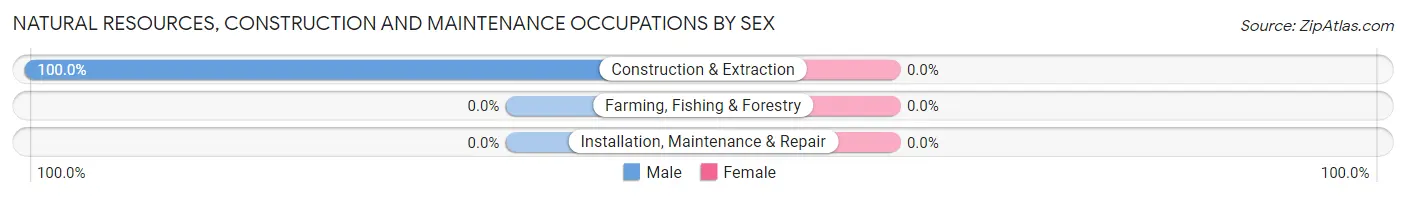
| Occupation | Male | Female |
| Farming, Fishing & Forestry | 0 (0.0%) | 0 (0.0%) |
| Construction & Extraction | 5 (100.0%) | 0 (0.0%) |
| Installation, Maintenance & Repair | 0 (0.0%) | 0 (0.0%) |
| Total (Category) | 5 (100.0%) | 0 (0.0%) |
| Total (Overall) | 87 (71.3%) | 35 (28.7%) |
Production, Transportation and Moving Occupations
The most common Production, Transportation and Moving occupations in Mount Hermon are Material Moving (11 | 9.0%), and Transportation (4 | 3.3%).
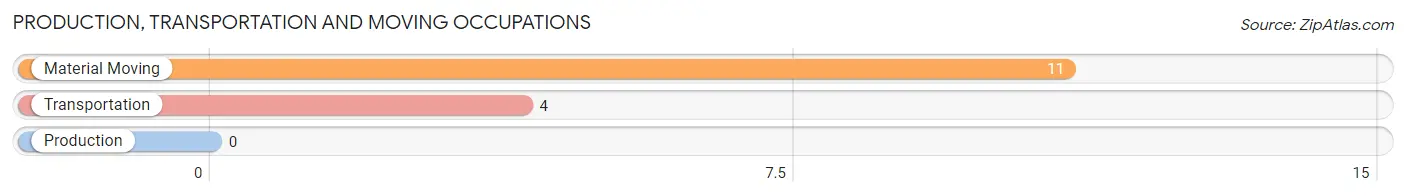
Production, Transportation and Moving Occupations by Sex
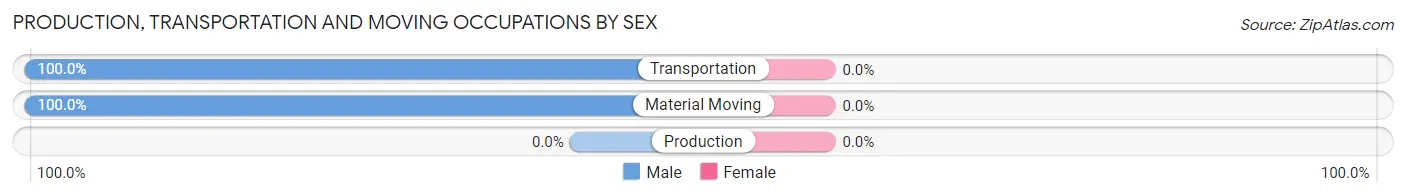
| Occupation | Male | Female |
| Production | 0 (0.0%) | 0 (0.0%) |
| Transportation | 4 (100.0%) | 0 (0.0%) |
| Material Moving | 11 (100.0%) | 0 (0.0%) |
| Total (Category) | 15 (100.0%) | 0 (0.0%) |
| Total (Overall) | 87 (71.3%) | 35 (28.7%) |
Employment Industries by Sex in Mount Hermon
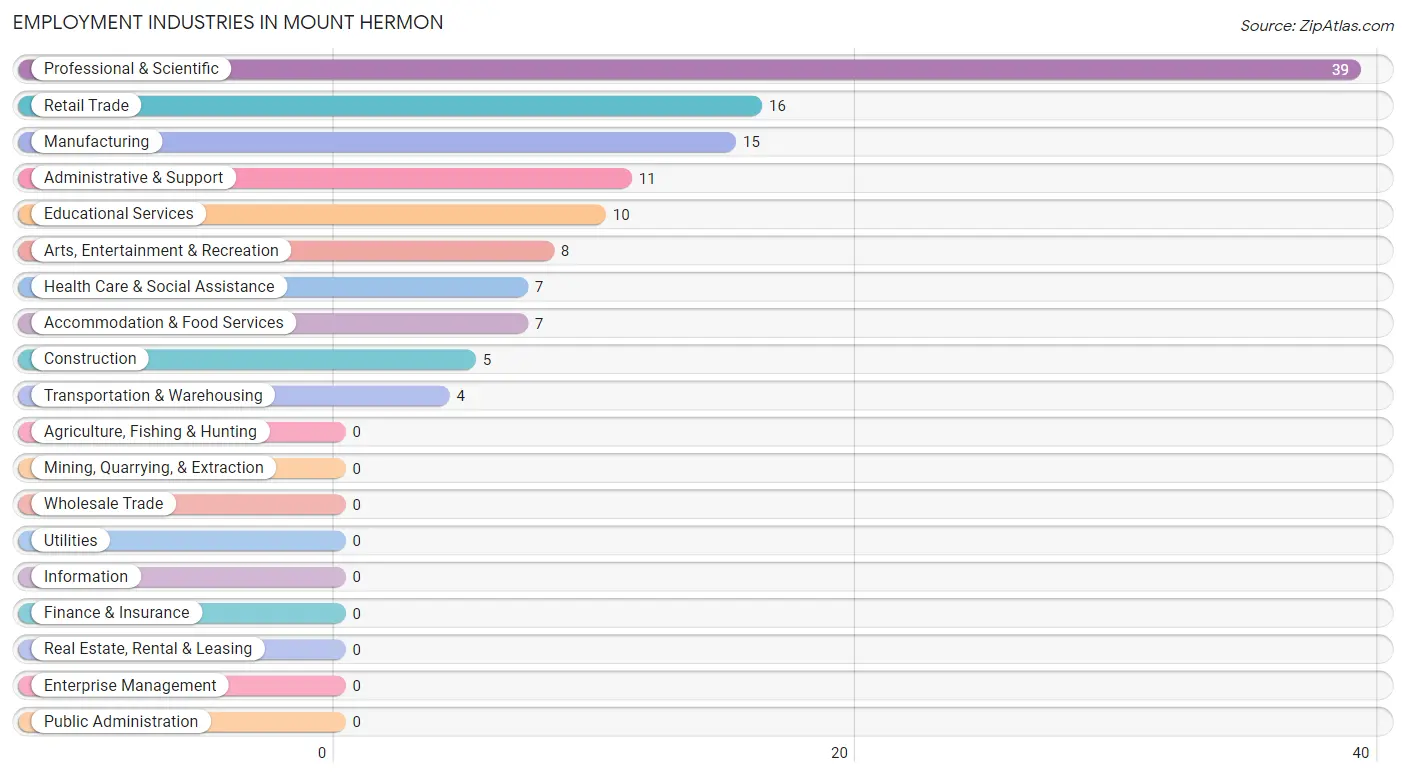
Employment Industries in Mount Hermon
The major employment industries in Mount Hermon include Professional & Scientific (39 | 32.0%), Retail Trade (16 | 13.1%), Manufacturing (15 | 12.3%), Administrative & Support (11 | 9.0%), and Educational Services (10 | 8.2%).
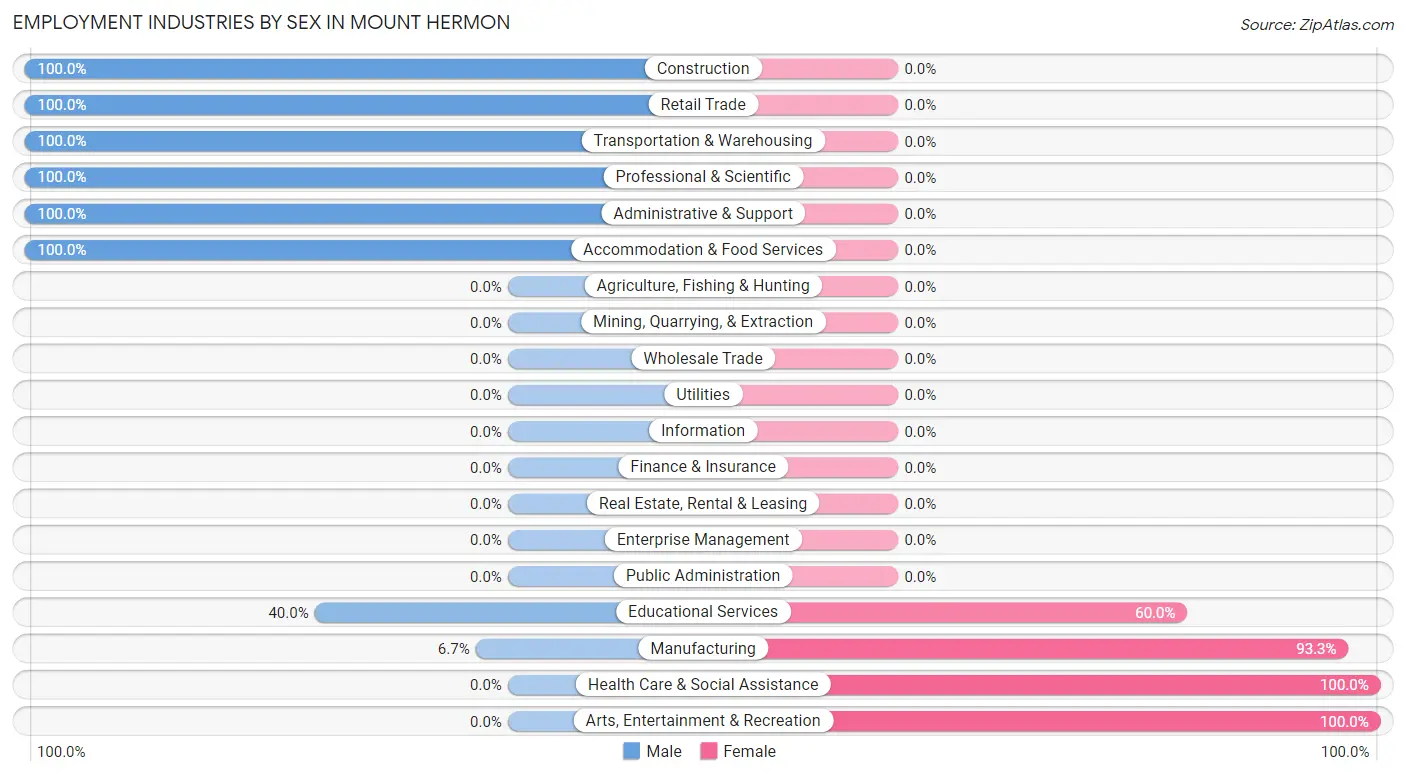
Employment Industries by Sex in Mount Hermon
The Mount Hermon industries that see more men than women are Construction (100.0%), Retail Trade (100.0%), and Transportation & Warehousing (100.0%), whereas the industries that tend to have a higher number of women are Health Care & Social Assistance (100.0%), Arts, Entertainment & Recreation (100.0%), and Manufacturing (93.3%).
| Industry | Male | Female |
| Agriculture, Fishing & Hunting | 0 (0.0%) | 0 (0.0%) |
| Mining, Quarrying, & Extraction | 0 (0.0%) | 0 (0.0%) |
| Construction | 5 (100.0%) | 0 (0.0%) |
| Manufacturing | 1 (6.7%) | 14 (93.3%) |
| Wholesale Trade | 0 (0.0%) | 0 (0.0%) |
| Retail Trade | 16 (100.0%) | 0 (0.0%) |
| Transportation & Warehousing | 4 (100.0%) | 0 (0.0%) |
| Utilities | 0 (0.0%) | 0 (0.0%) |
| Information | 0 (0.0%) | 0 (0.0%) |
| Finance & Insurance | 0 (0.0%) | 0 (0.0%) |
| Real Estate, Rental & Leasing | 0 (0.0%) | 0 (0.0%) |
| Professional & Scientific | 39 (100.0%) | 0 (0.0%) |
| Enterprise Management | 0 (0.0%) | 0 (0.0%) |
| Administrative & Support | 11 (100.0%) | 0 (0.0%) |
| Educational Services | 4 (40.0%) | 6 (60.0%) |
| Health Care & Social Assistance | 0 (0.0%) | 7 (100.0%) |
| Arts, Entertainment & Recreation | 0 (0.0%) | 8 (100.0%) |
| Accommodation & Food Services | 7 (100.0%) | 0 (0.0%) |
| Public Administration | 0 (0.0%) | 0 (0.0%) |
| Total | 87 (71.3%) | 35 (28.7%) |
Education in Mount Hermon
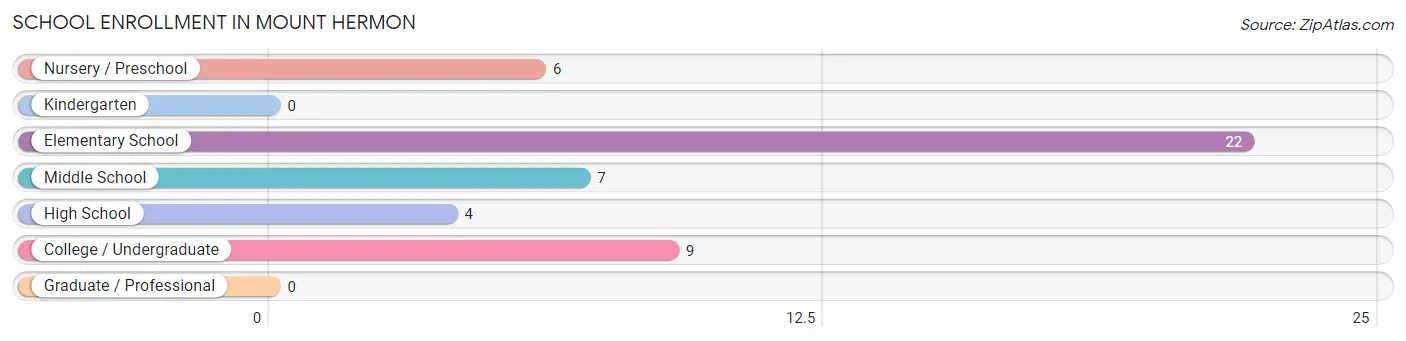
School Enrollment in Mount Hermon
The most common levels of schooling among the 48 students in Mount Hermon are elementary school (22 | 45.8%), college / undergraduate (9 | 18.8%), and middle school (7 | 14.6%).
| School Level | # Students | % Students |
| Nursery / Preschool | 6 | 12.5% |
| Kindergarten | 0 | 0.0% |
| Elementary School | 22 | 45.8% |
| Middle School | 7 | 14.6% |
| High School | 4 | 8.3% |
| College / Undergraduate | 9 | 18.8% |
| Graduate / Professional | 0 | 0.0% |
| Total | 48 | 100.0% |
School Enrollment by Age by Funding Source in Mount Hermon
Out of a total of 48 students who are enrolled in schools in Mount Hermon, 2 (4.2%) attend a private institution, while the remaining 46 (95.8%) are enrolled in public schools. The age group of 35 years and over has the highest likelihood of being enrolled in private schools, with 2 (100.0% in the age bracket) enrolled. Conversely, the age group of 3 to 4 year olds has the lowest likelihood of being enrolled in a private school, with 4 (100.0% in the age bracket) attending a public institution.
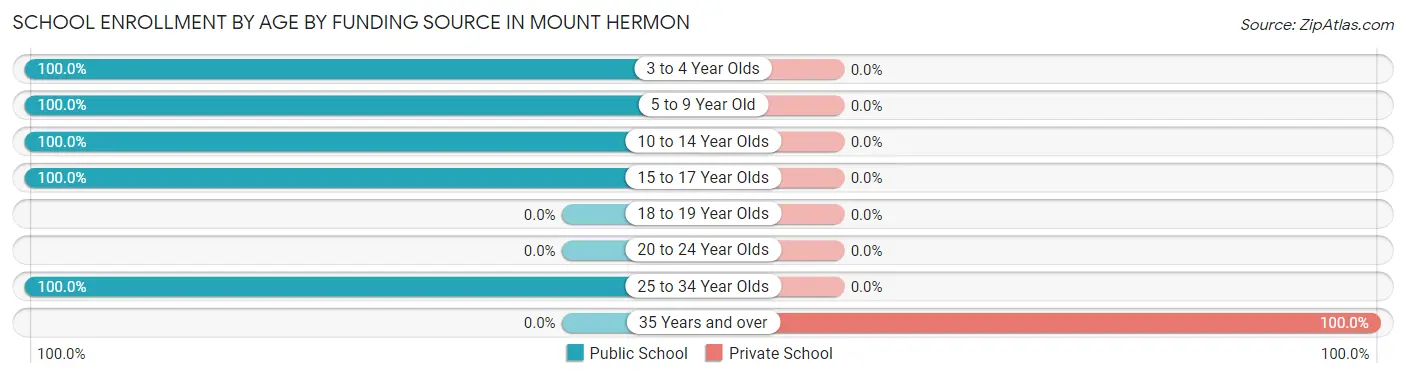
| Age Bracket | Public School | Private School |
| 3 to 4 Year Olds | 4 (100.0%) | 0 (0.0%) |
| 5 to 9 Year Old | 24 (100.0%) | 0 (0.0%) |
| 10 to 14 Year Olds | 7 (100.0%) | 0 (0.0%) |
| 15 to 17 Year Olds | 4 (100.0%) | 0 (0.0%) |
| 18 to 19 Year Olds | 0 (0.0%) | 0 (0.0%) |
| 20 to 24 Year Olds | 0 (0.0%) | 0 (0.0%) |
| 25 to 34 Year Olds | 7 (100.0%) | 0 (0.0%) |
| 35 Years and over | 0 (0.0%) | 2 (100.0%) |
| Total | 46 (95.8%) | 2 (4.2%) |
Educational Attainment by Field of Study in Mount Hermon
Social sciences (17 | 23.3%), arts & humanities (17 | 23.3%), education (15 | 20.5%), bio, nature & agricultural (8 | 11.0%), and physical & health sciences (7 | 9.6%) are the most common fields of study among 73 individuals in Mount Hermon who have obtained a bachelor's degree or higher.
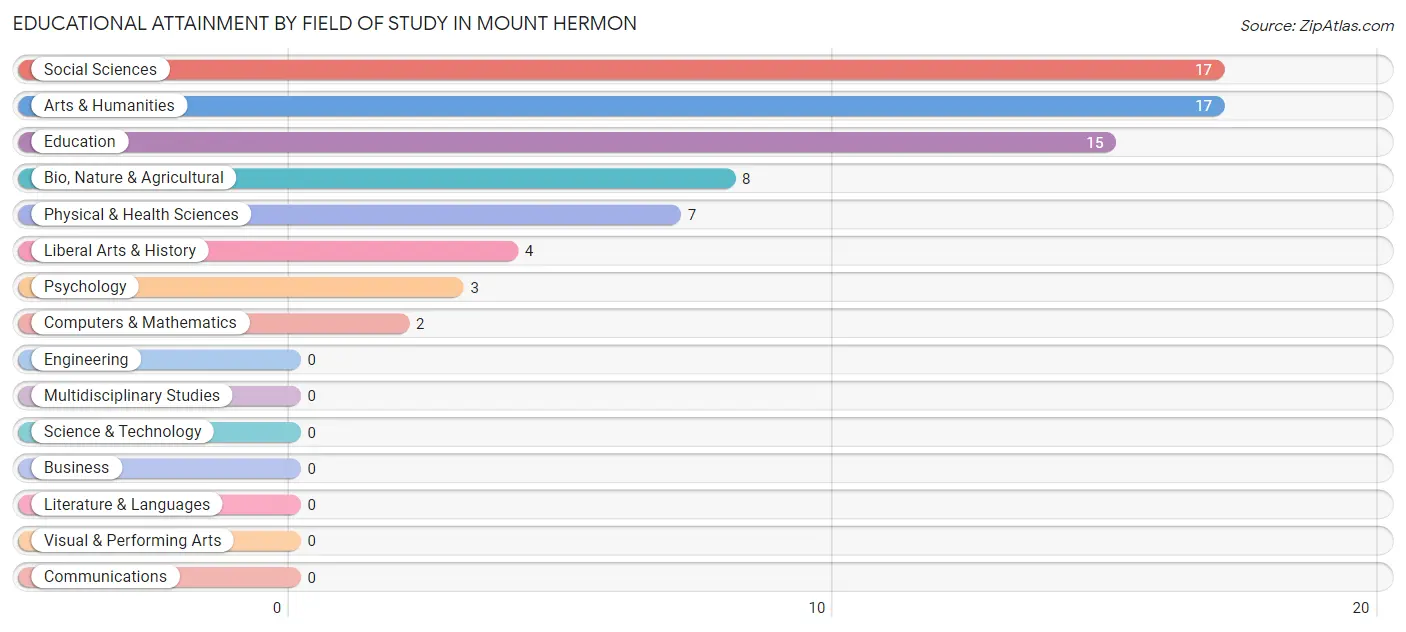
| Field of Study | # Graduates | % Graduates |
| Computers & Mathematics | 2 | 2.7% |
| Bio, Nature & Agricultural | 8 | 11.0% |
| Physical & Health Sciences | 7 | 9.6% |
| Psychology | 3 | 4.1% |
| Social Sciences | 17 | 23.3% |
| Engineering | 0 | 0.0% |
| Multidisciplinary Studies | 0 | 0.0% |
| Science & Technology | 0 | 0.0% |
| Business | 0 | 0.0% |
| Education | 15 | 20.5% |
| Literature & Languages | 0 | 0.0% |
| Liberal Arts & History | 4 | 5.5% |
| Visual & Performing Arts | 0 | 0.0% |
| Communications | 0 | 0.0% |
| Arts & Humanities | 17 | 23.3% |
| Total | 73 | 100.0% |
Transportation & Commute in Mount Hermon
Vehicle Availability by Sex in Mount Hermon
The most prevalent vehicle ownership categories in Mount Hermon are males with 4 vehicles (43, accounting for 49.4%) and females with 4 vehicles (14, making up 134.4%).
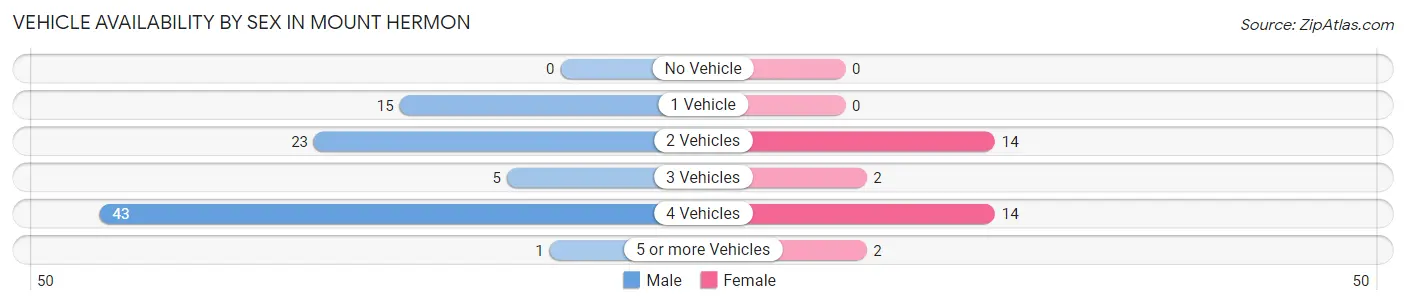
| Vehicles Available | Male | Female |
| No Vehicle | 0 (0.0%) | 0 (0.0%) |
| 1 Vehicle | 15 (17.2%) | 0 (0.0%) |
| 2 Vehicles | 23 (26.4%) | 14 (43.8%) |
| 3 Vehicles | 5 (5.8%) | 2 (6.2%) |
| 4 Vehicles | 43 (49.4%) | 14 (43.8%) |
| 5 or more Vehicles | 1 (1.1%) | 2 (6.2%) |
| Total | 87 (100.0%) | 32 (100.0%) |
Commute Time in Mount Hermon
The most frequently occuring commute durations in Mount Hermon are 60 to 89 minutes (32 commuters, 27.6%), 25 to 29 minutes (27 commuters, 23.3%), and 40 to 44 minutes (25 commuters, 21.5%).
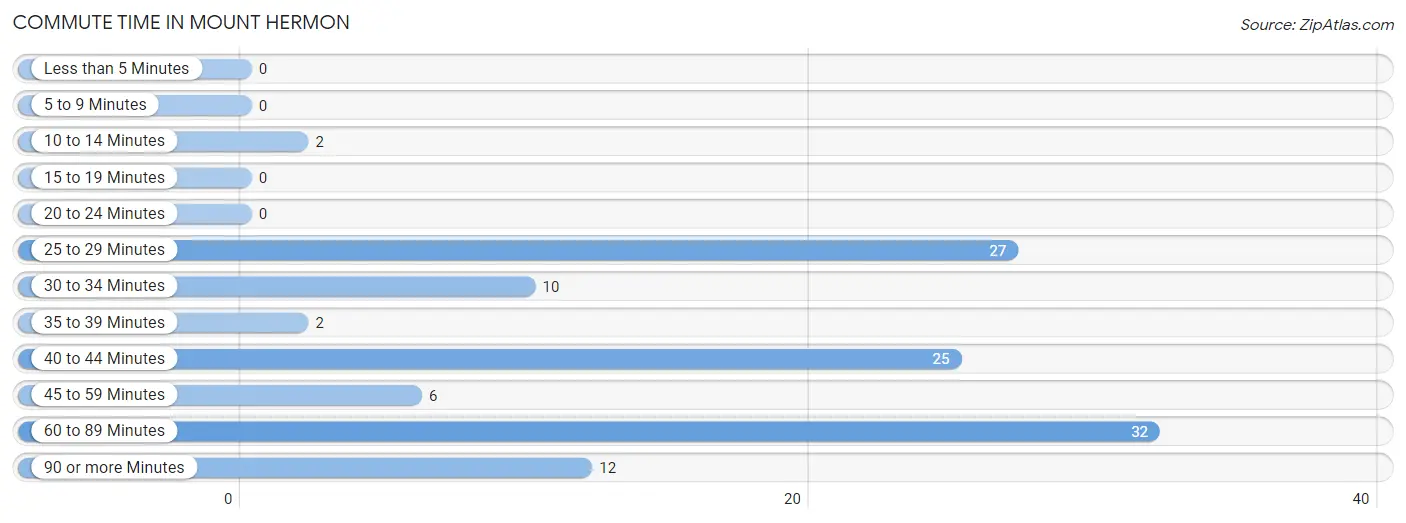
| Commute Time | # Commuters | % Commuters |
| Less than 5 Minutes | 0 | 0.0% |
| 5 to 9 Minutes | 0 | 0.0% |
| 10 to 14 Minutes | 2 | 1.7% |
| 15 to 19 Minutes | 0 | 0.0% |
| 20 to 24 Minutes | 0 | 0.0% |
| 25 to 29 Minutes | 27 | 23.3% |
| 30 to 34 Minutes | 10 | 8.6% |
| 35 to 39 Minutes | 2 | 1.7% |
| 40 to 44 Minutes | 25 | 21.5% |
| 45 to 59 Minutes | 6 | 5.2% |
| 60 to 89 Minutes | 32 | 27.6% |
| 90 or more Minutes | 12 | 10.3% |
Commute Time by Sex in Mount Hermon
The most common commute times in Mount Hermon are 25 to 29 minutes (27 commuters, 32.1%) for males and 60 to 89 minutes (14 commuters, 43.8%) for females.
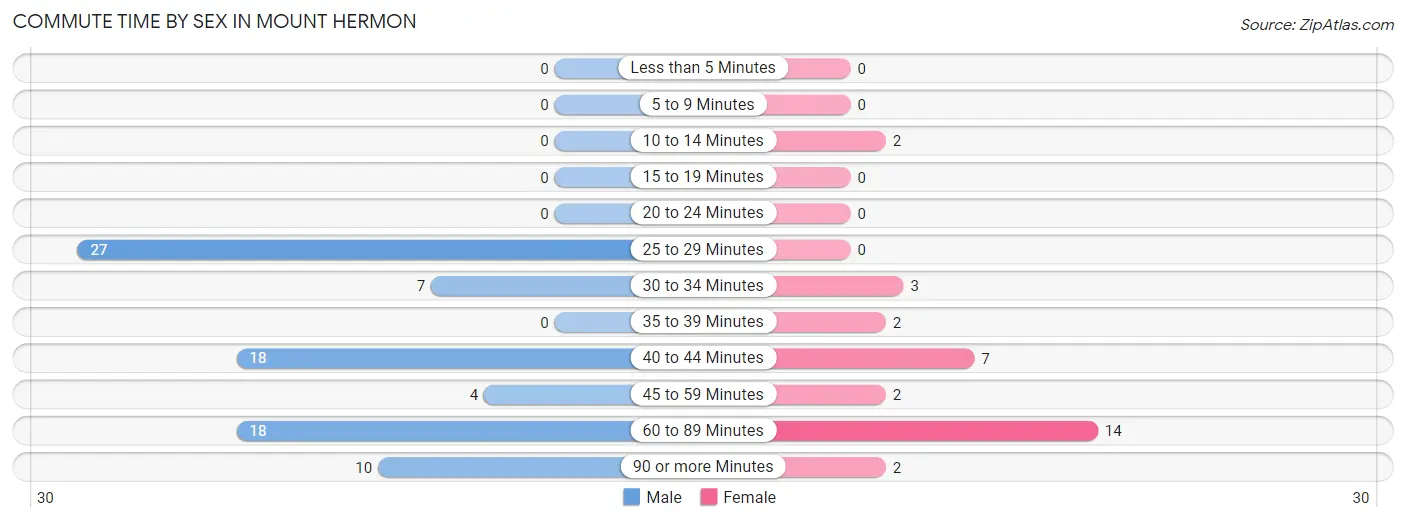
| Commute Time | Male | Female |
| Less than 5 Minutes | 0 (0.0%) | 0 (0.0%) |
| 5 to 9 Minutes | 0 (0.0%) | 0 (0.0%) |
| 10 to 14 Minutes | 0 (0.0%) | 2 (6.2%) |
| 15 to 19 Minutes | 0 (0.0%) | 0 (0.0%) |
| 20 to 24 Minutes | 0 (0.0%) | 0 (0.0%) |
| 25 to 29 Minutes | 27 (32.1%) | 0 (0.0%) |
| 30 to 34 Minutes | 7 (8.3%) | 3 (9.4%) |
| 35 to 39 Minutes | 0 (0.0%) | 2 (6.2%) |
| 40 to 44 Minutes | 18 (21.4%) | 7 (21.9%) |
| 45 to 59 Minutes | 4 (4.8%) | 2 (6.2%) |
| 60 to 89 Minutes | 18 (21.4%) | 14 (43.8%) |
| 90 or more Minutes | 10 (11.9%) | 2 (6.2%) |
Time of Departure to Work by Sex in Mount Hermon
The most frequent times of departure to work in Mount Hermon are 12:00 PM to 3:59 PM (32, 38.1%) for males and 9:00 AM to 9:59 AM (16, 50.0%) for females.
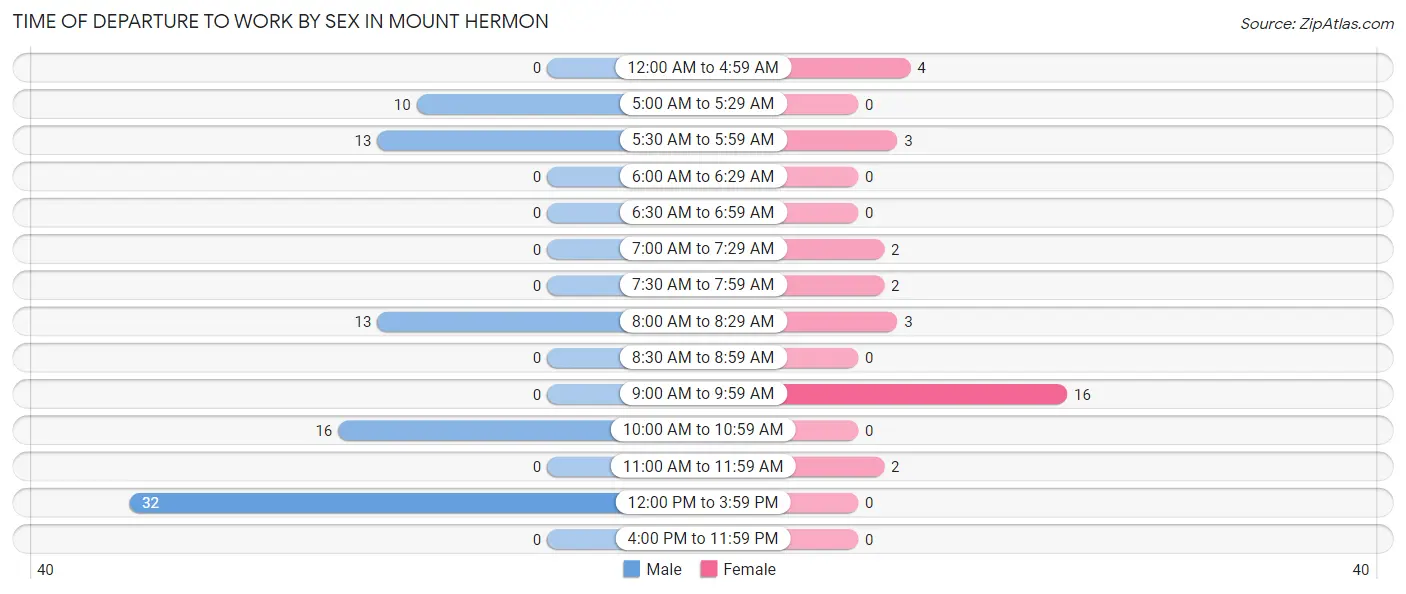
| Time of Departure | Male | Female |
| 12:00 AM to 4:59 AM | 0 (0.0%) | 4 (12.5%) |
| 5:00 AM to 5:29 AM | 10 (11.9%) | 0 (0.0%) |
| 5:30 AM to 5:59 AM | 13 (15.5%) | 3 (9.4%) |
| 6:00 AM to 6:29 AM | 0 (0.0%) | 0 (0.0%) |
| 6:30 AM to 6:59 AM | 0 (0.0%) | 0 (0.0%) |
| 7:00 AM to 7:29 AM | 0 (0.0%) | 2 (6.2%) |
| 7:30 AM to 7:59 AM | 0 (0.0%) | 2 (6.2%) |
| 8:00 AM to 8:29 AM | 13 (15.5%) | 3 (9.4%) |
| 8:30 AM to 8:59 AM | 0 (0.0%) | 0 (0.0%) |
| 9:00 AM to 9:59 AM | 0 (0.0%) | 16 (50.0%) |
| 10:00 AM to 10:59 AM | 16 (19.1%) | 0 (0.0%) |
| 11:00 AM to 11:59 AM | 0 (0.0%) | 2 (6.2%) |
| 12:00 PM to 3:59 PM | 32 (38.1%) | 0 (0.0%) |
| 4:00 PM to 11:59 PM | 0 (0.0%) | 0 (0.0%) |
| Total | 84 (100.0%) | 32 (100.0%) |
Housing Occupancy in Mount Hermon
Occupancy by Ownership in Mount Hermon
Of the total 87 dwellings in Mount Hermon, owner-occupied units account for 73 (83.9%), while renter-occupied units make up 14 (16.1%).
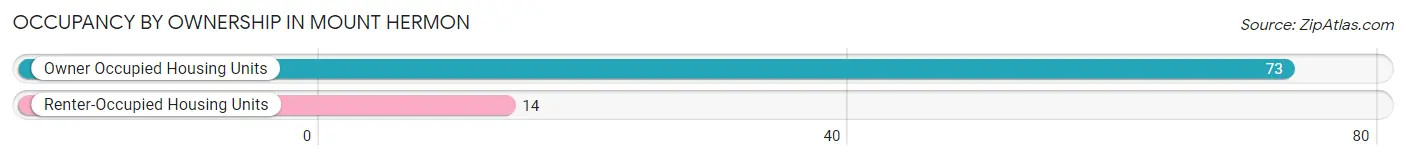
| Occupancy | # Housing Units | % Housing Units |
| Owner Occupied Housing Units | 73 | 83.9% |
| Renter-Occupied Housing Units | 14 | 16.1% |
| Total Occupied Housing Units | 87 | 100.0% |
Occupancy by Household Size in Mount Hermon
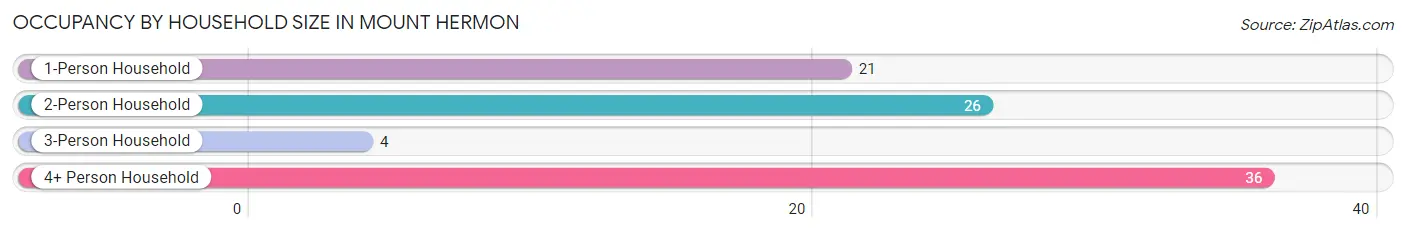
| Household Size | # Housing Units | % Housing Units |
| 1-Person Household | 21 | 24.1% |
| 2-Person Household | 26 | 29.9% |
| 3-Person Household | 4 | 4.6% |
| 4+ Person Household | 36 | 41.4% |
| Total Housing Units | 87 | 100.0% |
Occupancy by Ownership by Household Size in Mount Hermon
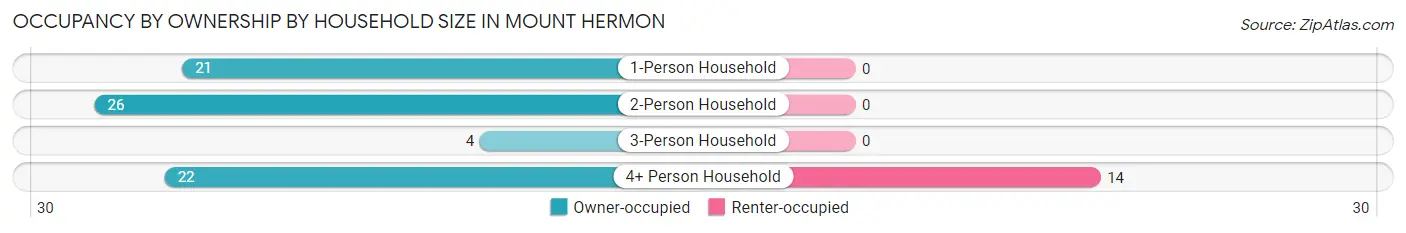
| Household Size | Owner-occupied | Renter-occupied |
| 1-Person Household | 21 (100.0%) | 0 (0.0%) |
| 2-Person Household | 26 (100.0%) | 0 (0.0%) |
| 3-Person Household | 4 (100.0%) | 0 (0.0%) |
| 4+ Person Household | 22 (61.1%) | 14 (38.9%) |
| Total Housing Units | 73 (83.9%) | 14 (16.1%) |
Occupancy by Educational Attainment in Mount Hermon
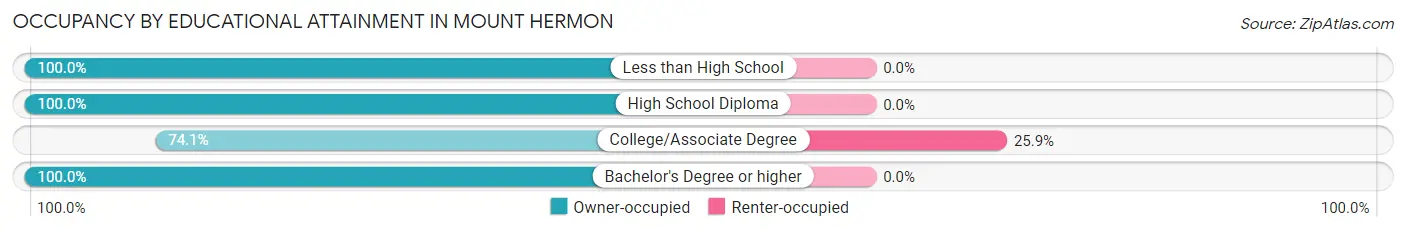
| Household Size | Owner-occupied | Renter-occupied |
| Less than High School | 4 (100.0%) | 0 (0.0%) |
| High School Diploma | 6 (100.0%) | 0 (0.0%) |
| College/Associate Degree | 40 (74.1%) | 14 (25.9%) |
| Bachelor's Degree or higher | 23 (100.0%) | 0 (0.0%) |
Occupancy by Age of Householder in Mount Hermon
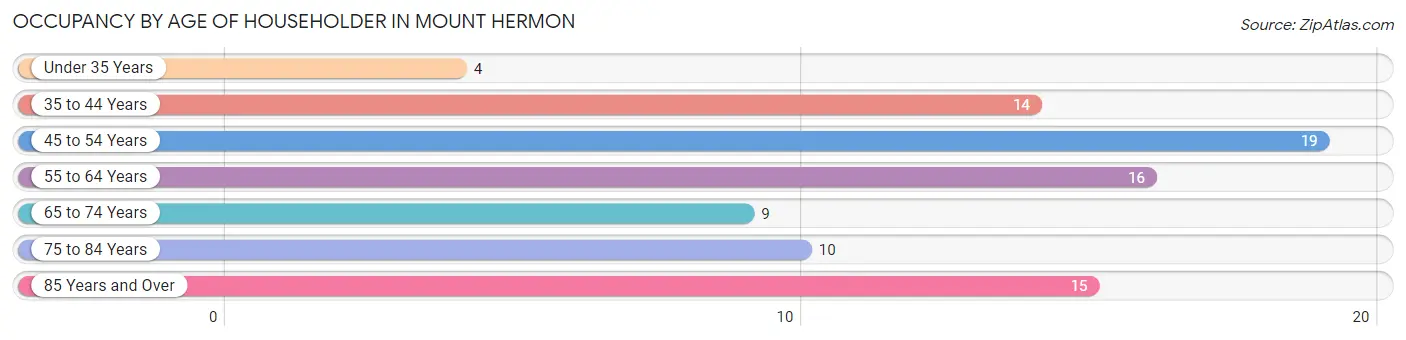
| Age Bracket | # Households | % Households |
| Under 35 Years | 4 | 4.6% |
| 35 to 44 Years | 14 | 16.1% |
| 45 to 54 Years | 19 | 21.8% |
| 55 to 64 Years | 16 | 18.4% |
| 65 to 74 Years | 9 | 10.3% |
| 75 to 84 Years | 10 | 11.5% |
| 85 Years and Over | 15 | 17.2% |
| Total | 87 | 100.0% |
Housing Finances in Mount Hermon
Median Income by Occupancy in Mount Hermon
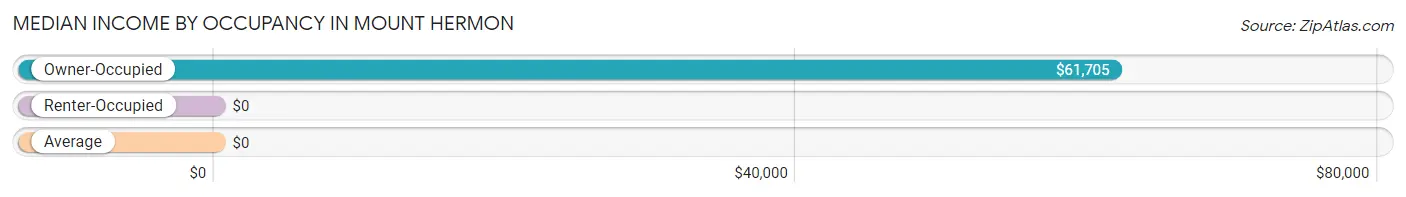
| Occupancy Type | # Households | Median Income |
| Owner-Occupied | 73 (83.9%) | $61,705 |
| Renter-Occupied | 14 (16.1%) | $0 |
| Average | 87 (100.0%) | $0 |
Occupancy by Householder Income Bracket in Mount Hermon
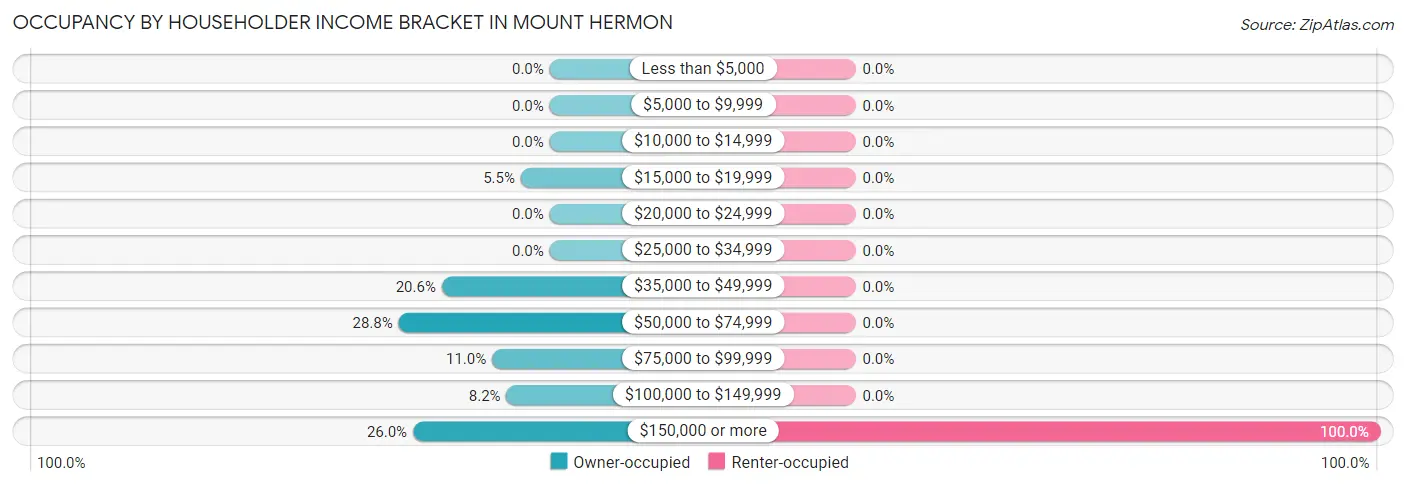
| Income Bracket | Owner-occupied | Renter-occupied |
| Less than $5,000 | 0 (0.0%) | 0 (0.0%) |
| $5,000 to $9,999 | 0 (0.0%) | 0 (0.0%) |
| $10,000 to $14,999 | 0 (0.0%) | 0 (0.0%) |
| $15,000 to $19,999 | 4 (5.5%) | 0 (0.0%) |
| $20,000 to $24,999 | 0 (0.0%) | 0 (0.0%) |
| $25,000 to $34,999 | 0 (0.0%) | 0 (0.0%) |
| $35,000 to $49,999 | 15 (20.5%) | 0 (0.0%) |
| $50,000 to $74,999 | 21 (28.8%) | 0 (0.0%) |
| $75,000 to $99,999 | 8 (11.0%) | 0 (0.0%) |
| $100,000 to $149,999 | 6 (8.2%) | 0 (0.0%) |
| $150,000 or more | 19 (26.0%) | 14 (100.0%) |
| Total | 73 (100.0%) | 14 (100.0%) |
Monthly Housing Cost Tiers in Mount Hermon
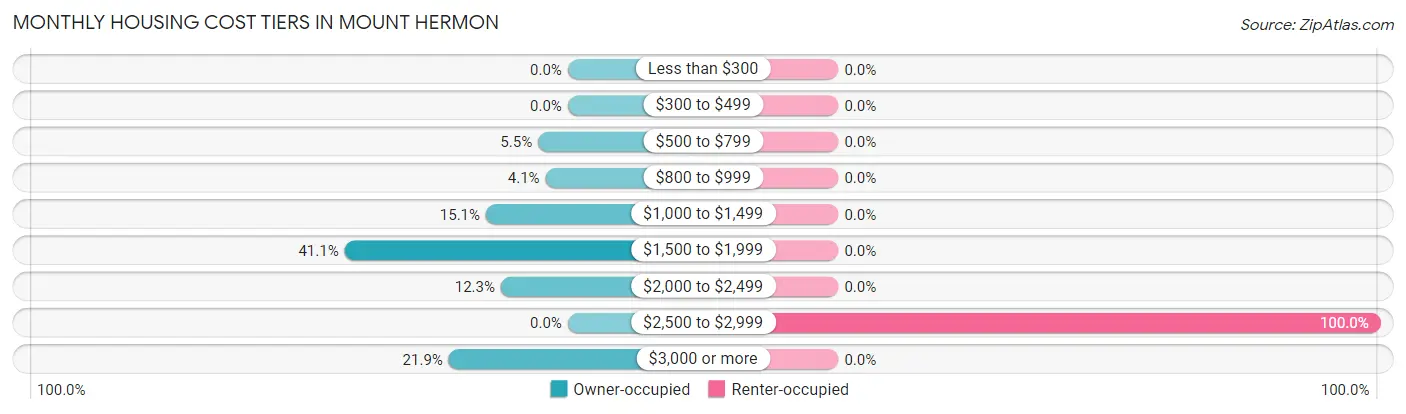
| Monthly Cost | Owner-occupied | Renter-occupied |
| Less than $300 | 0 (0.0%) | 0 (0.0%) |
| $300 to $499 | 0 (0.0%) | 0 (0.0%) |
| $500 to $799 | 4 (5.5%) | 0 (0.0%) |
| $800 to $999 | 3 (4.1%) | 0 (0.0%) |
| $1,000 to $1,499 | 11 (15.1%) | 0 (0.0%) |
| $1,500 to $1,999 | 30 (41.1%) | 0 (0.0%) |
| $2,000 to $2,499 | 9 (12.3%) | 0 (0.0%) |
| $2,500 to $2,999 | 0 (0.0%) | 14 (100.0%) |
| $3,000 or more | 16 (21.9%) | 0 (0.0%) |
| Total | 73 (100.0%) | 14 (100.0%) |
Physical Housing Characteristics in Mount Hermon
Housing Structures in Mount Hermon
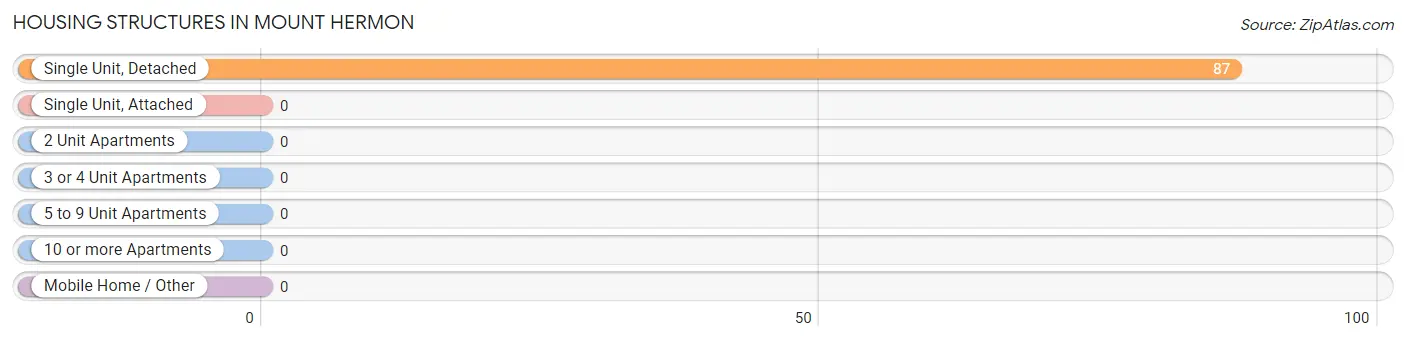
| Structure Type | # Housing Units | % Housing Units |
| Single Unit, Detached | 87 | 100.0% |
| Single Unit, Attached | 0 | 0.0% |
| 2 Unit Apartments | 0 | 0.0% |
| 3 or 4 Unit Apartments | 0 | 0.0% |
| 5 to 9 Unit Apartments | 0 | 0.0% |
| 10 or more Apartments | 0 | 0.0% |
| Mobile Home / Other | 0 | 0.0% |
| Total | 87 | 100.0% |
Housing Structures by Occupancy in Mount Hermon
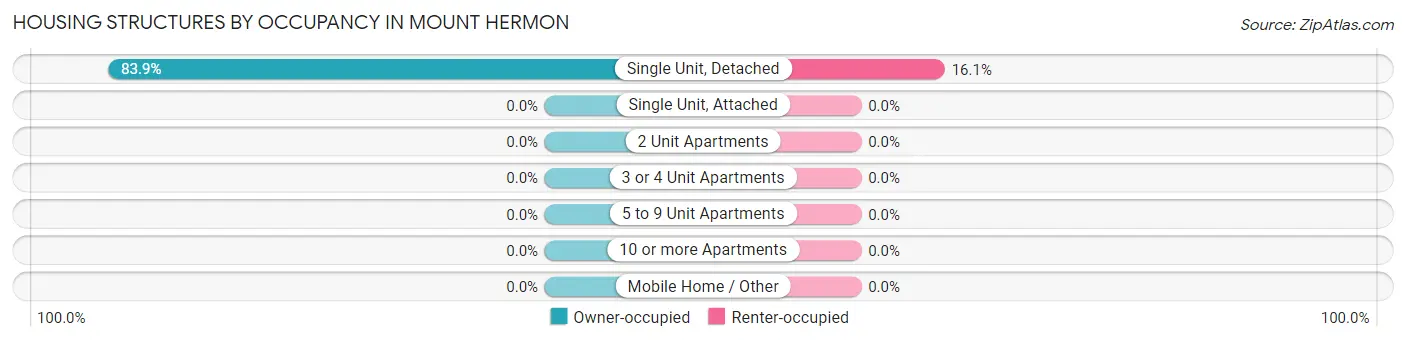
| Structure Type | Owner-occupied | Renter-occupied |
| Single Unit, Detached | 73 (83.9%) | 14 (16.1%) |
| Single Unit, Attached | 0 (0.0%) | 0 (0.0%) |
| 2 Unit Apartments | 0 (0.0%) | 0 (0.0%) |
| 3 or 4 Unit Apartments | 0 (0.0%) | 0 (0.0%) |
| 5 to 9 Unit Apartments | 0 (0.0%) | 0 (0.0%) |
| 10 or more Apartments | 0 (0.0%) | 0 (0.0%) |
| Mobile Home / Other | 0 (0.0%) | 0 (0.0%) |
| Total | 73 (83.9%) | 14 (16.1%) |
Housing Structures by Number of Rooms in Mount Hermon
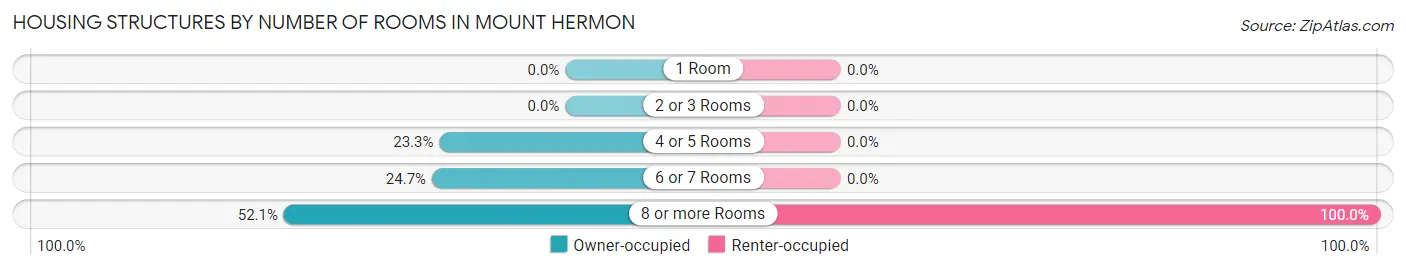
| Number of Rooms | Owner-occupied | Renter-occupied |
| 1 Room | 0 (0.0%) | 0 (0.0%) |
| 2 or 3 Rooms | 0 (0.0%) | 0 (0.0%) |
| 4 or 5 Rooms | 17 (23.3%) | 0 (0.0%) |
| 6 or 7 Rooms | 18 (24.7%) | 0 (0.0%) |
| 8 or more Rooms | 38 (52.0%) | 14 (100.0%) |
| Total | 73 (100.0%) | 14 (100.0%) |
Housing Structure by Heating Type in Mount Hermon
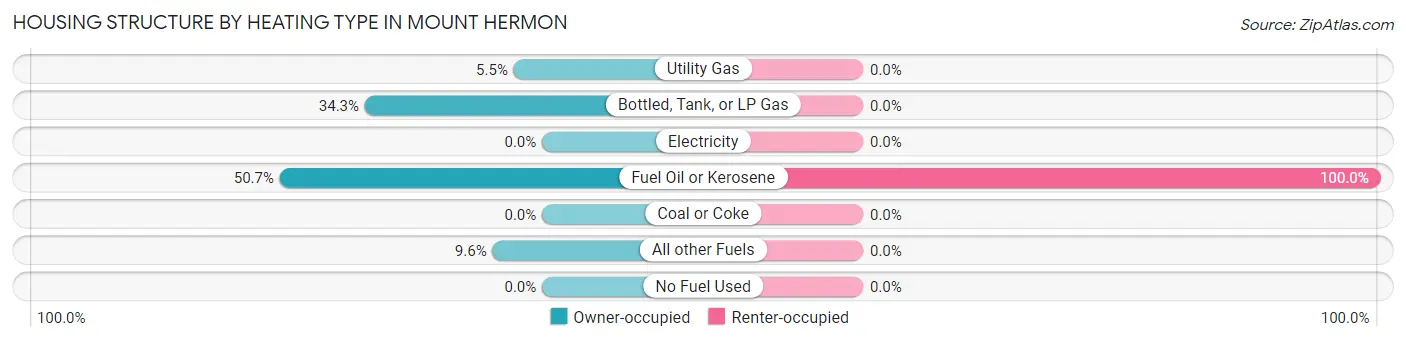
| Heating Type | Owner-occupied | Renter-occupied |
| Utility Gas | 4 (5.5%) | 0 (0.0%) |
| Bottled, Tank, or LP Gas | 25 (34.3%) | 0 (0.0%) |
| Electricity | 0 (0.0%) | 0 (0.0%) |
| Fuel Oil or Kerosene | 37 (50.7%) | 14 (100.0%) |
| Coal or Coke | 0 (0.0%) | 0 (0.0%) |
| All other Fuels | 7 (9.6%) | 0 (0.0%) |
| No Fuel Used | 0 (0.0%) | 0 (0.0%) |
| Total | 73 (100.0%) | 14 (100.0%) |
Household Vehicle Usage in Mount Hermon
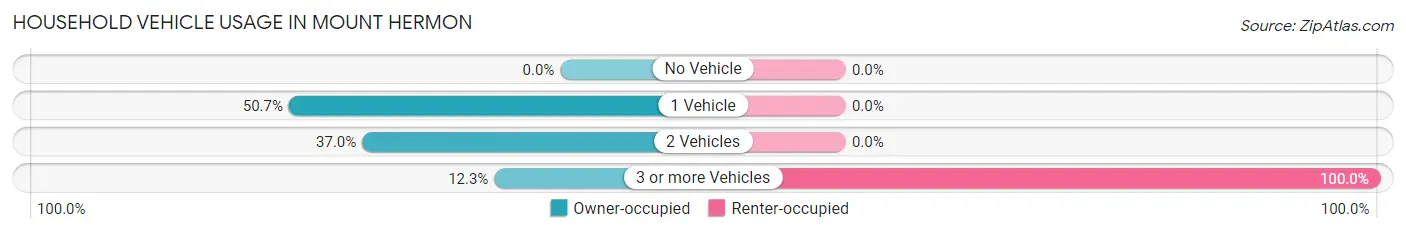
| Vehicles per Household | Owner-occupied | Renter-occupied |
| No Vehicle | 0 (0.0%) | 0 (0.0%) |
| 1 Vehicle | 37 (50.7%) | 0 (0.0%) |
| 2 Vehicles | 27 (37.0%) | 0 (0.0%) |
| 3 or more Vehicles | 9 (12.3%) | 14 (100.0%) |
| Total | 73 (100.0%) | 14 (100.0%) |
Real Estate & Mortgages in Mount Hermon
Real Estate and Mortgage Overview in Mount Hermon
| Characteristic | Without Mortgage | With Mortgage |
| Housing Units | 18 | 55 |
| Median Property Value | $385,700 | $402,600 |
| Median Household Income | $54,583 | $14 |
| Monthly Housing Costs | $1,140 | $16 |
| Real Estate Taxes | $9,000 | $0 |
Property Value by Mortgage Status in Mount Hermon
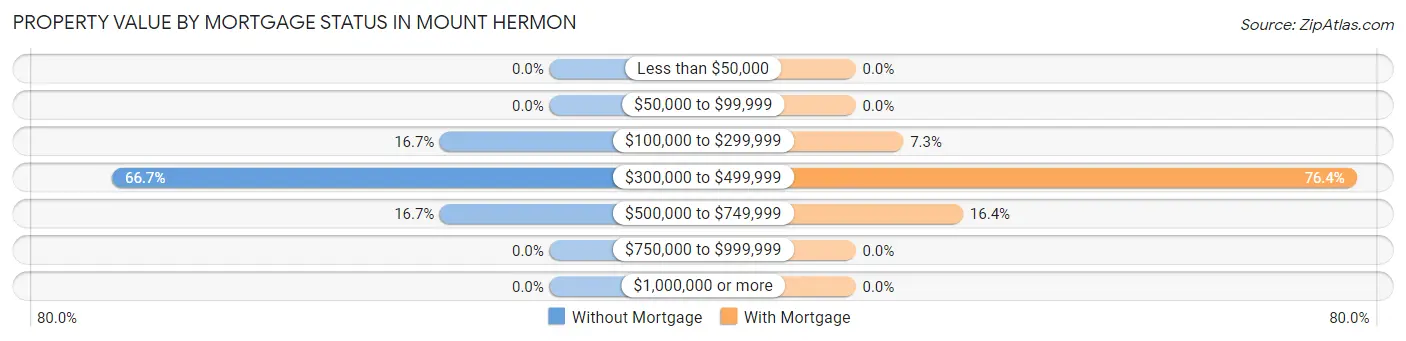
| Property Value | Without Mortgage | With Mortgage |
| Less than $50,000 | 0 (0.0%) | 0 (0.0%) |
| $50,000 to $99,999 | 0 (0.0%) | 0 (0.0%) |
| $100,000 to $299,999 | 3 (16.7%) | 4 (7.3%) |
| $300,000 to $499,999 | 12 (66.7%) | 42 (76.4%) |
| $500,000 to $749,999 | 3 (16.7%) | 9 (16.4%) |
| $750,000 to $999,999 | 0 (0.0%) | 0 (0.0%) |
| $1,000,000 or more | 0 (0.0%) | 0 (0.0%) |
| Total | 18 (100.0%) | 55 (100.0%) |
Household Income by Mortgage Status in Mount Hermon
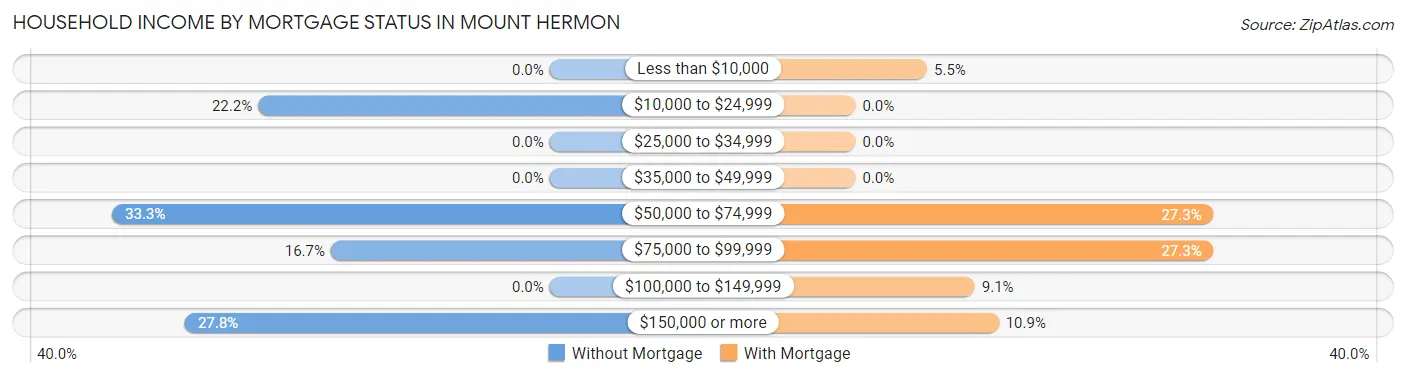
| Household Income | Without Mortgage | With Mortgage |
| Less than $10,000 | 0 (0.0%) | 3 (5.4%) |
| $10,000 to $24,999 | 4 (22.2%) | 0 (0.0%) |
| $25,000 to $34,999 | 0 (0.0%) | 0 (0.0%) |
| $35,000 to $49,999 | 0 (0.0%) | 0 (0.0%) |
| $50,000 to $74,999 | 6 (33.3%) | 15 (27.3%) |
| $75,000 to $99,999 | 3 (16.7%) | 15 (27.3%) |
| $100,000 to $149,999 | 0 (0.0%) | 5 (9.1%) |
| $150,000 or more | 5 (27.8%) | 6 (10.9%) |
| Total | 18 (100.0%) | 55 (100.0%) |
Property Value to Household Income Ratio in Mount Hermon
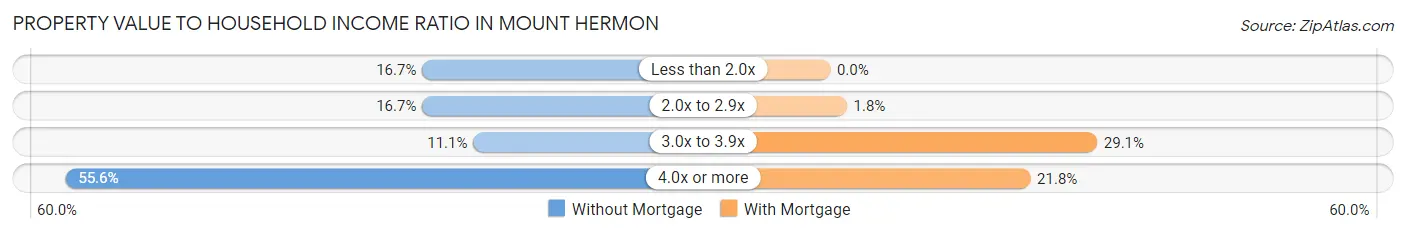
| Value-to-Income Ratio | Without Mortgage | With Mortgage |
| Less than 2.0x | 3 (16.7%) | 0 (0.0%) |
| 2.0x to 2.9x | 3 (16.7%) | 1 (1.8%) |
| 3.0x to 3.9x | 2 (11.1%) | 16 (29.1%) |
| 4.0x or more | 10 (55.6%) | 12 (21.8%) |
| Total | 18 (100.0%) | 55 (100.0%) |
Real Estate Taxes by Mortgage Status in Mount Hermon
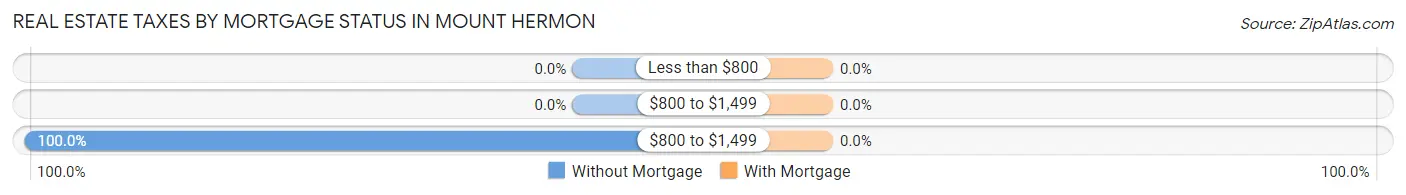
| Property Taxes | Without Mortgage | With Mortgage |
| Less than $800 | 0 (0.0%) | 0 (0.0%) |
| $800 to $1,499 | 0 (0.0%) | 0 (0.0%) |
| $800 to $1,499 | 18 (100.0%) | 0 (0.0%) |
| Total | 18 (100.0%) | 55 (100.0%) |
Health & Disability in Mount Hermon
Health Insurance Coverage by Age in Mount Hermon
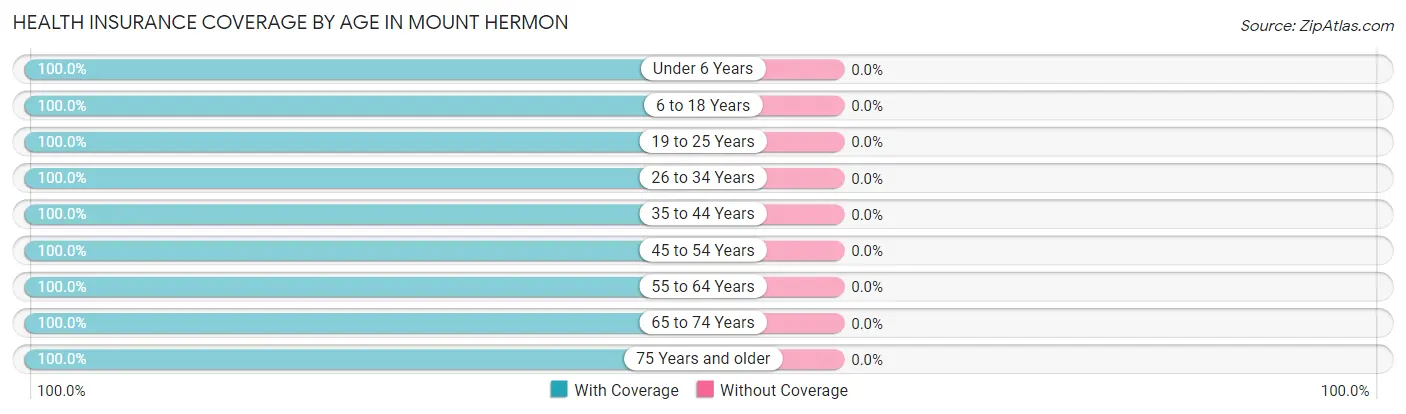
| Age Bracket | With Coverage | Without Coverage |
| Under 6 Years | 11 (100.0%) | 0 (0.0%) |
| 6 to 18 Years | 33 (100.0%) | 0 (0.0%) |
| 19 to 25 Years | 36 (100.0%) | 0 (0.0%) |
| 26 to 34 Years | 8 (100.0%) | 0 (0.0%) |
| 35 to 44 Years | 21 (100.0%) | 0 (0.0%) |
| 45 to 54 Years | 33 (100.0%) | 0 (0.0%) |
| 55 to 64 Years | 35 (100.0%) | 0 (0.0%) |
| 65 to 74 Years | 14 (100.0%) | 0 (0.0%) |
| 75 Years and older | 38 (100.0%) | 0 (0.0%) |
| Total | 229 (100.0%) | 0 (0.0%) |
Health Insurance Coverage by Citizenship Status in Mount Hermon
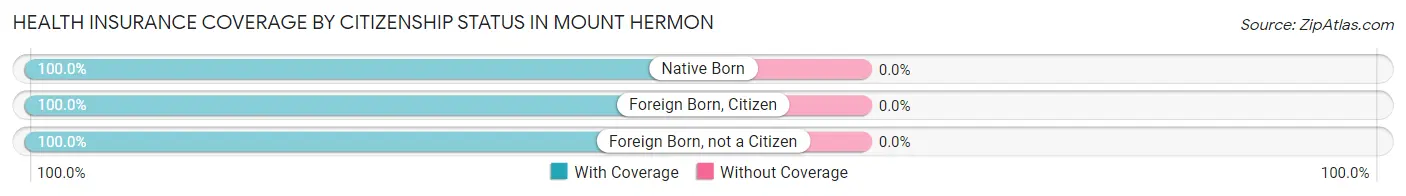
| Citizenship Status | With Coverage | Without Coverage |
| Native Born | 11 (100.0%) | 0 (0.0%) |
| Foreign Born, Citizen | 33 (100.0%) | 0 (0.0%) |
| Foreign Born, not a Citizen | 36 (100.0%) | 0 (0.0%) |
Health Insurance Coverage by Household Income in Mount Hermon
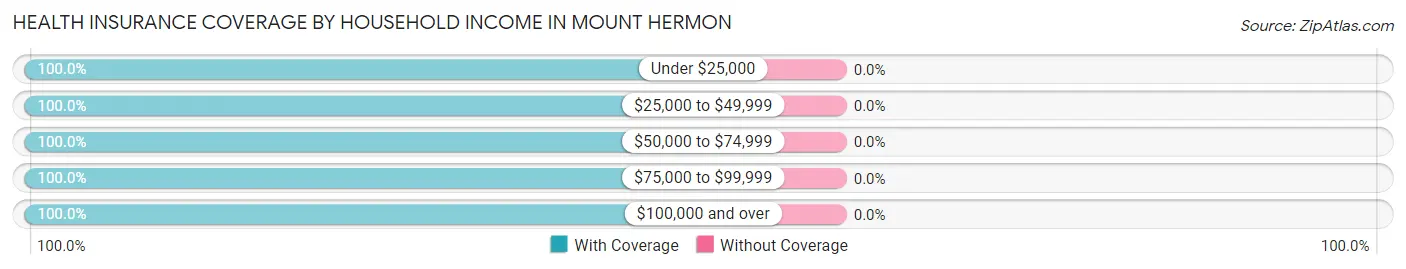
| Household Income | With Coverage | Without Coverage |
| Under $25,000 | 4 (100.0%) | 0 (0.0%) |
| $25,000 to $49,999 | 28 (100.0%) | 0 (0.0%) |
| $50,000 to $74,999 | 31 (100.0%) | 0 (0.0%) |
| $75,000 to $99,999 | 28 (100.0%) | 0 (0.0%) |
| $100,000 and over | 138 (100.0%) | 0 (0.0%) |
Public vs Private Health Insurance Coverage by Age in Mount Hermon
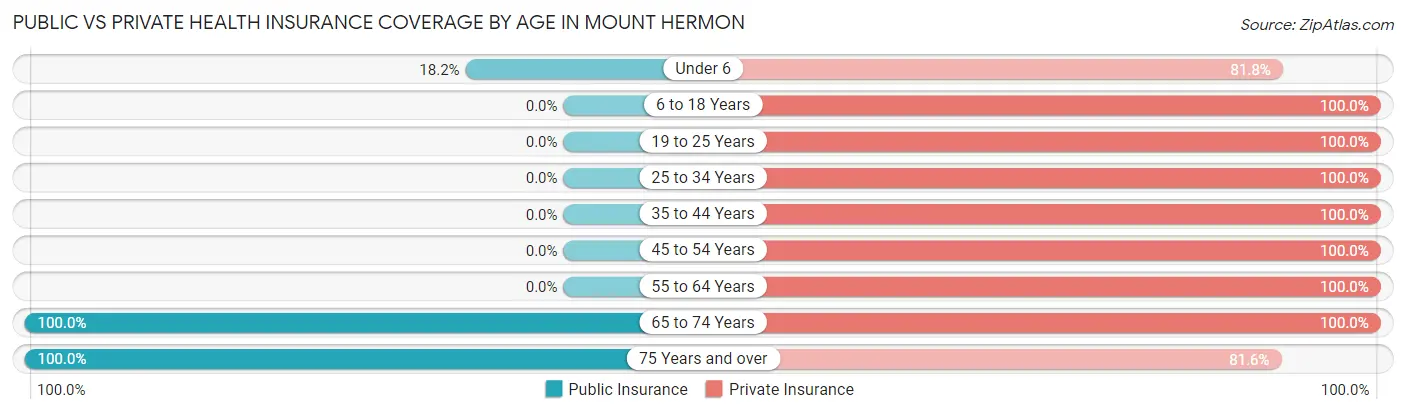
| Age Bracket | Public Insurance | Private Insurance |
| Under 6 | 2 (18.2%) | 9 (81.8%) |
| 6 to 18 Years | 0 (0.0%) | 33 (100.0%) |
| 19 to 25 Years | 0 (0.0%) | 36 (100.0%) |
| 25 to 34 Years | 0 (0.0%) | 8 (100.0%) |
| 35 to 44 Years | 0 (0.0%) | 21 (100.0%) |
| 45 to 54 Years | 0 (0.0%) | 33 (100.0%) |
| 55 to 64 Years | 0 (0.0%) | 35 (100.0%) |
| 65 to 74 Years | 14 (100.0%) | 14 (100.0%) |
| 75 Years and over | 38 (100.0%) | 31 (81.6%) |
| Total | 54 (23.6%) | 220 (96.1%) |
Disability Status by Sex by Age in Mount Hermon
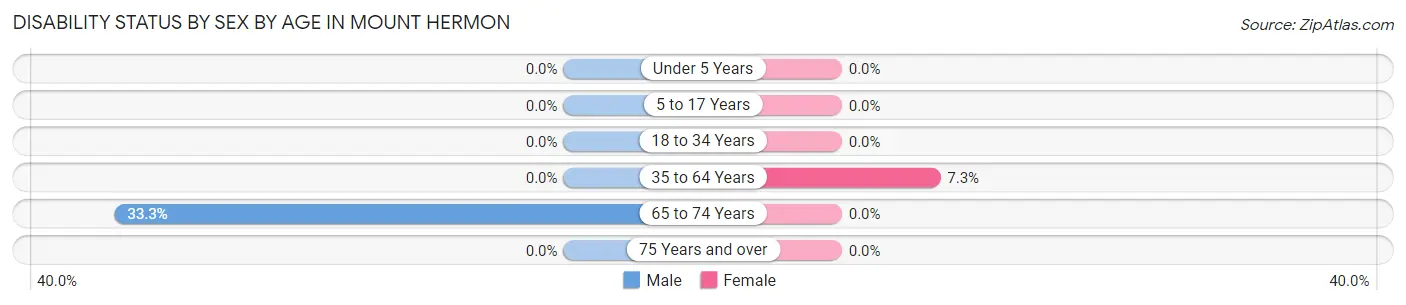
| Age Bracket | Male | Female |
| Under 5 Years | 0 (0.0%) | 0 (0.0%) |
| 5 to 17 Years | 0 (0.0%) | 0 (0.0%) |
| 18 to 34 Years | 0 (0.0%) | 0 (0.0%) |
| 35 to 64 Years | 0 (0.0%) | 3 (7.3%) |
| 65 to 74 Years | 3 (33.3%) | 0 (0.0%) |
| 75 Years and over | 0 (0.0%) | 0 (0.0%) |
Disability Class by Sex by Age in Mount Hermon
Disability Class: Hearing Difficulty
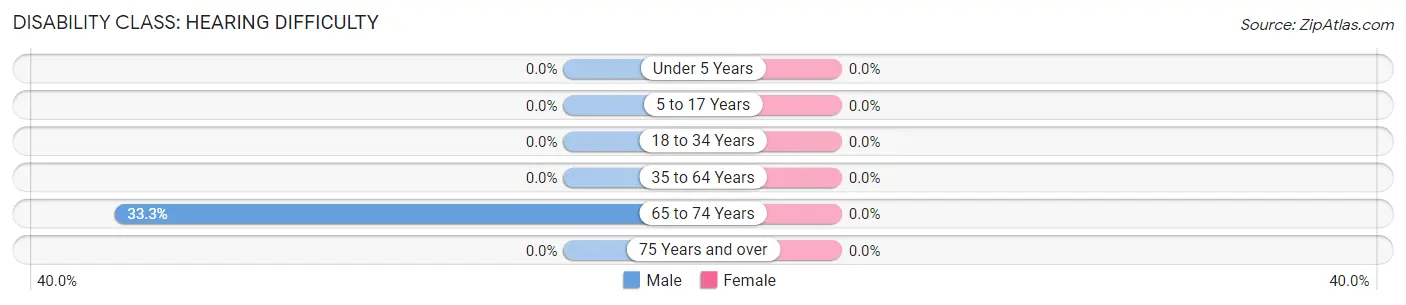
| Age Bracket | Male | Female |
| Under 5 Years | 0 (0.0%) | 0 (0.0%) |
| 5 to 17 Years | 0 (0.0%) | 0 (0.0%) |
| 18 to 34 Years | 0 (0.0%) | 0 (0.0%) |
| 35 to 64 Years | 0 (0.0%) | 0 (0.0%) |
| 65 to 74 Years | 3 (33.3%) | 0 (0.0%) |
| 75 Years and over | 0 (0.0%) | 0 (0.0%) |
Disability Class: Vision Difficulty
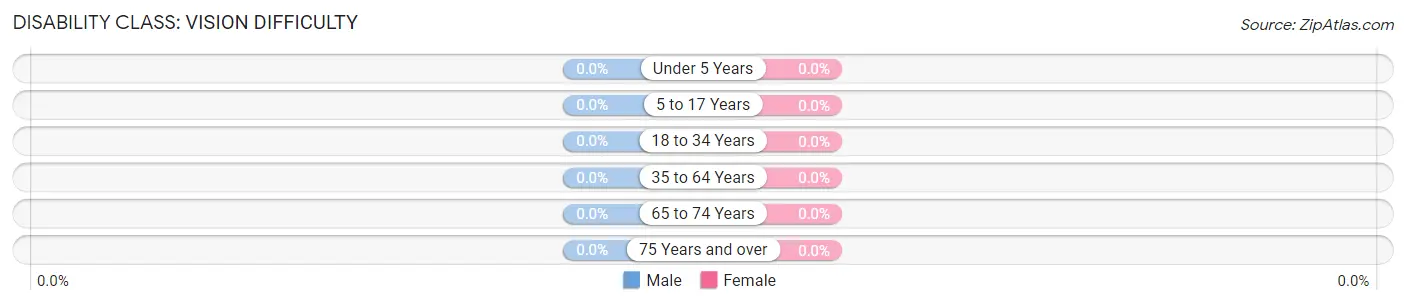
| Age Bracket | Male | Female |
| Under 5 Years | 0 (0.0%) | 0 (0.0%) |
| 5 to 17 Years | 0 (0.0%) | 0 (0.0%) |
| 18 to 34 Years | 0 (0.0%) | 0 (0.0%) |
| 35 to 64 Years | 0 (0.0%) | 0 (0.0%) |
| 65 to 74 Years | 0 (0.0%) | 0 (0.0%) |
| 75 Years and over | 0 (0.0%) | 0 (0.0%) |
Disability Class: Cognitive Difficulty
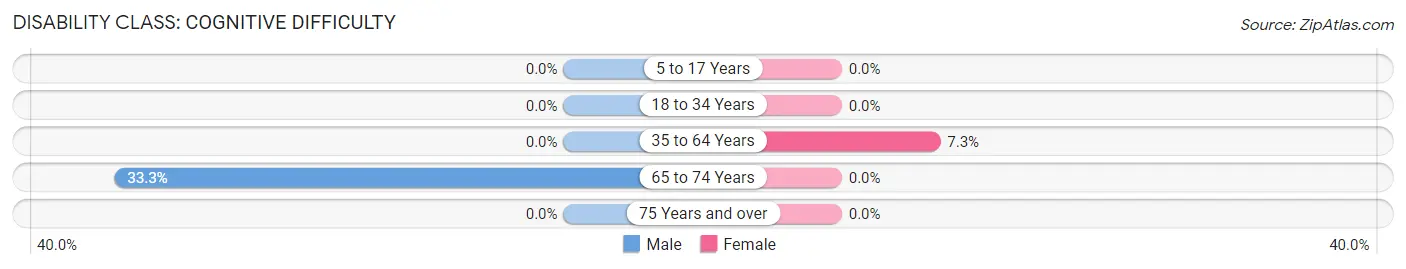
| Age Bracket | Male | Female |
| 5 to 17 Years | 0 (0.0%) | 0 (0.0%) |
| 18 to 34 Years | 0 (0.0%) | 0 (0.0%) |
| 35 to 64 Years | 0 (0.0%) | 3 (7.3%) |
| 65 to 74 Years | 3 (33.3%) | 0 (0.0%) |
| 75 Years and over | 0 (0.0%) | 0 (0.0%) |
Disability Class: Ambulatory Difficulty
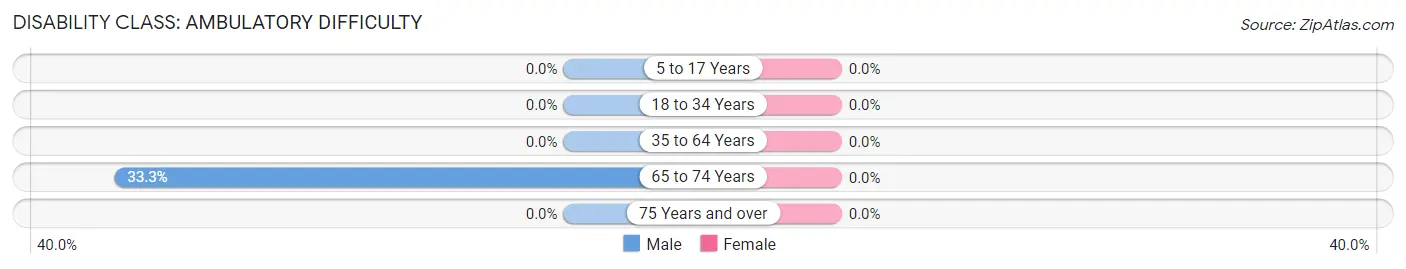
| Age Bracket | Male | Female |
| 5 to 17 Years | 0 (0.0%) | 0 (0.0%) |
| 18 to 34 Years | 0 (0.0%) | 0 (0.0%) |
| 35 to 64 Years | 0 (0.0%) | 0 (0.0%) |
| 65 to 74 Years | 3 (33.3%) | 0 (0.0%) |
| 75 Years and over | 0 (0.0%) | 0 (0.0%) |
Disability Class: Self-Care Difficulty
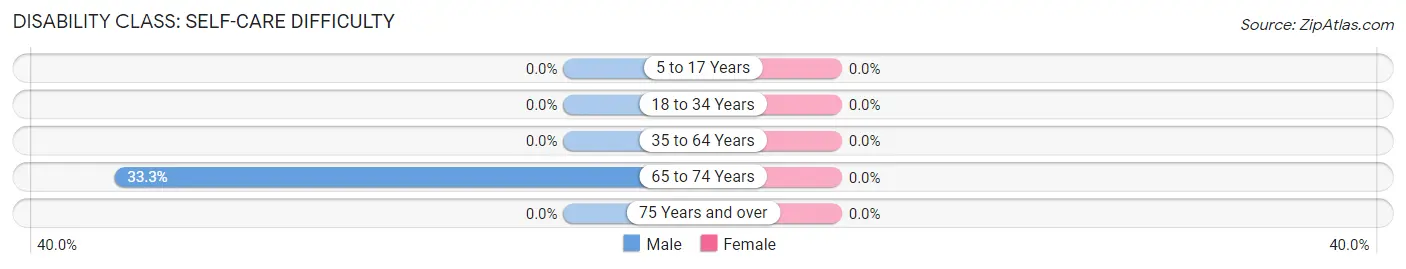
| Age Bracket | Male | Female |
| 5 to 17 Years | 0 (0.0%) | 0 (0.0%) |
| 18 to 34 Years | 0 (0.0%) | 0 (0.0%) |
| 35 to 64 Years | 0 (0.0%) | 0 (0.0%) |
| 65 to 74 Years | 3 (33.3%) | 0 (0.0%) |
| 75 Years and over | 0 (0.0%) | 0 (0.0%) |
Technology Access in Mount Hermon
Computing Device Access in Mount Hermon
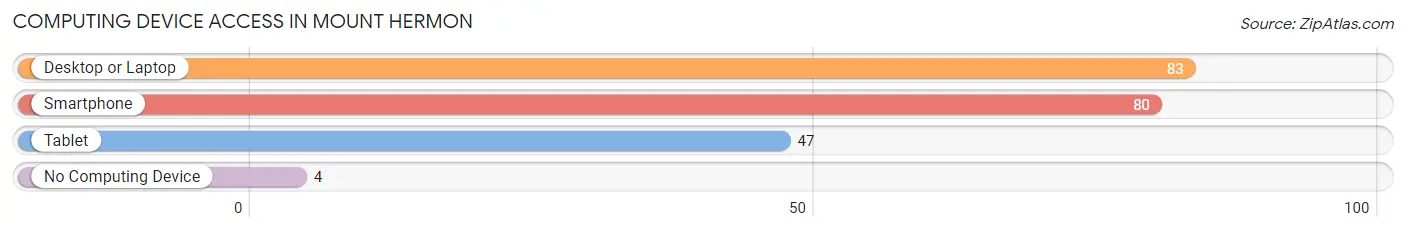
| Device Type | # Households | % Households |
| Desktop or Laptop | 83 | 95.4% |
| Smartphone | 80 | 91.9% |
| Tablet | 47 | 54.0% |
| No Computing Device | 4 | 4.6% |
| Total | 87 | 100.0% |
Internet Access in Mount Hermon
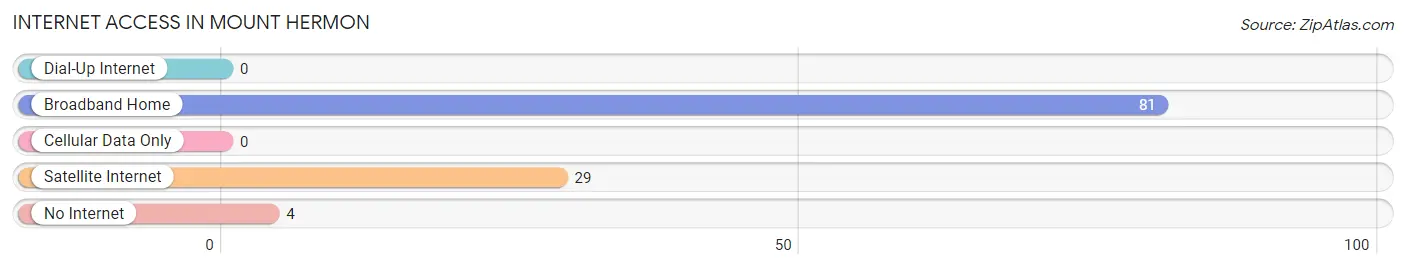
| Internet Type | # Households | % Households |
| Dial-Up Internet | 0 | 0.0% |
| Broadband Home | 81 | 93.1% |
| Cellular Data Only | 0 | 0.0% |
| Satellite Internet | 29 | 33.3% |
| No Internet | 4 | 4.6% |
| Total | 87 | 100.0% |
Mount Hermon Summary
Mount Hermon, NJ is a small unincorporated community located in the northern part of the state of New Jersey. It is situated in the foothills of the Kittatinny Mountains, and is part of the larger Sussex County. The community is located approximately 25 miles northwest of the state capital of Trenton, and is bordered by the townships of Wantage, Frankford, and Sandyston.
History
Mount Hermon was first settled in the late 1700s by a group of German immigrants. The area was originally known as “Herrmannsdorf”, and was named after the Herrmann family who were among the first settlers. The area was later renamed “Mount Hermon” in 1845, after the biblical mountain of the same name.
The area was primarily agricultural in nature, with the main crops being potatoes, corn, and hay. The area was also known for its dairy farms, and the local cheese factory was a major employer in the area.
In the late 1800s, the area began to experience a period of growth and development. The first post office was established in 1887, and the first school was built in 1895. The area also saw the construction of several churches, including the Mount Hermon Methodist Church, which was built in 1891.
Geography
Mount Hermon is located in the northern part of Sussex County, in the foothills of the Kittatinny Mountains. The area is characterized by rolling hills and valleys, with the highest point being the summit of Mount Hermon, which stands at 1,845 feet above sea level.
The area is home to several small streams, including the Pequest River, which flows through the area. The area is also home to several small lakes, including Lake Aeroflex and Lake Mohawk.
Economy
The economy of Mount Hermon is primarily based on agriculture and tourism. The area is home to several small farms, which produce a variety of crops, including potatoes, corn, and hay. The area is also home to several small businesses, including a cheese factory, a sawmill, and a general store.
The area is also home to several tourist attractions, including the Mount Hermon Ski Resort, which is located on the slopes of Mount Hermon. The area is also home to several campgrounds, which attract visitors from all over the state.
Demographics
As of the 2010 census, the population of Mount Hermon was 1,845. The population is primarily white (94.3%), with the remaining population being made up of African Americans (2.2%), Hispanics (1.7%), and Asians (1.3%). The median household income in the area is $50,000, and the median home value is $170,000.
The area is served by the Mount Hermon School District, which consists of one elementary school, one middle school, and one high school. The area is also home to several churches, including the Mount Hermon Methodist Church, which was built in 1891.
Conclusion
Mount Hermon, NJ is a small unincorporated community located in the northern part of the state of New Jersey. It is situated in the foothills of the Kittatinny Mountains, and is part of the larger Sussex County. The area is characterized by rolling hills and valleys, and is home to several small farms, businesses, and tourist attractions. The population of the area is primarily white, with the median household income being $50,000 and the median home value being $170,000. The area is served by the Mount Hermon School District, and is home to several churches, including the Mount Hermon Methodist Church.
Common Questions
What is Per Capita Income in Mount Hermon?
Per Capita income in Mount Hermon is $51,651.
What is Income or Wage Gap in Mount Hermon?
Income or Wage Gap in Mount Hermon is 48.1%.
Women in Mount Hermon earn 51.9 cents for every dollar earned by a man.
What is Inequality or Gini Index in Mount Hermon?
Inequality or Gini Index in Mount Hermon is 0.40.
What is the Total Population of Mount Hermon?
Total Population of Mount Hermon is 230.
What is the Total Male Population of Mount Hermon?
Total Male Population of Mount Hermon is 133.
What is the Total Female Population of Mount Hermon?
Total Female Population of Mount Hermon is 97.
What is the Ratio of Males per 100 Females in Mount Hermon?
There are 137.11 Males per 100 Females in Mount Hermon.
What is the Ratio of Females per 100 Males in Mount Hermon?
There are 72.93 Females per 100 Males in Mount Hermon.
What is the Median Population Age in Mount Hermon?
Median Population Age in Mount Hermon is 45.5 Years.
What is the Average Family Size in Mount Hermon
Average Family Size in Mount Hermon is 3.2 People.
What is the Average Household Size in Mount Hermon
Average Household Size in Mount Hermon is 2.6 People.
How Large is the Labor Force in Mount Hermon?
There are 123 People in the Labor Forcein in Mount Hermon.
What is the Percentage of People in the Labor Force in Mount Hermon?
64.7% of People are in the Labor Force in Mount Hermon.