Zip Codes with the Lowest Poverty Level Among Children Under the Age of 5 in New Jersey
RELATED REPORTS & OPTIONS
Lowest Poverty | Child 0-5
New Jersey
Compare Zip Codes
Map of Zip Codes with the Lowest Poverty Level Among Children Under the Age of 5 in New Jersey
5.0%
0.0%
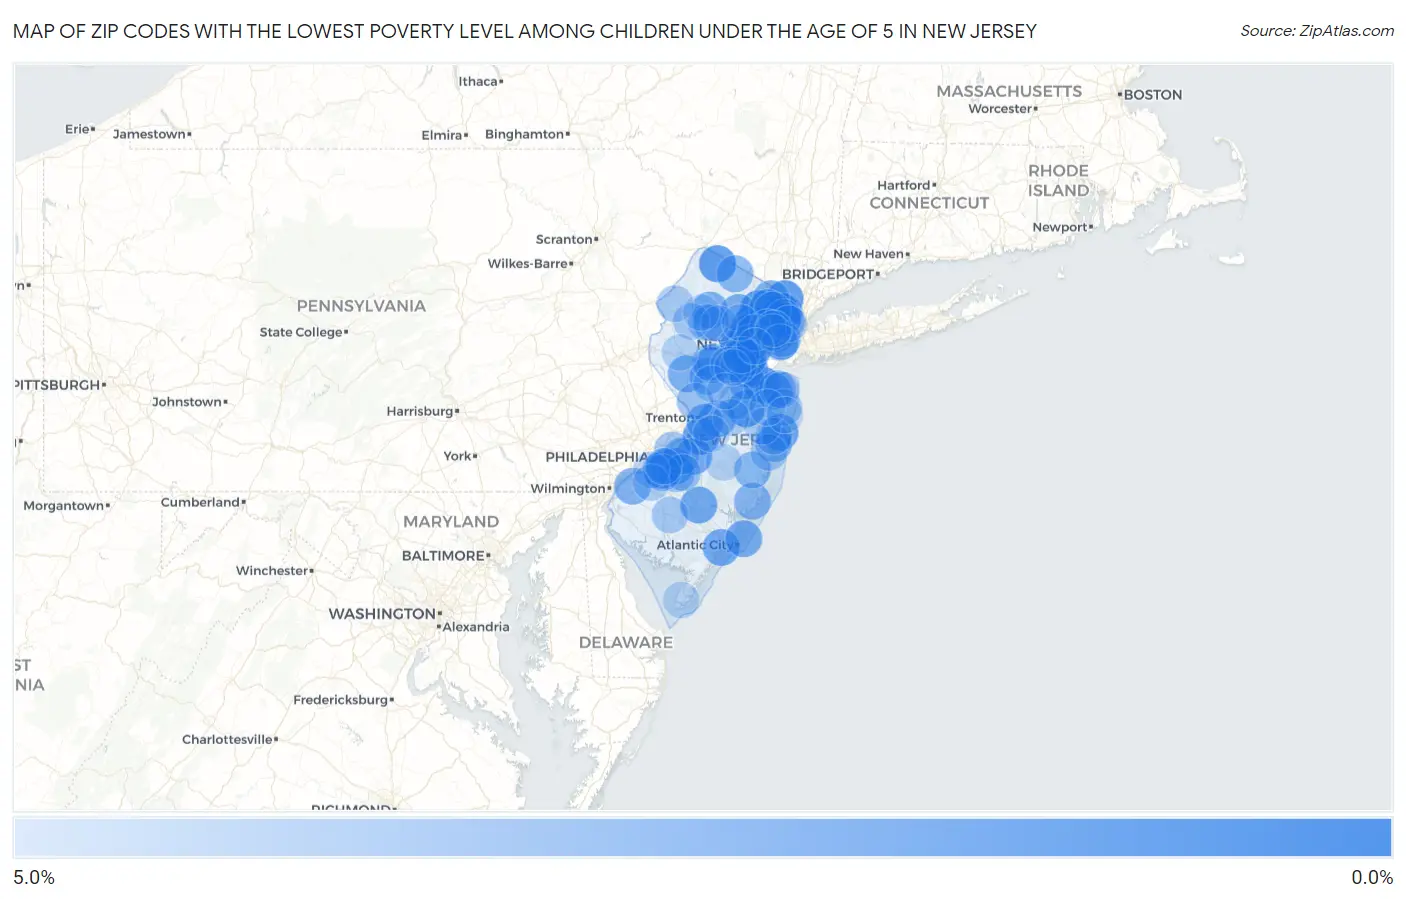
Zip Codes with the Lowest Poverty Level Among Children Under the Age of 5 in New Jersey
| Zip Code | Child Poverty | vs State | vs National | |
| 1. | 07090 | 0.22% | 14.3%(-14.1)#1 | 18.1%(-17.8)#11 |
| 2. | 07470 | 0.38% | 14.3%(-13.9)#2 | 18.1%(-17.7)#28 |
| 3. | 07040 | 0.50% | 14.3%(-13.8)#3 | 18.1%(-17.6)#59 |
| 4. | 07675 | 0.50% | 14.3%(-13.8)#4 | 18.1%(-17.6)#63 |
| 5. | 07461 | 0.55% | 14.3%(-13.7)#5 | 18.1%(-17.5)#74 |
| 6. | 07726 | 0.71% | 14.3%(-13.6)#6 | 18.1%(-17.4)#132 |
| 7. | 07006 | 0.73% | 14.3%(-13.5)#7 | 18.1%(-17.3)#140 |
| 8. | 08031 | 0.74% | 14.3%(-13.5)#8 | 18.1%(-17.3)#150 |
| 9. | 07016 | 0.83% | 14.3%(-13.4)#9 | 18.1%(-17.2)#189 |
| 10. | 08505 | 0.87% | 14.3%(-13.4)#10 | 18.1%(-17.2)#214 |
| 11. | 07043 | 0.91% | 14.3%(-13.4)#11 | 18.1%(-17.2)#234 |
| 12. | 07735 | 0.93% | 14.3%(-13.4)#12 | 18.1%(-17.1)#245 |
| 13. | 07310 | 1.0% | 14.3%(-13.3)#13 | 18.1%(-17.0)#282 |
| 14. | 07646 | 1.0% | 14.3%(-13.3)#14 | 18.1%(-17.0)#285 |
| 15. | 07928 | 1.0% | 14.3%(-13.3)#15 | 18.1%(-17.0)#286 |
| 16. | 08736 | 1.0% | 14.3%(-13.2)#16 | 18.1%(-17.0)#305 |
| 17. | 07661 | 1.1% | 14.3%(-13.1)#17 | 18.1%(-16.9)#352 |
| 18. | 07044 | 1.2% | 14.3%(-13.1)#18 | 18.1%(-16.9)#369 |
| 19. | 08037 | 1.4% | 14.3%(-12.9)#19 | 18.1%(-16.7)#463 |
| 20. | 08221 | 1.4% | 14.3%(-12.8)#20 | 18.1%(-16.6)#493 |
| 21. | 08048 | 1.5% | 14.3%(-12.8)#21 | 18.1%(-16.6)#520 |
| 22. | 07039 | 1.5% | 14.3%(-12.8)#22 | 18.1%(-16.6)#529 |
| 23. | 08203 | 1.6% | 14.3%(-12.7)#23 | 18.1%(-16.5)#565 |
| 24. | 08691 | 1.6% | 14.3%(-12.7)#24 | 18.1%(-16.5)#597 |
| 25. | 07974 | 1.6% | 14.3%(-12.7)#25 | 18.1%(-16.4)#606 |
| 26. | 07901 | 1.7% | 14.3%(-12.6)#26 | 18.1%(-16.4)#620 |
| 27. | 07005 | 1.7% | 14.3%(-12.5)#27 | 18.1%(-16.3)#676 |
| 28. | 08003 | 1.8% | 14.3%(-12.5)#28 | 18.1%(-16.3)#695 |
| 29. | 08840 | 1.8% | 14.3%(-12.5)#29 | 18.1%(-16.3)#714 |
| 30. | 07748 | 1.8% | 14.3%(-12.4)#30 | 18.1%(-16.2)#735 |
| 31. | 08822 | 1.9% | 14.3%(-12.4)#31 | 18.1%(-16.2)#768 |
| 32. | 07076 | 1.9% | 14.3%(-12.3)#32 | 18.1%(-16.1)#789 |
| 33. | 08610 | 2.0% | 14.3%(-12.3)#33 | 18.1%(-16.1)#806 |
| 34. | 08863 | 2.0% | 14.3%(-12.2)#34 | 18.1%(-16.0)#854 |
| 35. | 07094 | 2.1% | 14.3%(-12.2)#35 | 18.1%(-16.0)#883 |
| 36. | 08085 | 2.1% | 14.3%(-12.2)#36 | 18.1%(-16.0)#903 |
| 37. | 07463 | 2.1% | 14.3%(-12.2)#37 | 18.1%(-15.9)#913 |
| 38. | 07843 | 2.1% | 14.3%(-12.2)#38 | 18.1%(-15.9)#914 |
| 39. | 07605 | 2.2% | 14.3%(-12.1)#39 | 18.1%(-15.8)#980 |
| 40. | 07876 | 2.2% | 14.3%(-12.0)#40 | 18.1%(-15.8)#997 |
| 41. | 07603 | 2.2% | 14.3%(-12.0)#41 | 18.1%(-15.8)#998 |
| 42. | 08092 | 2.3% | 14.3%(-12.0)#42 | 18.1%(-15.8)#1,010 |
| 43. | 08723 | 2.3% | 14.3%(-12.0)#43 | 18.1%(-15.7)#1,044 |
| 44. | 08731 | 2.3% | 14.3%(-11.9)#44 | 18.1%(-15.7)#1,047 |
| 45. | 07422 | 2.4% | 14.3%(-11.9)#45 | 18.1%(-15.7)#1,078 |
| 46. | 08844 | 2.4% | 14.3%(-11.9)#46 | 18.1%(-15.7)#1,100 |
| 47. | 08033 | 2.4% | 14.3%(-11.9)#47 | 18.1%(-15.6)#1,109 |
| 48. | 07506 | 2.4% | 14.3%(-11.8)#48 | 18.1%(-15.6)#1,124 |
| 49. | 07737 | 2.5% | 14.3%(-11.7)#49 | 18.1%(-15.5)#1,189 |
| 50. | 08872 | 2.6% | 14.3%(-11.7)#50 | 18.1%(-15.5)#1,233 |
| 51. | 07041 | 2.6% | 14.3%(-11.7)#51 | 18.1%(-15.5)#1,236 |
| 52. | 07066 | 2.7% | 14.3%(-11.6)#52 | 18.1%(-15.4)#1,267 |
| 53. | 08807 | 2.8% | 14.3%(-11.5)#53 | 18.1%(-15.3)#1,358 |
| 54. | 08043 | 3.0% | 14.3%(-11.3)#54 | 18.1%(-15.1)#1,478 |
| 55. | 08054 | 3.0% | 14.3%(-11.3)#55 | 18.1%(-15.0)#1,512 |
| 56. | 08534 | 3.1% | 14.3%(-11.2)#56 | 18.1%(-15.0)#1,544 |
| 57. | 08077 | 3.1% | 14.3%(-11.2)#57 | 18.1%(-15.0)#1,572 |
| 58. | 08053 | 3.1% | 14.3%(-11.2)#58 | 18.1%(-15.0)#1,579 |
| 59. | 07666 | 3.1% | 14.3%(-11.1)#59 | 18.1%(-14.9)#1,600 |
| 60. | 08078 | 3.1% | 14.3%(-11.1)#60 | 18.1%(-14.9)#1,603 |
| 61. | 08869 | 3.1% | 14.3%(-11.1)#61 | 18.1%(-14.9)#1,608 |
| 62. | 08876 | 3.3% | 14.3%(-11.0)#62 | 18.1%(-14.8)#1,689 |
| 63. | 07764 | 3.3% | 14.3%(-11.0)#63 | 18.1%(-14.8)#1,695 |
| 64. | 07030 | 3.3% | 14.3%(-10.9)#64 | 18.1%(-14.7)#1,732 |
| 65. | 08846 | 3.4% | 14.3%(-10.9)#65 | 18.1%(-14.7)#1,748 |
| 66. | 07410 | 3.4% | 14.3%(-10.9)#66 | 18.1%(-14.7)#1,762 |
| 67. | 07080 | 3.4% | 14.3%(-10.9)#67 | 18.1%(-14.6)#1,774 |
| 68. | 07052 | 3.4% | 14.3%(-10.9)#68 | 18.1%(-14.6)#1,778 |
| 69. | 08753 | 3.5% | 14.3%(-10.8)#69 | 18.1%(-14.6)#1,818 |
| 70. | 07023 | 3.5% | 14.3%(-10.8)#70 | 18.1%(-14.6)#1,821 |
| 71. | 08344 | 3.5% | 14.3%(-10.8)#71 | 18.1%(-14.6)#1,828 |
| 72. | 07836 | 3.5% | 14.3%(-10.8)#72 | 18.1%(-14.5)#1,833 |
| 73. | 08831 | 3.6% | 14.3%(-10.7)#73 | 18.1%(-14.5)#1,866 |
| 74. | 07840 | 3.6% | 14.3%(-10.7)#74 | 18.1%(-14.5)#1,872 |
| 75. | 08724 | 3.7% | 14.3%(-10.6)#75 | 18.1%(-14.4)#1,941 |
| 76. | 07825 | 3.7% | 14.3%(-10.6)#76 | 18.1%(-14.4)#1,947 |
| 77. | 07716 | 3.7% | 14.3%(-10.6)#77 | 18.1%(-14.4)#1,952 |
| 78. | 07024 | 3.7% | 14.3%(-10.6)#78 | 18.1%(-14.3)#1,971 |
| 79. | 07110 | 3.8% | 14.3%(-10.5)#79 | 18.1%(-14.3)#1,997 |
| 80. | 07071 | 3.8% | 14.3%(-10.5)#80 | 18.1%(-14.3)#1,999 |
| 81. | 07731 | 3.8% | 14.3%(-10.5)#81 | 18.1%(-14.2)#2,044 |
| 82. | 08555 | 3.8% | 14.3%(-10.4)#82 | 18.1%(-14.2)#2,064 |
| 83. | 08063 | 3.9% | 14.3%(-10.3)#83 | 18.1%(-14.1)#2,121 |
| 84. | 08051 | 4.0% | 14.3%(-10.3)#84 | 18.1%(-14.1)#2,185 |
| 85. | 08106 | 4.1% | 14.3%(-10.2)#85 | 18.1%(-14.0)#2,216 |
| 86. | 08015 | 4.1% | 14.3%(-10.2)#86 | 18.1%(-14.0)#2,249 |
| 87. | 08809 | 4.1% | 14.3%(-10.2)#87 | 18.1%(-13.9)#2,270 |
| 88. | 08502 | 4.2% | 14.3%(-10.1)#88 | 18.1%(-13.9)#2,294 |
| 89. | 08204 | 4.2% | 14.3%(-10.1)#89 | 18.1%(-13.9)#2,350 |
| 90. | 07722 | 4.3% | 14.3%(-10.0)#90 | 18.1%(-13.8)#2,388 |
| 91. | 07302 | 4.3% | 14.3%(-9.99)#91 | 18.1%(-13.8)#2,398 |
| 92. | 08852 | 4.3% | 14.3%(-9.98)#92 | 18.1%(-13.8)#2,403 |
| 93. | 07869 | 4.3% | 14.3%(-9.96)#93 | 18.1%(-13.7)#2,421 |
| 94. | 08854 | 4.3% | 14.3%(-9.94)#94 | 18.1%(-13.7)#2,436 |
| 95. | 07054 | 4.4% | 14.3%(-9.91)#95 | 18.1%(-13.7)#2,463 |
| 96. | 08515 | 4.4% | 14.3%(-9.90)#96 | 18.1%(-13.7)#2,469 |
| 97. | 07070 | 4.6% | 14.3%(-9.68)#97 | 18.1%(-13.5)#2,639 |
| 98. | 07083 | 4.6% | 14.3%(-9.66)#98 | 18.1%(-13.4)#2,648 |
| 99. | 07711 | 4.6% | 14.3%(-9.65)#99 | 18.1%(-13.4)#2,652 |
| 100. | 07874 | 4.7% | 14.3%(-9.60)#100 | 18.1%(-13.4)#2,681 |
Common Questions
What are the Top 10 Zip Codes with the Lowest Poverty Level Among Children Under the Age of 5 in New Jersey?
Top 10 Zip Codes with the Lowest Poverty Level Among Children Under the Age of 5 in New Jersey are:
What zip code has the Lowest Poverty Level Among Children Under the Age of 5 in New Jersey?
07090 has the Lowest Poverty Level Among Children Under the Age of 5 in New Jersey with 0.22%.
What is the Poverty Level Among Children Under the Age of 5 in the State of New Jersey?
Poverty Level Among Children Under the Age of 5 in New Jersey is 14.3%.
What is the Poverty Level Among Children Under the Age of 5 in the United States?
Poverty Level Among Children Under the Age of 5 in the United States is 18.1%.