Ramtown, NJ Map & Demographics
Ramtown Map
Ramtown Overview
$45,392
PER CAPITA INCOME
$123,750
AVG FAMILY INCOME
$123,250
AVG HOUSEHOLD INCOME
15.9%
WAGE / INCOME GAP [ % ]
84.1¢/ $1
WAGE / INCOME GAP [ $ ]
0.33
INEQUALITY / GINI INDEX
6,506
TOTAL POPULATION
3,190
MALE POPULATION
3,316
FEMALE POPULATION
96.20
MALES / 100 FEMALES
103.95
FEMALES / 100 MALES
37.8
MEDIAN AGE
3.3
AVG FAMILY SIZE
3.0
AVG HOUSEHOLD SIZE
3,482
LABOR FORCE [ PEOPLE ]
70.1%
PERCENT IN LABOR FORCE
3.5%
UNEMPLOYMENT RATE
Income in Ramtown
Income Overview in Ramtown
Per Capita Income in Ramtown is $45,392, while median incomes of families and households are $123,750 and $123,250 respectively.
| Characteristic | Number | Measure |
| Per Capita Income | 6,506 | $45,392 |
| Median Family Income | 1,795 | $123,750 |
| Mean Family Income | 1,795 | $143,085 |
| Median Household Income | 2,143 | $123,250 |
| Mean Household Income | 2,143 | $137,762 |
| Income Deficit | 1,795 | $0 |
| Wage / Income Gap (%) | 6,506 | 15.88% |
| Wage / Income Gap ($) | 6,506 | 84.12¢ per $1 |
| Gini / Inequality Index | 6,506 | 0.33 |
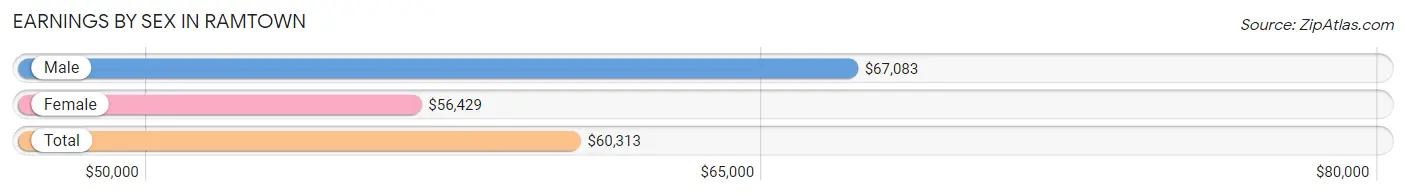
Earnings by Sex in Ramtown
Average Earnings in Ramtown are $60,313, $67,083 for men and $56,429 for women, a difference of 15.9%.
| Sex | Number | Average Earnings |
| Male | 1,843 (51.2%) | $67,083 |
| Female | 1,758 (48.8%) | $56,429 |
| Total | 3,601 (100.0%) | $60,313 |
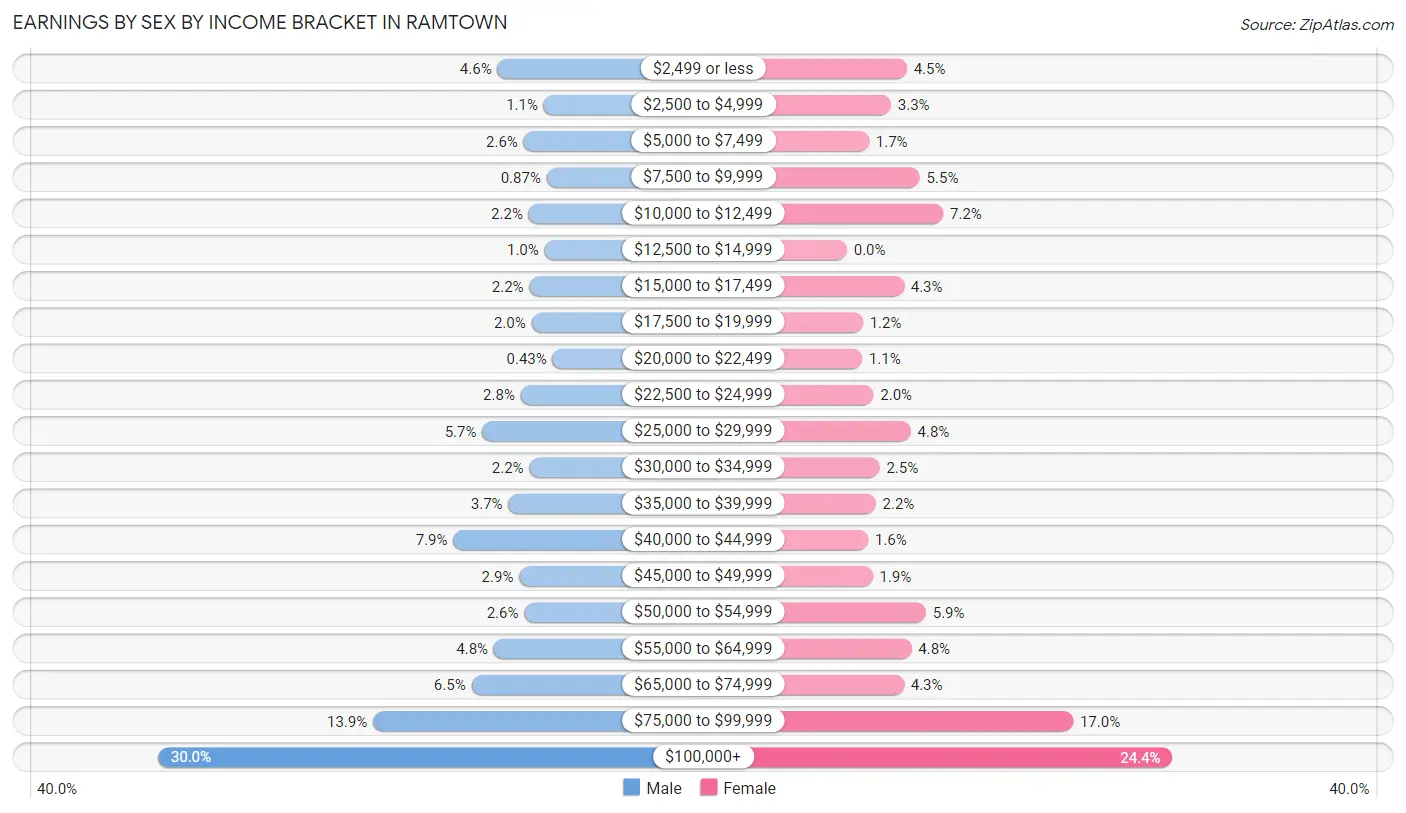
Earnings by Sex by Income Bracket in Ramtown
The most common earnings brackets in Ramtown are $100,000+ for men (553 | 30.0%) and $100,000+ for women (429 | 24.4%).
| Income | Male | Female |
| $2,499 or less | 84 (4.6%) | 79 (4.5%) |
| $2,500 to $4,999 | 20 (1.1%) | 58 (3.3%) |
| $5,000 to $7,499 | 48 (2.6%) | 29 (1.7%) |
| $7,500 to $9,999 | 16 (0.9%) | 96 (5.5%) |
| $10,000 to $12,499 | 41 (2.2%) | 127 (7.2%) |
| $12,500 to $14,999 | 19 (1.0%) | 0 (0.0%) |
| $15,000 to $17,499 | 40 (2.2%) | 75 (4.3%) |
| $17,500 to $19,999 | 37 (2.0%) | 21 (1.2%) |
| $20,000 to $22,499 | 8 (0.4%) | 20 (1.1%) |
| $22,500 to $24,999 | 52 (2.8%) | 35 (2.0%) |
| $25,000 to $29,999 | 105 (5.7%) | 84 (4.8%) |
| $30,000 to $34,999 | 40 (2.2%) | 43 (2.5%) |
| $35,000 to $39,999 | 69 (3.7%) | 38 (2.2%) |
| $40,000 to $44,999 | 145 (7.9%) | 28 (1.6%) |
| $45,000 to $49,999 | 54 (2.9%) | 34 (1.9%) |
| $50,000 to $54,999 | 47 (2.5%) | 104 (5.9%) |
| $55,000 to $64,999 | 89 (4.8%) | 85 (4.8%) |
| $65,000 to $74,999 | 120 (6.5%) | 75 (4.3%) |
| $75,000 to $99,999 | 256 (13.9%) | 298 (17.0%) |
| $100,000+ | 553 (30.0%) | 429 (24.4%) |
| Total | 1,843 (100.0%) | 1,758 (100.0%) |
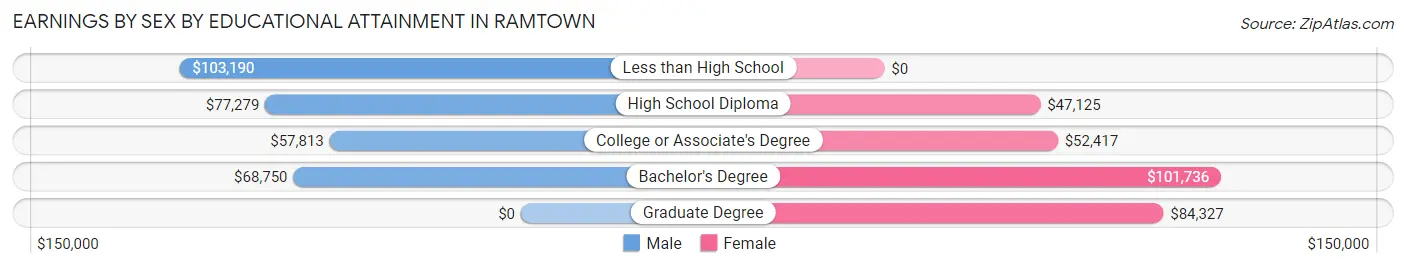
Earnings by Sex by Educational Attainment in Ramtown
Average earnings in Ramtown are $73,993 for men and $74,293 for women, a difference of 0.4%. Men with an educational attainment of less than high school enjoy the highest average annual earnings of $103,190, while those with college or associate's degree education earn the least with $57,813. Women with an educational attainment of bachelor's degree earn the most with the average annual earnings of $101,736, while those with high school diploma education have the smallest earnings of $47,125.
| Educational Attainment | Male Income | Female Income |
| Less than High School | $103,190 | $0 |
| High School Diploma | $77,279 | $47,125 |
| College or Associate's Degree | $57,813 | $52,417 |
| Bachelor's Degree | $68,750 | $101,736 |
| Graduate Degree | - | - |
| Total | $73,993 | $74,293 |
Family Income in Ramtown
Family Income Brackets in Ramtown
According to the Ramtown family income data, there are 547 families falling into the $100,000 to $149,999 income range, which is the most common income bracket and makes up 30.5% of all families.
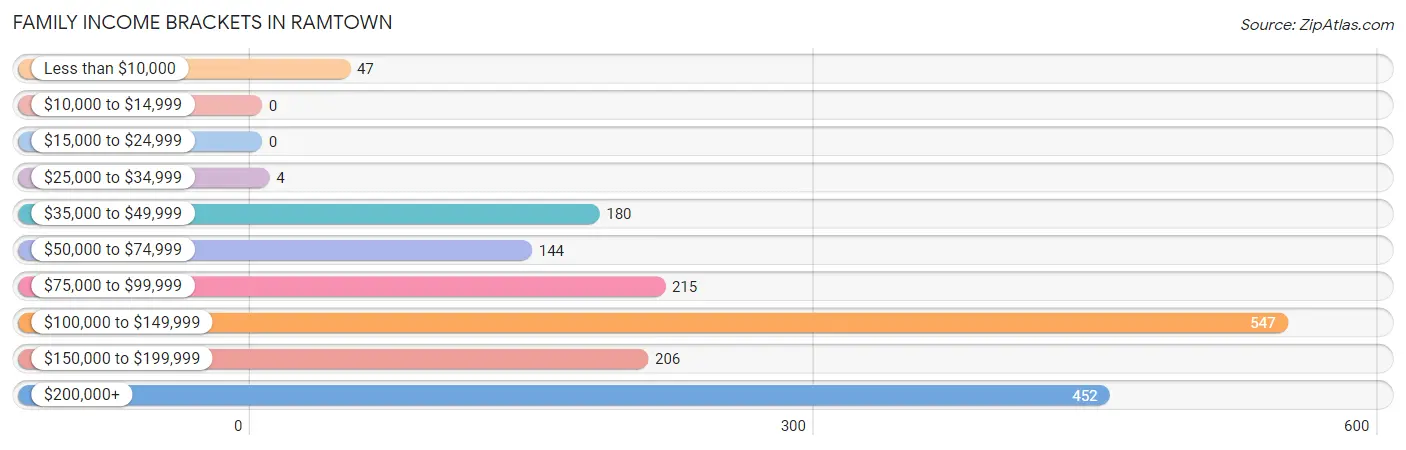
| Income Bracket | # Families | % Families |
| Less than $10,000 | 47 | 2.6% |
| $10,000 to $14,999 | 0 | 0.0% |
| $15,000 to $24,999 | 0 | 0.0% |
| $25,000 to $34,999 | 4 | 0.2% |
| $35,000 to $49,999 | 180 | 10.0% |
| $50,000 to $74,999 | 144 | 8.0% |
| $75,000 to $99,999 | 215 | 12.0% |
| $100,000 to $149,999 | 547 | 30.5% |
| $150,000 to $199,999 | 206 | 11.5% |
| $200,000+ | 452 | 25.2% |
Family Income by Famaliy Size in Ramtown
3-person families (276 | 15.4%) account for the highest median family income in Ramtown with $144,338 per family, while 2-person families (724 | 40.3%) have the highest median income of $53,472 per family member.
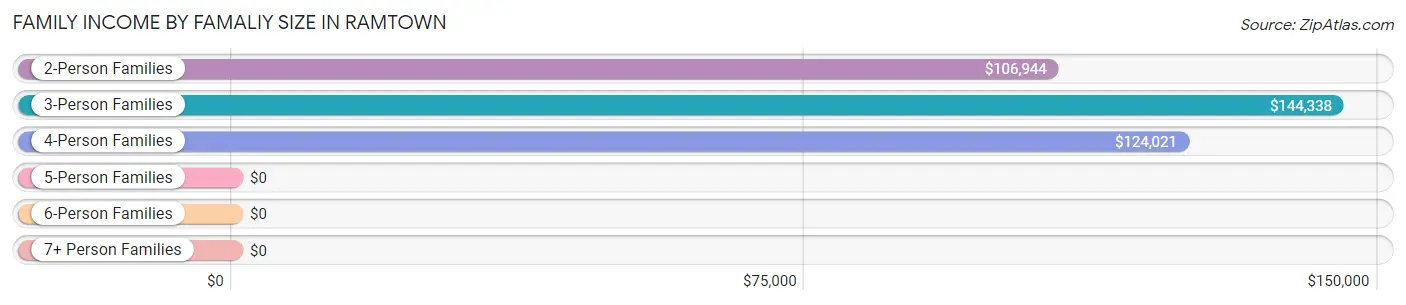
| Income Bracket | # Families | Median Income |
| 2-Person Families | 724 (40.3%) | $106,944 |
| 3-Person Families | 276 (15.4%) | $144,338 |
| 4-Person Families | 521 (29.0%) | $124,021 |
| 5-Person Families | 192 (10.7%) | $0 |
| 6-Person Families | 34 (1.9%) | $0 |
| 7+ Person Families | 48 (2.7%) | $0 |
| Total | 1,795 (100.0%) | $123,750 |
Family Income by Number of Earners in Ramtown
The median family income in Ramtown is $123,750, with families comprising 3+ earners (315) having the highest median family income of $204,250, while families with no earners (170) have the lowest median family income of $59,071, accounting for 17.5% and 9.5% of families, respectively.
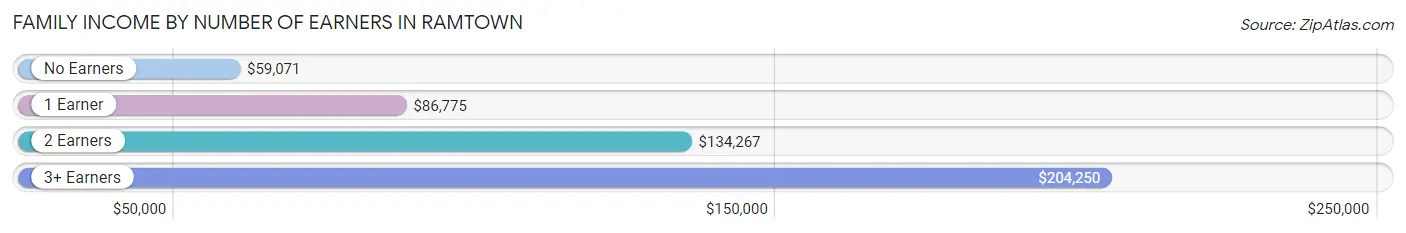
| Number of Earners | # Families | Median Income |
| No Earners | 170 (9.5%) | $59,071 |
| 1 Earner | 475 (26.5%) | $86,775 |
| 2 Earners | 835 (46.5%) | $134,267 |
| 3+ Earners | 315 (17.5%) | $204,250 |
| Total | 1,795 (100.0%) | $123,750 |
Household Income in Ramtown
Household Income Brackets in Ramtown
With 709 households falling in the category, the $100,000 to $149,999 income range is the most frequent in Ramtown, accounting for 33.1% of all households.
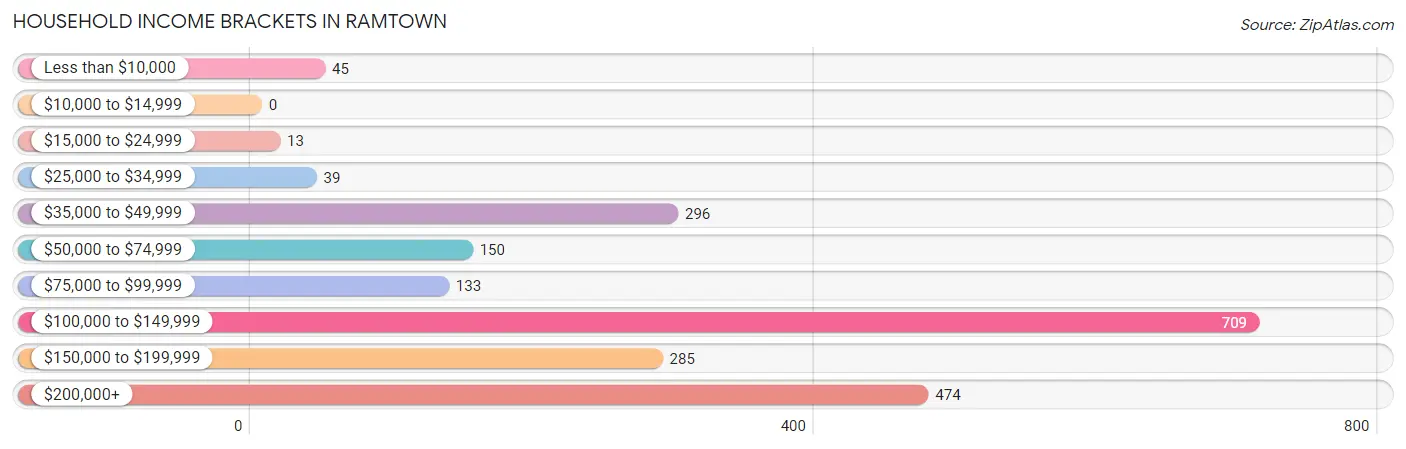
| Income Bracket | # Households | % Households |
| Less than $10,000 | 45 | 2.1% |
| $10,000 to $14,999 | 0 | 0.0% |
| $15,000 to $24,999 | 13 | 0.6% |
| $25,000 to $34,999 | 39 | 1.8% |
| $35,000 to $49,999 | 296 | 13.8% |
| $50,000 to $74,999 | 150 | 7.0% |
| $75,000 to $99,999 | 133 | 6.2% |
| $100,000 to $149,999 | 709 | 33.1% |
| $150,000 to $199,999 | 285 | 13.3% |
| $200,000+ | 474 | 22.1% |
Household Income by Householder Age in Ramtown
The median household income in Ramtown is $123,250, with the highest median household income of $155,093 found in the 25 to 44 years age bracket for the primary householder. A total of 558 households (26.0%) fall into this category.
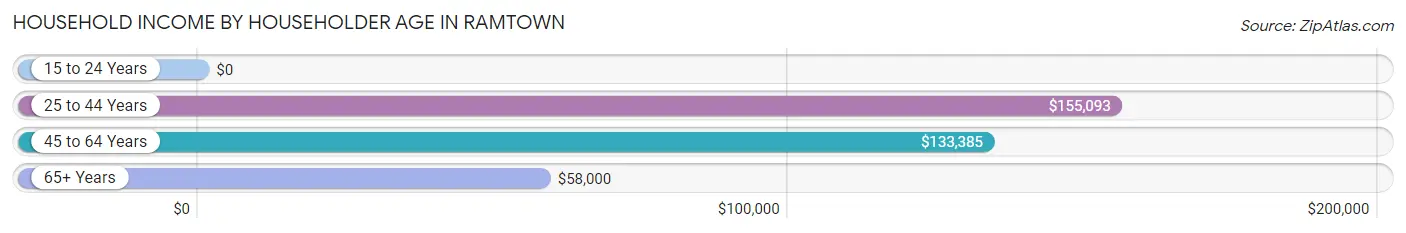
| Income Bracket | # Households | Median Income |
| 15 to 24 Years | 0 (0.0%) | $0 |
| 25 to 44 Years | 558 (26.0%) | $155,093 |
| 45 to 64 Years | 1,133 (52.9%) | $133,385 |
| 65+ Years | 452 (21.1%) | $58,000 |
| Total | 2,143 (100.0%) | $123,250 |
Poverty in Ramtown
Income Below Poverty by Sex and Age in Ramtown
With 2.5% poverty level for males and 4.3% for females among the residents of Ramtown, 35 to 44 year old males and 35 to 44 year old females are the most vulnerable to poverty, with 33 males (8.7%) and 68 females (17.7%) in their respective age groups living below the poverty level.
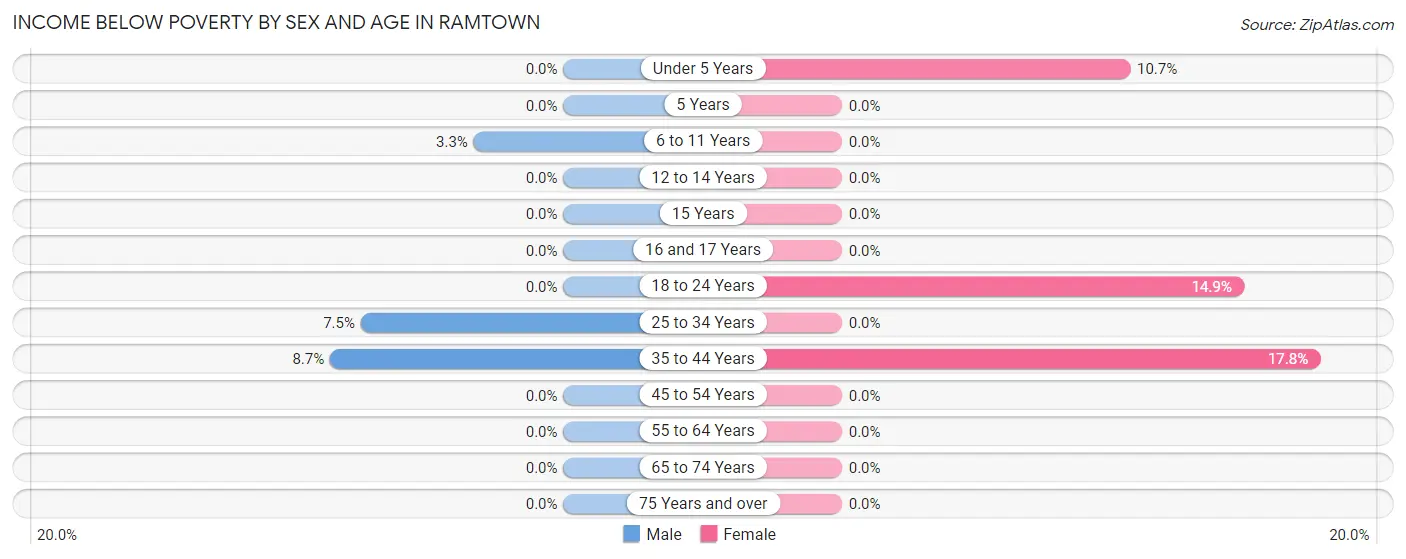
| Age Bracket | Male | Female |
| Under 5 Years | 0 (0.0%) | 29 (10.7%) |
| 5 Years | 0 (0.0%) | 0 (0.0%) |
| 6 to 11 Years | 14 (3.3%) | 0 (0.0%) |
| 12 to 14 Years | 0 (0.0%) | 0 (0.0%) |
| 15 Years | 0 (0.0%) | 0 (0.0%) |
| 16 and 17 Years | 0 (0.0%) | 0 (0.0%) |
| 18 to 24 Years | 0 (0.0%) | 44 (14.9%) |
| 25 to 34 Years | 31 (7.5%) | 0 (0.0%) |
| 35 to 44 Years | 33 (8.7%) | 68 (17.7%) |
| 45 to 54 Years | 0 (0.0%) | 0 (0.0%) |
| 55 to 64 Years | 0 (0.0%) | 0 (0.0%) |
| 65 to 74 Years | 0 (0.0%) | 0 (0.0%) |
| 75 Years and over | 0 (0.0%) | 0 (0.0%) |
| Total | 78 (2.5%) | 141 (4.3%) |
Income Above Poverty by Sex and Age in Ramtown
According to the poverty statistics in Ramtown, males aged under 5 years and females aged 6 to 11 years are the age groups that are most secure financially, with 100.0% of males and 100.0% of females in these age groups living above the poverty line.
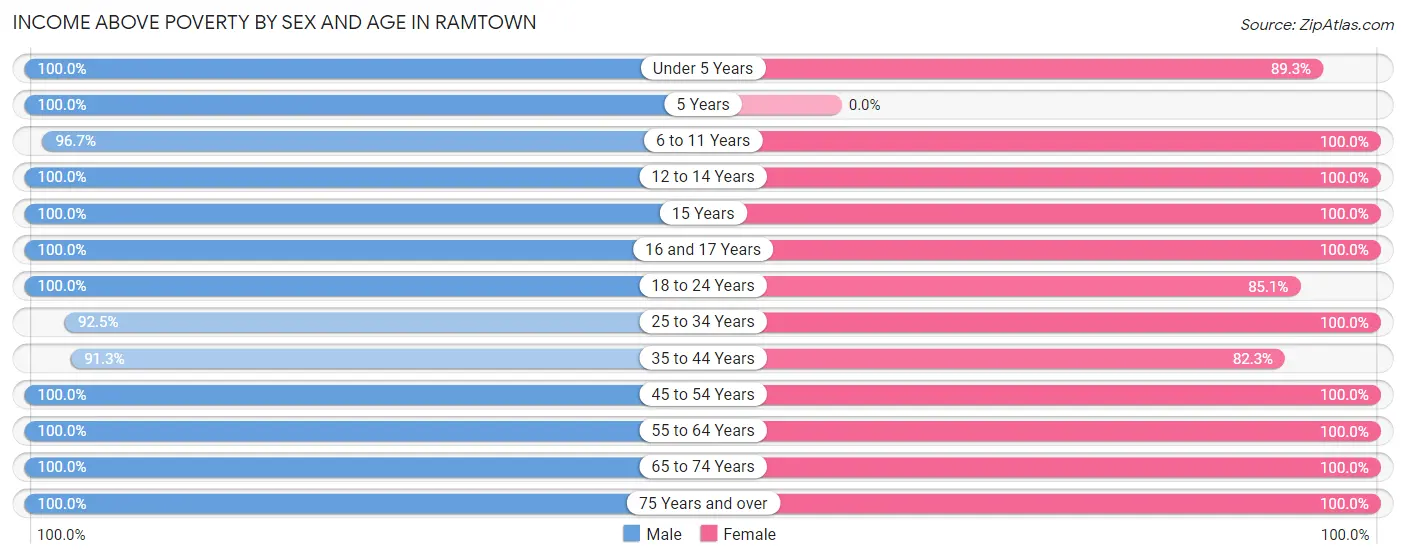
| Age Bracket | Male | Female |
| Under 5 Years | 133 (100.0%) | 242 (89.3%) |
| 5 Years | 10 (100.0%) | 0 (0.0%) |
| 6 to 11 Years | 407 (96.7%) | 230 (100.0%) |
| 12 to 14 Years | 202 (100.0%) | 154 (100.0%) |
| 15 Years | 107 (100.0%) | 11 (100.0%) |
| 16 and 17 Years | 89 (100.0%) | 119 (100.0%) |
| 18 to 24 Years | 184 (100.0%) | 251 (85.1%) |
| 25 to 34 Years | 381 (92.5%) | 301 (100.0%) |
| 35 to 44 Years | 348 (91.3%) | 315 (82.3%) |
| 45 to 54 Years | 492 (100.0%) | 721 (100.0%) |
| 55 to 64 Years | 429 (100.0%) | 364 (100.0%) |
| 65 to 74 Years | 261 (100.0%) | 279 (100.0%) |
| 75 Years and over | 69 (100.0%) | 188 (100.0%) |
| Total | 3,112 (97.6%) | 3,175 (95.8%) |
Income Below Poverty Among Married-Couple Families in Ramtown
The poverty statistics for married-couple families in Ramtown show that 2.1% or 31 of the total 1,451 families live below the poverty line. Families with 1 or 2 children have the highest poverty rate of 5.0%, comprising of 31 families. On the other hand, families with no children have the lowest poverty rate of 0.0%, which includes 0 families.
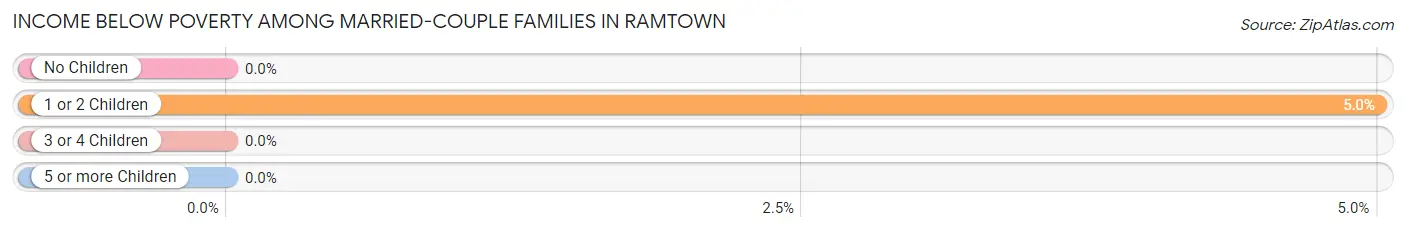
| Children | Above Poverty | Below Poverty |
| No Children | 686 (100.0%) | 0 (0.0%) |
| 1 or 2 Children | 589 (95.0%) | 31 (5.0%) |
| 3 or 4 Children | 118 (100.0%) | 0 (0.0%) |
| 5 or more Children | 27 (100.0%) | 0 (0.0%) |
| Total | 1,420 (97.9%) | 31 (2.1%) |
Income Below Poverty Among Single-Parent Households in Ramtown
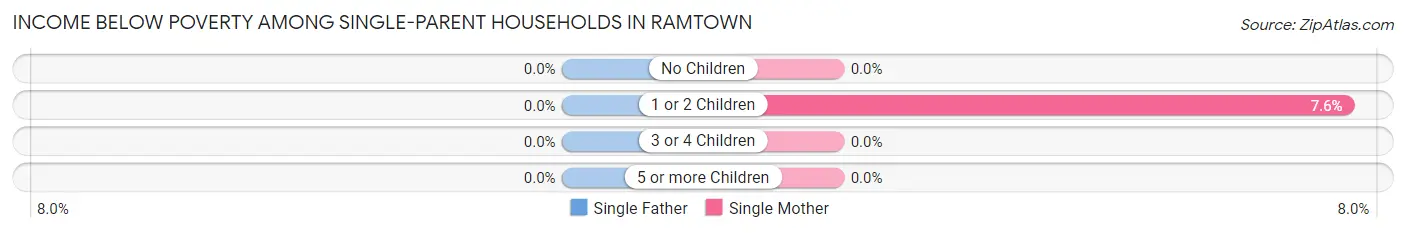
| Children | Single Father | Single Mother |
| No Children | 0 (0.0%) | 0 (0.0%) |
| 1 or 2 Children | 0 (0.0%) | 15 (7.6%) |
| 3 or 4 Children | 0 (0.0%) | 0 (0.0%) |
| 5 or more Children | 0 (0.0%) | 0 (0.0%) |
| Total | 0 (0.0%) | 15 (4.7%) |
Income Below Poverty Among Married-Couple vs Single-Parent Households in Ramtown
The poverty data for Ramtown shows that 31 of the married-couple family households (2.1%) and 15 of the single-parent households (4.4%) are living below the poverty level. Within the married-couple family households, those with 1 or 2 children have the highest poverty rate, with 31 households (5.0%) falling below the poverty line. Among the single-parent households, those with 1 or 2 children have the highest poverty rate, with 15 household (7.6%) living below poverty.
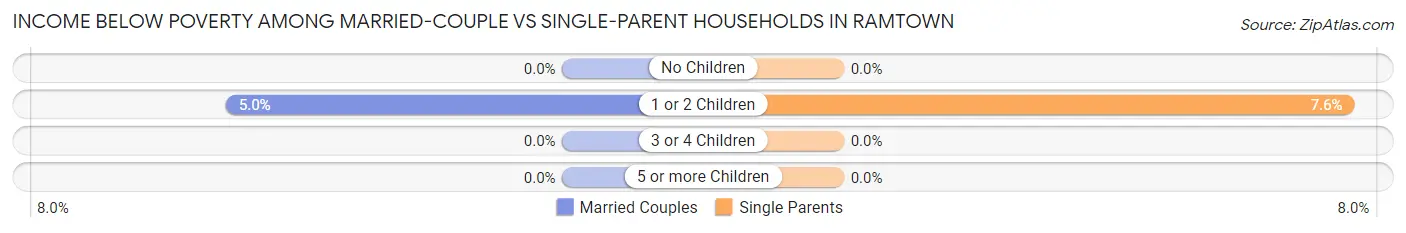
| Children | Married-Couple Families | Single-Parent Households |
| No Children | 0 (0.0%) | 0 (0.0%) |
| 1 or 2 Children | 31 (5.0%) | 15 (7.6%) |
| 3 or 4 Children | 0 (0.0%) | 0 (0.0%) |
| 5 or more Children | 0 (0.0%) | 0 (0.0%) |
| Total | 31 (2.1%) | 15 (4.4%) |
Race in Ramtown
The most populous races in Ramtown are White / Caucasian (5,232 | 80.4%), Hispanic or Latino (1,276 | 19.6%), and Two or more Races (749 | 11.5%).
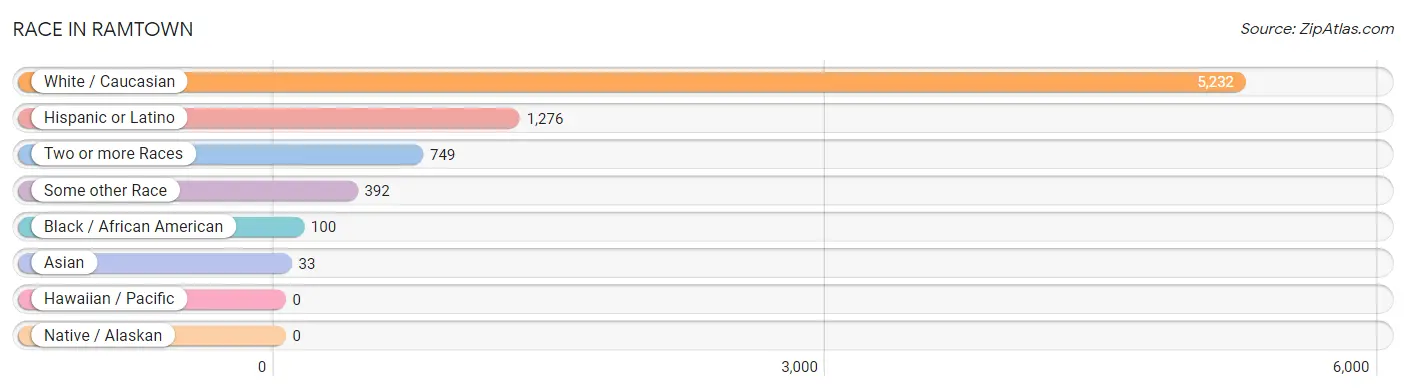
| Race | # Population | % Population |
| Asian | 33 | 0.5% |
| Black / African American | 100 | 1.5% |
| Hawaiian / Pacific | 0 | 0.0% |
| Hispanic or Latino | 1,276 | 19.6% |
| Native / Alaskan | 0 | 0.0% |
| White / Caucasian | 5,232 | 80.4% |
| Two or more Races | 749 | 11.5% |
| Some other Race | 392 | 6.0% |
| Total | 6,506 | 100.0% |
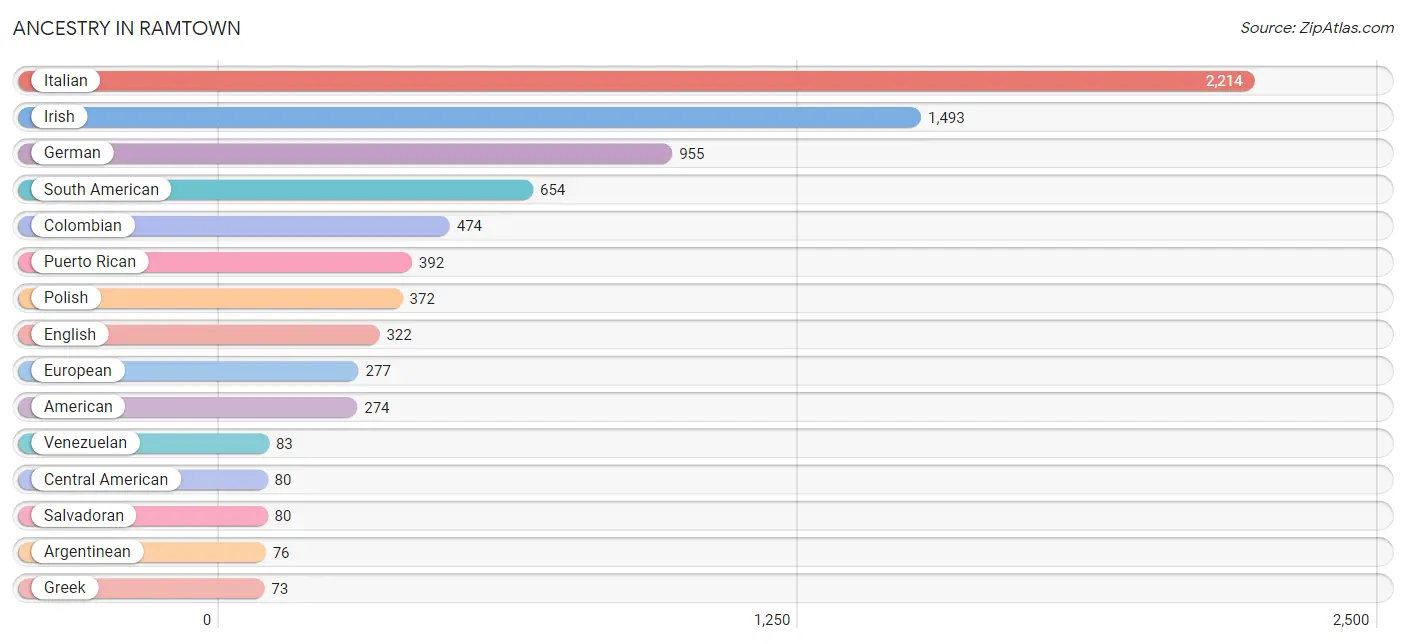
Ancestry in Ramtown
The most populous ancestries reported in Ramtown are Italian (2,214 | 34.0%), Irish (1,493 | 23.0%), German (955 | 14.7%), South American (654 | 10.1%), and Colombian (474 | 7.3%), together accounting for 89.0% of all Ramtown residents.
| Ancestry | # Population | % Population |
| American | 274 | 4.2% |
| Argentinean | 76 | 1.2% |
| British | 41 | 0.6% |
| Burmese | 8 | 0.1% |
| Canadian | 11 | 0.2% |
| Central American | 80 | 1.2% |
| Colombian | 474 | 7.3% |
| Czechoslovakian | 5 | 0.1% |
| Dominican | 66 | 1.0% |
| Dutch | 59 | 0.9% |
| English | 322 | 5.0% |
| European | 277 | 4.3% |
| French | 8 | 0.1% |
| French Canadian | 9 | 0.1% |
| German | 955 | 14.7% |
| Greek | 73 | 1.1% |
| Hungarian | 29 | 0.4% |
| Irish | 1,493 | 23.0% |
| Italian | 2,214 | 34.0% |
| Jamaican | 34 | 0.5% |
| Lithuanian | 22 | 0.3% |
| Mexican | 9 | 0.1% |
| Polish | 372 | 5.7% |
| Portuguese | 53 | 0.8% |
| Puerto Rican | 392 | 6.0% |
| Romanian | 12 | 0.2% |
| Russian | 38 | 0.6% |
| Salvadoran | 80 | 1.2% |
| Scotch-Irish | 60 | 0.9% |
| Scottish | 48 | 0.7% |
| Slavic | 7 | 0.1% |
| Slovak | 22 | 0.3% |
| South American | 654 | 10.1% |
| Spaniard | 48 | 0.7% |
| Spanish | 27 | 0.4% |
| Thai | 41 | 0.6% |
| Ukrainian | 16 | 0.3% |
| Uruguayan | 21 | 0.3% |
| Venezuelan | 83 | 1.3% |
| West Indian | 37 | 0.6% | View All 40 Rows |
Immigrants in Ramtown
The most numerous immigrant groups reported in Ramtown came from Latin America (644 | 9.9%), South America (433 | 6.7%), Colombia (305 | 4.7%), Caribbean (177 | 2.7%), and Dominican Republic (143 | 2.2%), together accounting for 26.2% of all Ramtown residents.
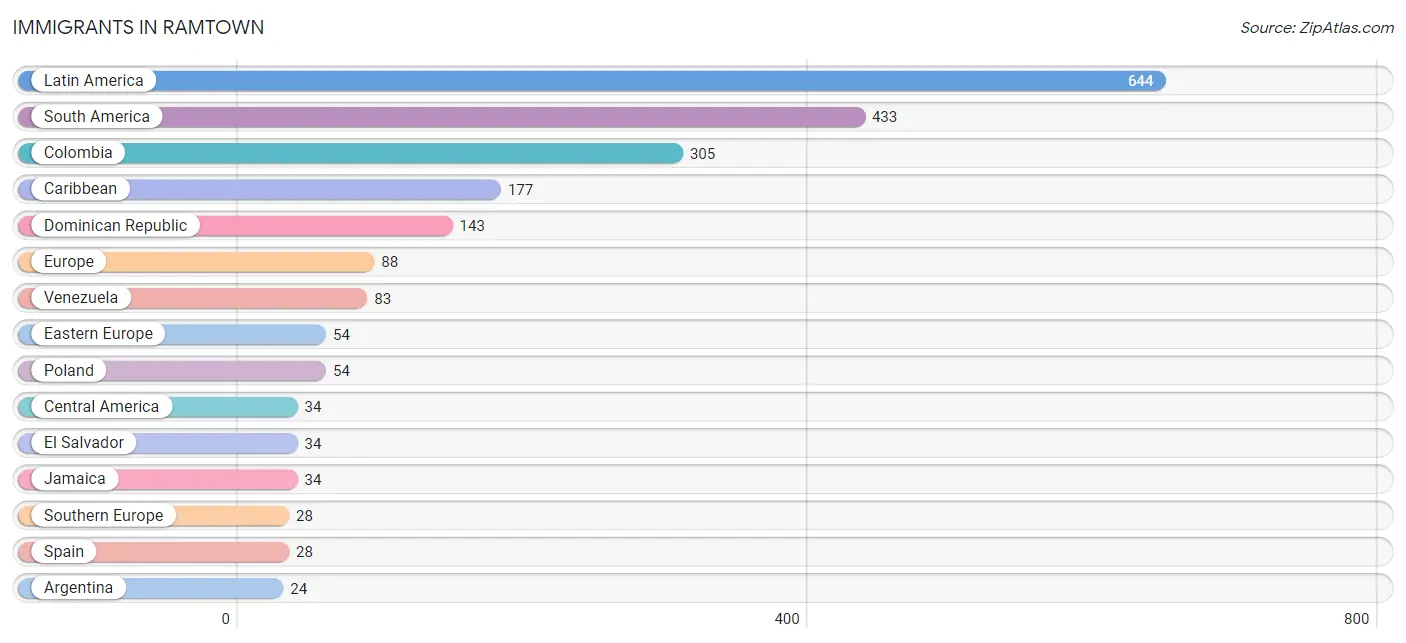
| Immigration Origin | # Population | % Population |
| Argentina | 24 | 0.4% |
| Asia | 20 | 0.3% |
| Caribbean | 177 | 2.7% |
| Central America | 34 | 0.5% |
| Colombia | 305 | 4.7% |
| Dominican Republic | 143 | 2.2% |
| Eastern Asia | 8 | 0.1% |
| Eastern Europe | 54 | 0.8% |
| El Salvador | 34 | 0.5% |
| Europe | 88 | 1.3% |
| Germany | 6 | 0.1% |
| India | 12 | 0.2% |
| Jamaica | 34 | 0.5% |
| Korea | 8 | 0.1% |
| Latin America | 644 | 9.9% |
| Poland | 54 | 0.8% |
| South America | 433 | 6.7% |
| South Central Asia | 12 | 0.2% |
| Southern Europe | 28 | 0.4% |
| Spain | 28 | 0.4% |
| Uruguay | 21 | 0.3% |
| Venezuela | 83 | 1.3% |
| Western Europe | 6 | 0.1% | View All 23 Rows |
Sex and Age in Ramtown
Sex and Age in Ramtown
The most populous age groups in Ramtown are 10 to 14 Years (428 | 13.4%) for men and 45 to 49 Years (425 | 12.8%) for women.
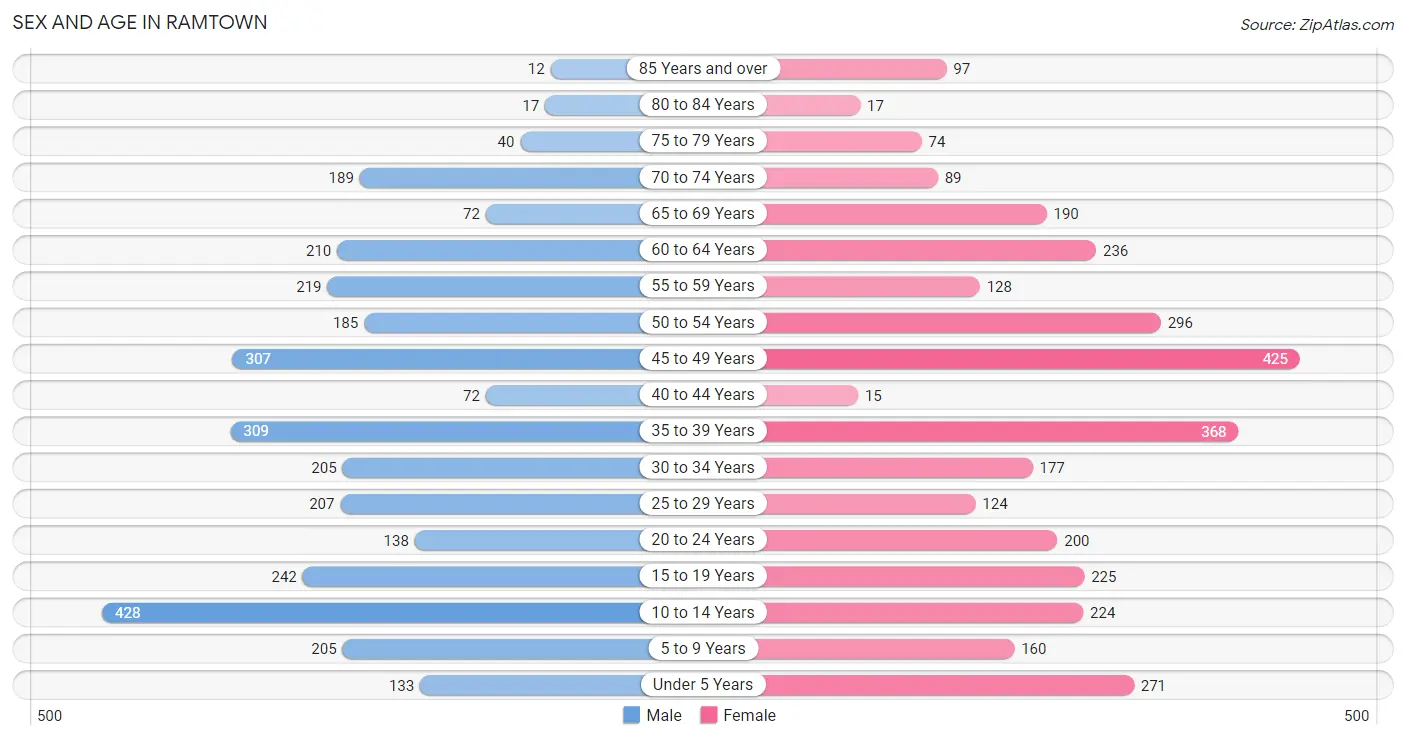
| Age Bracket | Male | Female |
| Under 5 Years | 133 (4.2%) | 271 (8.2%) |
| 5 to 9 Years | 205 (6.4%) | 160 (4.8%) |
| 10 to 14 Years | 428 (13.4%) | 224 (6.8%) |
| 15 to 19 Years | 242 (7.6%) | 225 (6.8%) |
| 20 to 24 Years | 138 (4.3%) | 200 (6.0%) |
| 25 to 29 Years | 207 (6.5%) | 124 (3.7%) |
| 30 to 34 Years | 205 (6.4%) | 177 (5.3%) |
| 35 to 39 Years | 309 (9.7%) | 368 (11.1%) |
| 40 to 44 Years | 72 (2.3%) | 15 (0.4%) |
| 45 to 49 Years | 307 (9.6%) | 425 (12.8%) |
| 50 to 54 Years | 185 (5.8%) | 296 (8.9%) |
| 55 to 59 Years | 219 (6.9%) | 128 (3.9%) |
| 60 to 64 Years | 210 (6.6%) | 236 (7.1%) |
| 65 to 69 Years | 72 (2.3%) | 190 (5.7%) |
| 70 to 74 Years | 189 (5.9%) | 89 (2.7%) |
| 75 to 79 Years | 40 (1.3%) | 74 (2.2%) |
| 80 to 84 Years | 17 (0.5%) | 17 (0.5%) |
| 85 Years and over | 12 (0.4%) | 97 (2.9%) |
| Total | 3,190 (100.0%) | 3,316 (100.0%) |
Families and Households in Ramtown
Median Family Size in Ramtown
The median family size in Ramtown is 3.33 persons per family, with married-couple families (1,451 | 80.8%) accounting for the largest median family size of 3.49 persons per family. On the other hand, single female/mother families (317 | 17.7%) represent the smallest median family size with 2.60 persons per family.
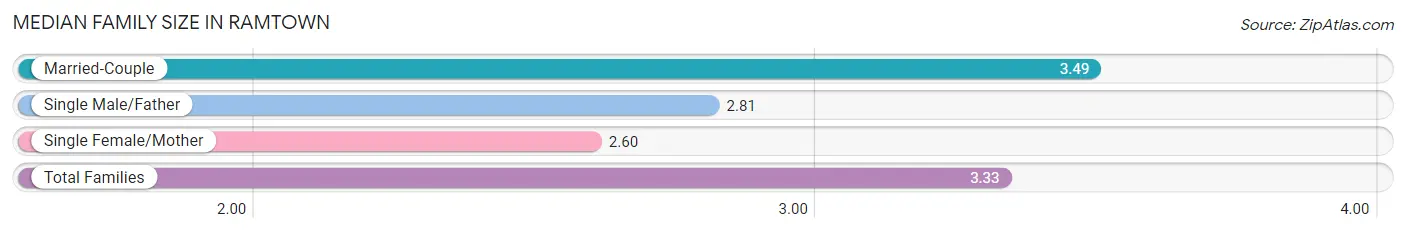
| Family Type | # Families | Family Size |
| Married-Couple | 1,451 (80.8%) | 3.49 |
| Single Male/Father | 27 (1.5%) | 2.81 |
| Single Female/Mother | 317 (17.7%) | 2.60 |
| Total Families | 1,795 (100.0%) | 3.33 |
Median Household Size in Ramtown
The median household size in Ramtown is 3.04 persons per household, with married-couple households (1,451 | 67.7%) accounting for the largest median household size of 3.52 persons per household. non-family households (348 | 16.2%) represent the smallest median household size with 1.19 persons per household.
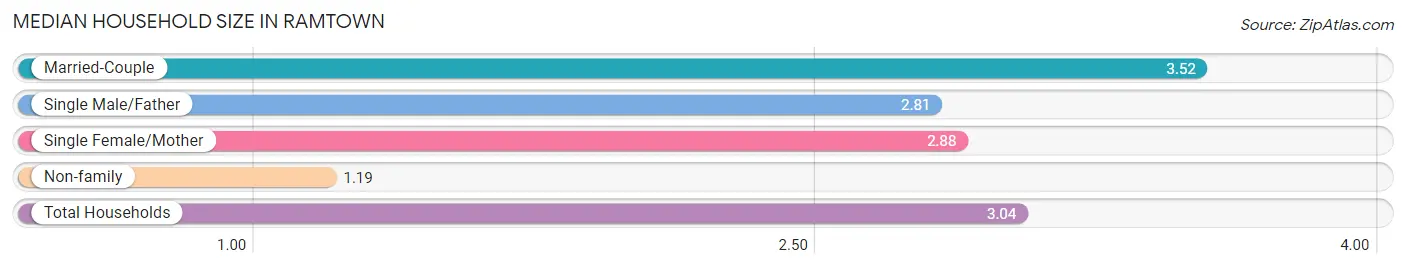
| Household Type | # Households | Household Size |
| Married-Couple | 1,451 (67.7%) | 3.52 |
| Single Male/Father | 27 (1.3%) | 2.81 |
| Single Female/Mother | 317 (14.8%) | 2.88 |
| Non-family | 348 (16.2%) | 1.19 |
| Total Households | 2,143 (100.0%) | 3.04 |
Household Size by Marriage Status in Ramtown
Out of a total of 2,143 households in Ramtown, 1,795 (83.8%) are family households, while 348 (16.2%) are nonfamily households. The most numerous type of family households are 2-person households, comprising 643, and the most common type of nonfamily households are 1-person households, comprising 270.
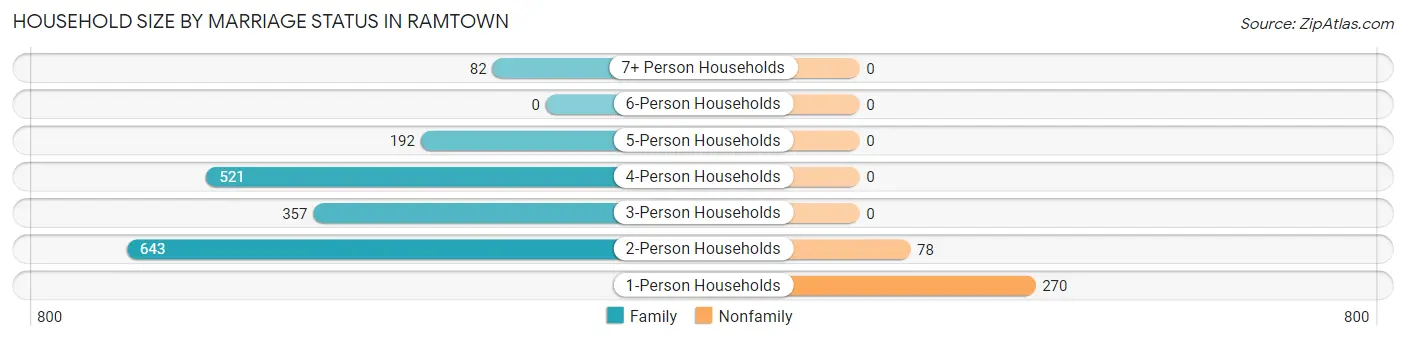
| Household Size | Family Households | Nonfamily Households |
| 1-Person Households | - | 270 (12.6%) |
| 2-Person Households | 643 (30.0%) | 78 (3.6%) |
| 3-Person Households | 357 (16.7%) | 0 (0.0%) |
| 4-Person Households | 521 (24.3%) | 0 (0.0%) |
| 5-Person Households | 192 (9.0%) | 0 (0.0%) |
| 6-Person Households | 0 (0.0%) | 0 (0.0%) |
| 7+ Person Households | 82 (3.8%) | 0 (0.0%) |
| Total | 1,795 (83.8%) | 348 (16.2%) |
Female Fertility in Ramtown
Fertility by Age in Ramtown
Average fertility rate in Ramtown is 51.0 births per 1,000 women. Women in the age bracket of 20 to 34 years have the highest fertility rate with 146.0 births per 1,000 women. Women in the age bracket of 20 to 34 years acount for 91.2% of all women with births.
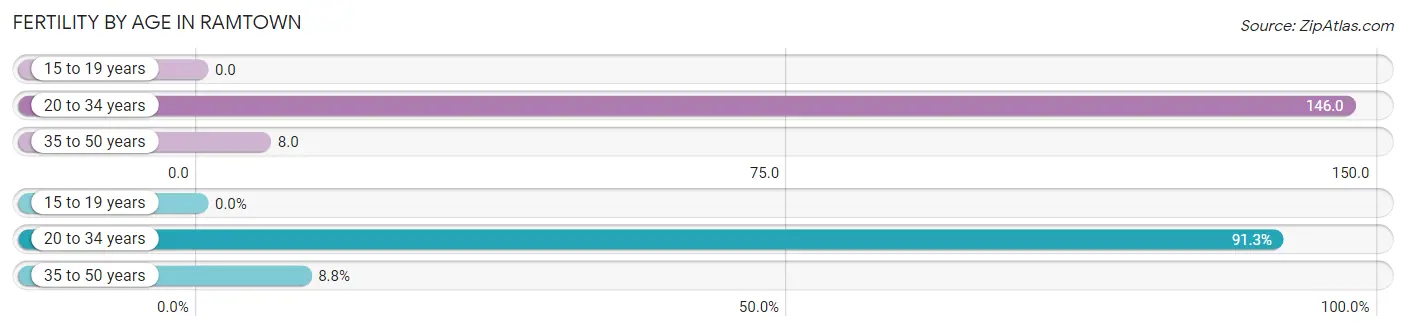
| Age Bracket | Women with Births | Births / 1,000 Women |
| 15 to 19 years | 0 (0.0%) | 0.0 |
| 20 to 34 years | 73 (91.2%) | 146.0 |
| 35 to 50 years | 7 (8.7%) | 8.0 |
| Total | 80 (100.0%) | 51.0 |
Fertility by Age by Marriage Status in Ramtown
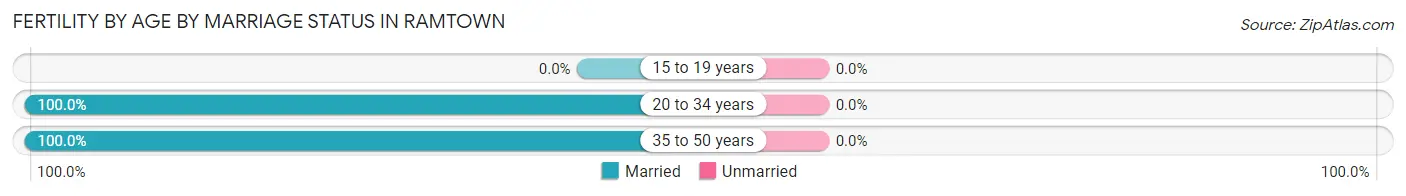
| Age Bracket | Married | Unmarried |
| 15 to 19 years | 0 (0.0%) | 0 (0.0%) |
| 20 to 34 years | 73 (100.0%) | 0 (0.0%) |
| 35 to 50 years | 7 (100.0%) | 0 (0.0%) |
| Total | 80 (100.0%) | 0 (0.0%) |
Fertility by Education in Ramtown
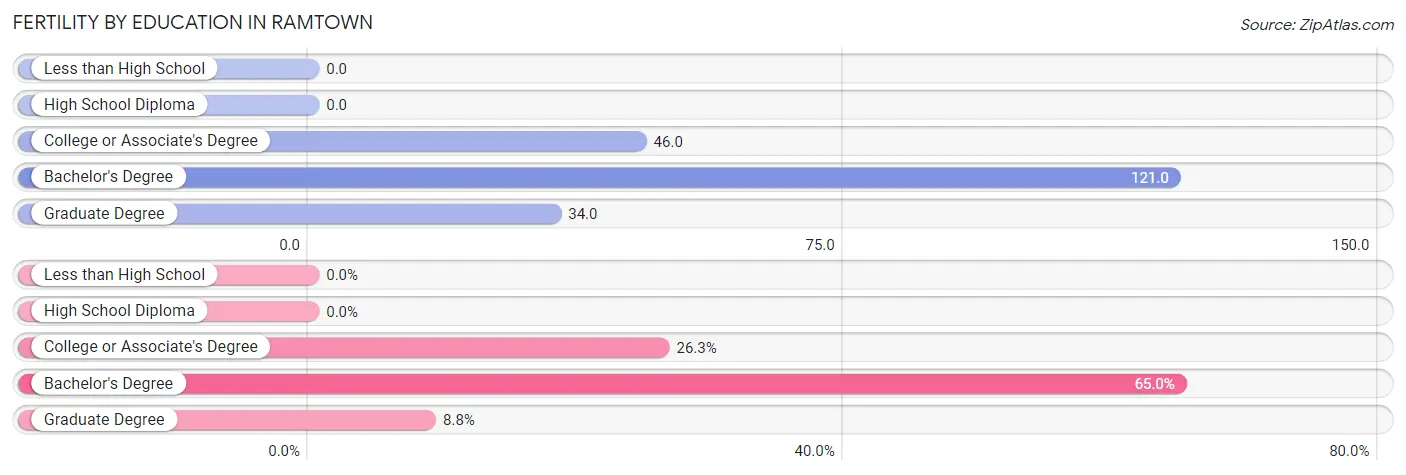
| Educational Attainment | Women with Births | Births / 1,000 Women |
| Less than High School | 0 (0.0%) | 0.0 |
| High School Diploma | 0 (0.0%) | 0.0 |
| College or Associate's Degree | 21 (26.3%) | 46.0 |
| Bachelor's Degree | 52 (65.0%) | 121.0 |
| Graduate Degree | 7 (8.7%) | 34.0 |
| Total | 80 (100.0%) | 51.0 |
Fertility by Education by Marriage Status in Ramtown
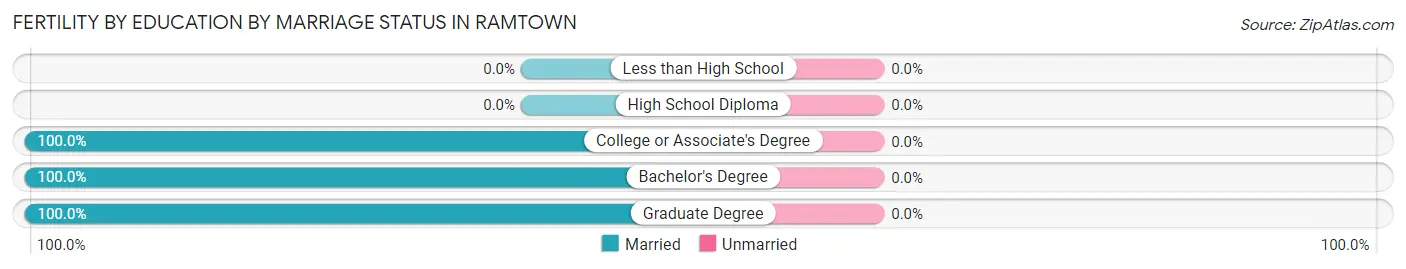
| Educational Attainment | Married | Unmarried |
| Less than High School | 0 (0.0%) | 0 (0.0%) |
| High School Diploma | 0 (0.0%) | 0 (0.0%) |
| College or Associate's Degree | 21 (100.0%) | 0 (0.0%) |
| Bachelor's Degree | 52 (100.0%) | 0 (0.0%) |
| Graduate Degree | 7 (100.0%) | 0 (0.0%) |
| Total | 80 (100.0%) | 0 (0.0%) |
Employment Characteristics in Ramtown
Employment by Class of Employer in Ramtown
Among the 3,335 employed individuals in Ramtown, private company employees (2,227 | 66.8%), local government employees (340 | 10.2%), and not-for-profit organizations (262 | 7.9%) make up the most common classes of employment.
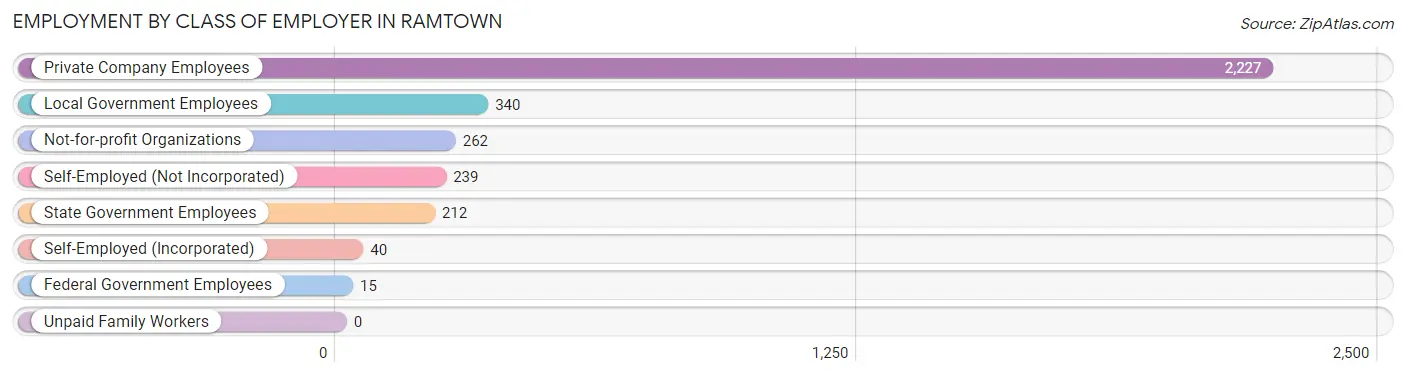
| Employer Class | # Employees | % Employees |
| Private Company Employees | 2,227 | 66.8% |
| Self-Employed (Incorporated) | 40 | 1.2% |
| Self-Employed (Not Incorporated) | 239 | 7.2% |
| Not-for-profit Organizations | 262 | 7.9% |
| Local Government Employees | 340 | 10.2% |
| State Government Employees | 212 | 6.4% |
| Federal Government Employees | 15 | 0.4% |
| Unpaid Family Workers | 0 | 0.0% |
| Total | 3,335 | 100.0% |
Employment Status by Age in Ramtown
According to the labor force statistics for Ramtown, out of the total population over 16 years of age (4,967), 70.1% or 3,482 individuals are in the labor force, with 3.5% or 122 of them unemployed. The age group with the highest labor force participation rate is 25 to 29 years, with 96.4% or 319 individuals in the labor force. Within the labor force, the 20 to 24 years age range has the highest percentage of unemployed individuals, with 11.2% or 31 of them being unemployed.
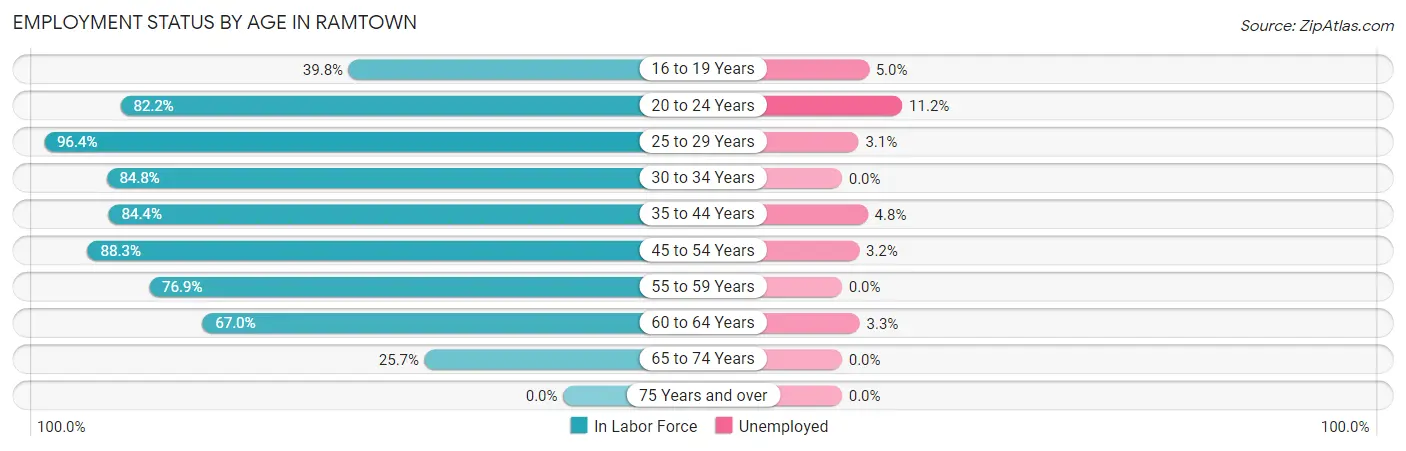
| Age Bracket | In Labor Force | Unemployed |
| 16 to 19 Years | 139 (39.8%) | 7 (5.0%) |
| 20 to 24 Years | 278 (82.2%) | 31 (11.2%) |
| 25 to 29 Years | 319 (96.4%) | 10 (3.1%) |
| 30 to 34 Years | 324 (84.8%) | 0 (0.0%) |
| 35 to 44 Years | 645 (84.4%) | 31 (4.8%) |
| 45 to 54 Years | 1,071 (88.3%) | 34 (3.2%) |
| 55 to 59 Years | 267 (76.9%) | 0 (0.0%) |
| 60 to 64 Years | 299 (67.0%) | 10 (3.3%) |
| 65 to 74 Years | 139 (25.7%) | 0 (0.0%) |
| 75 Years and over | 0 (0.0%) | 0 (0.0%) |
| Total | 3,482 (70.1%) | 122 (3.5%) |
Employment Status by Educational Attainment in Ramtown
According to labor force statistics for Ramtown, 84.0% of individuals (2,926) out of the total population between 25 and 64 years of age (3,483) are in the labor force, with 2.9% or 85 of them being unemployed. The group with the highest labor force participation rate are those with the educational attainment of bachelor's degree or higher, with 89.0% or 1,290 individuals in the labor force. Within the labor force, individuals with high school diploma education have the highest percentage of unemployment, with 10.9% or 75 of them being unemployed.
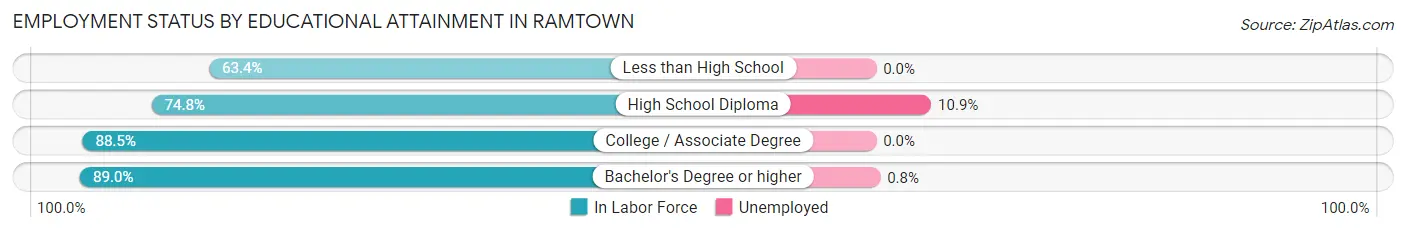
| Educational Attainment | In Labor Force | Unemployed |
| Less than High School | 97 (63.4%) | 0 (0.0%) |
| High School Diploma | 690 (74.8%) | 101 (10.9%) |
| College / Associate Degree | 848 (88.5%) | 0 (0.0%) |
| Bachelor's Degree or higher | 1,290 (89.0%) | 12 (0.8%) |
| Total | 2,926 (84.0%) | 101 (2.9%) |
Employment Occupations by Sex in Ramtown
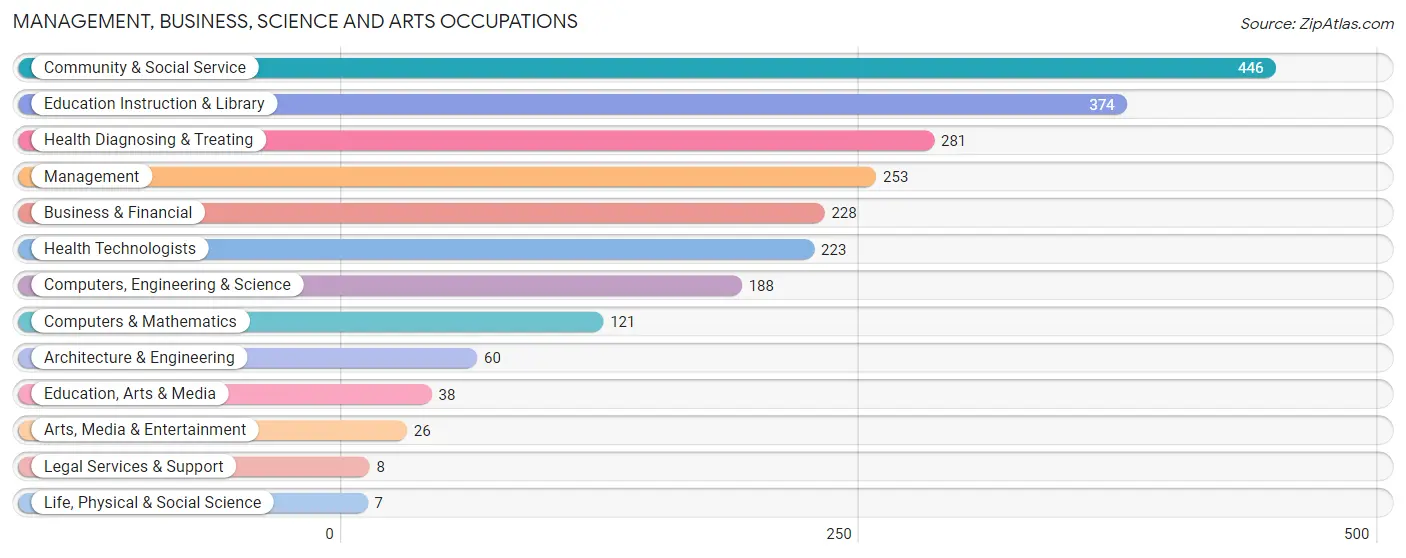
Management, Business, Science and Arts Occupations
The most common Management, Business, Science and Arts occupations in Ramtown are Community & Social Service (446 | 13.3%), Education Instruction & Library (374 | 11.1%), Health Diagnosing & Treating (281 | 8.4%), Management (253 | 7.5%), and Business & Financial (228 | 6.8%).
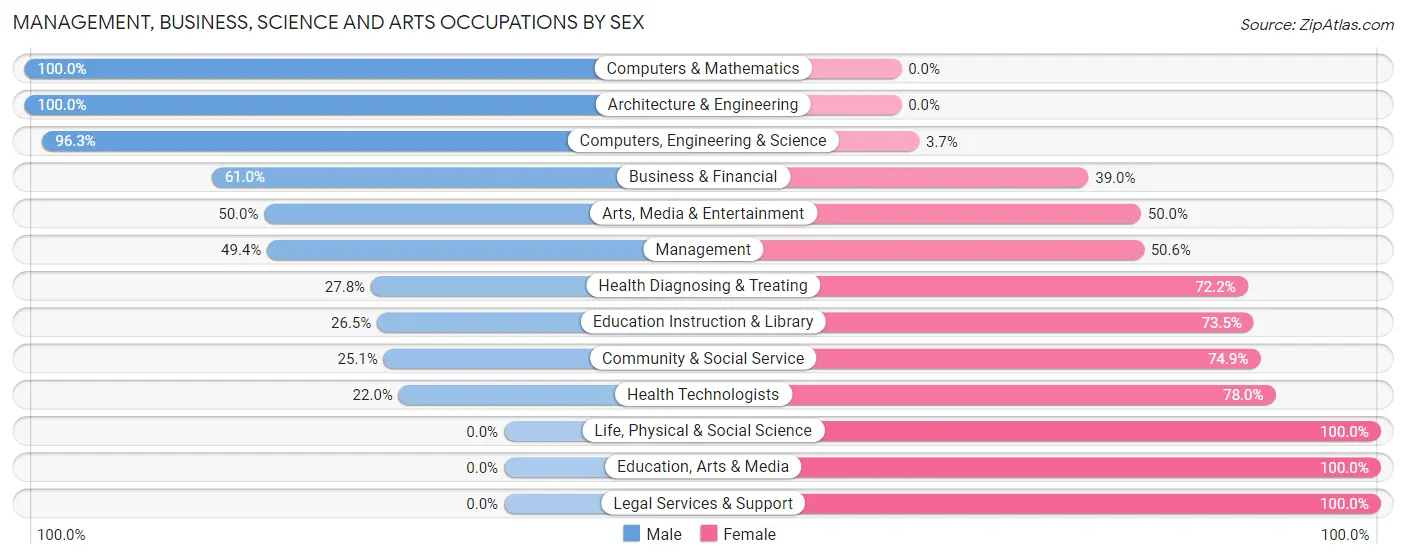
Management, Business, Science and Arts Occupations by Sex
Within the Management, Business, Science and Arts occupations in Ramtown, the most male-oriented occupations are Computers & Mathematics (100.0%), Architecture & Engineering (100.0%), and Computers, Engineering & Science (96.3%), while the most female-oriented occupations are Life, Physical & Social Science (100.0%), Education, Arts & Media (100.0%), and Legal Services & Support (100.0%).
| Occupation | Male | Female |
| Management | 125 (49.4%) | 128 (50.6%) |
| Business & Financial | 139 (61.0%) | 89 (39.0%) |
| Computers, Engineering & Science | 181 (96.3%) | 7 (3.7%) |
| Computers & Mathematics | 121 (100.0%) | 0 (0.0%) |
| Architecture & Engineering | 60 (100.0%) | 0 (0.0%) |
| Life, Physical & Social Science | 0 (0.0%) | 7 (100.0%) |
| Community & Social Service | 112 (25.1%) | 334 (74.9%) |
| Education, Arts & Media | 0 (0.0%) | 38 (100.0%) |
| Legal Services & Support | 0 (0.0%) | 8 (100.0%) |
| Education Instruction & Library | 99 (26.5%) | 275 (73.5%) |
| Arts, Media & Entertainment | 13 (50.0%) | 13 (50.0%) |
| Health Diagnosing & Treating | 78 (27.8%) | 203 (72.2%) |
| Health Technologists | 49 (22.0%) | 174 (78.0%) |
| Total (Category) | 635 (45.5%) | 761 (54.5%) |
| Total (Overall) | 1,766 (52.6%) | 1,592 (47.4%) |
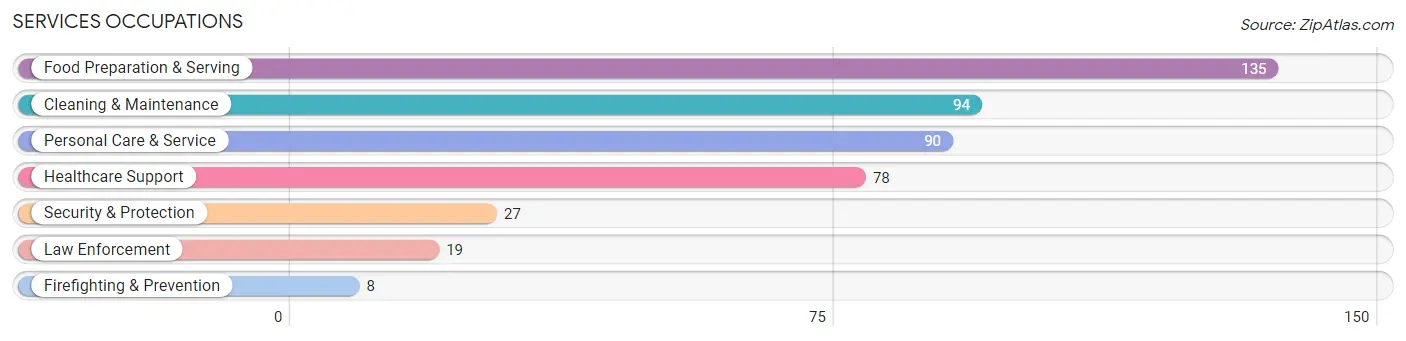
Services Occupations
The most common Services occupations in Ramtown are Food Preparation & Serving (135 | 4.0%), Cleaning & Maintenance (94 | 2.8%), Personal Care & Service (90 | 2.7%), Healthcare Support (78 | 2.3%), and Security & Protection (27 | 0.8%).
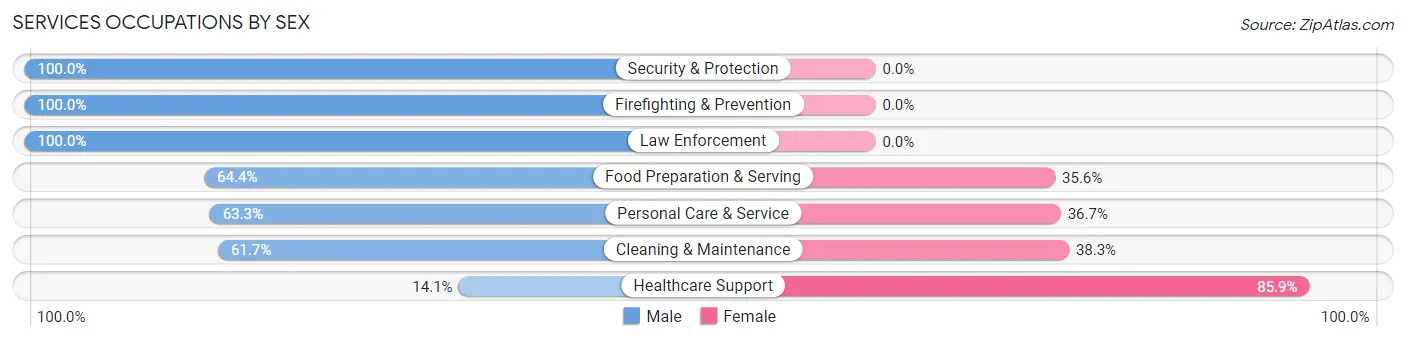
Services Occupations by Sex
Within the Services occupations in Ramtown, the most male-oriented occupations are Security & Protection (100.0%), Firefighting & Prevention (100.0%), and Law Enforcement (100.0%), while the most female-oriented occupations are Healthcare Support (85.9%), Cleaning & Maintenance (38.3%), and Personal Care & Service (36.7%).
| Occupation | Male | Female |
| Healthcare Support | 11 (14.1%) | 67 (85.9%) |
| Security & Protection | 27 (100.0%) | 0 (0.0%) |
| Firefighting & Prevention | 8 (100.0%) | 0 (0.0%) |
| Law Enforcement | 19 (100.0%) | 0 (0.0%) |
| Food Preparation & Serving | 87 (64.4%) | 48 (35.6%) |
| Cleaning & Maintenance | 58 (61.7%) | 36 (38.3%) |
| Personal Care & Service | 57 (63.3%) | 33 (36.7%) |
| Total (Category) | 240 (56.6%) | 184 (43.4%) |
| Total (Overall) | 1,766 (52.6%) | 1,592 (47.4%) |
Sales and Office Occupations
The most common Sales and Office occupations in Ramtown are Office & Administration (464 | 13.8%), and Sales & Related (212 | 6.3%).

Sales and Office Occupations by Sex

| Occupation | Male | Female |
| Sales & Related | 85 (40.1%) | 127 (59.9%) |
| Office & Administration | 48 (10.3%) | 416 (89.7%) |
| Total (Category) | 133 (19.7%) | 543 (80.3%) |
| Total (Overall) | 1,766 (52.6%) | 1,592 (47.4%) |
Natural Resources, Construction and Maintenance Occupations
The most common Natural Resources, Construction and Maintenance occupations in Ramtown are Construction & Extraction (182 | 5.4%), and Installation, Maintenance & Repair (119 | 3.5%).
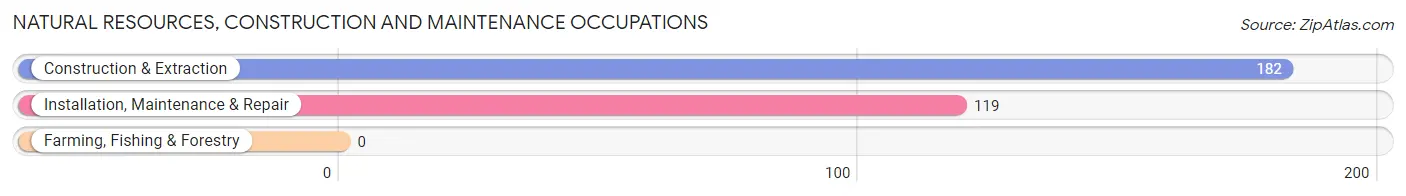
Natural Resources, Construction and Maintenance Occupations by Sex

| Occupation | Male | Female |
| Farming, Fishing & Forestry | 0 (0.0%) | 0 (0.0%) |
| Construction & Extraction | 182 (100.0%) | 0 (0.0%) |
| Installation, Maintenance & Repair | 58 (48.7%) | 61 (51.3%) |
| Total (Category) | 240 (79.7%) | 61 (20.3%) |
| Total (Overall) | 1,766 (52.6%) | 1,592 (47.4%) |
Production, Transportation and Moving Occupations
The most common Production, Transportation and Moving occupations in Ramtown are Transportation (287 | 8.6%), Production (142 | 4.2%), and Material Moving (132 | 3.9%).
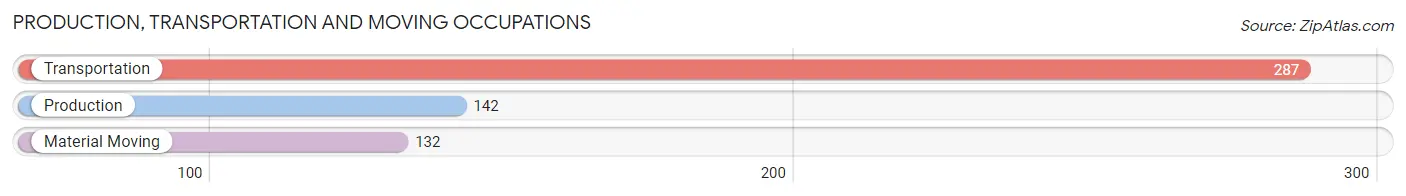
Production, Transportation and Moving Occupations by Sex
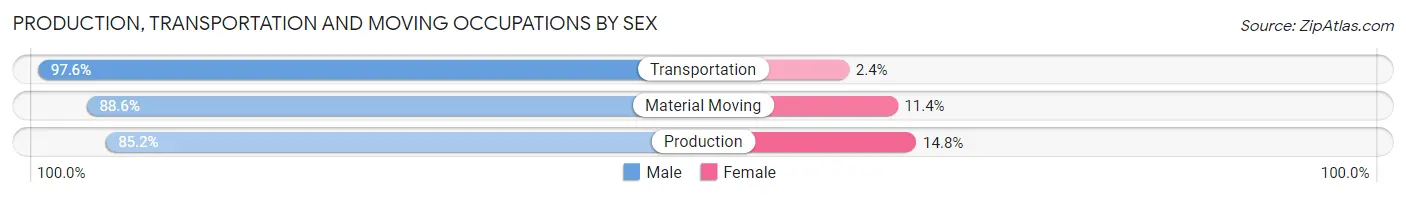
| Occupation | Male | Female |
| Production | 121 (85.2%) | 21 (14.8%) |
| Transportation | 280 (97.6%) | 7 (2.4%) |
| Material Moving | 117 (88.6%) | 15 (11.4%) |
| Total (Category) | 518 (92.3%) | 43 (7.7%) |
| Total (Overall) | 1,766 (52.6%) | 1,592 (47.4%) |
Employment Industries by Sex in Ramtown
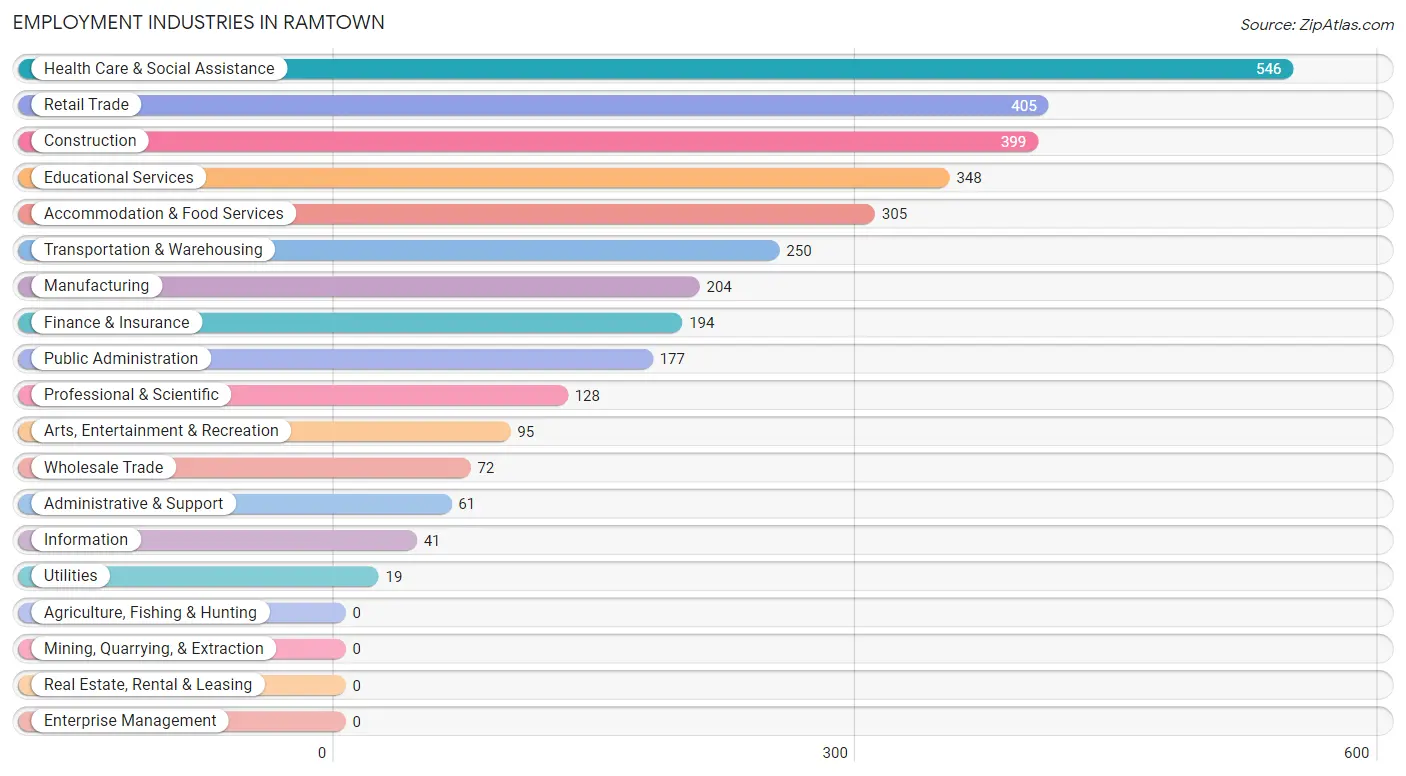
Employment Industries in Ramtown
The major employment industries in Ramtown include Health Care & Social Assistance (546 | 16.3%), Retail Trade (405 | 12.1%), Construction (399 | 11.9%), Educational Services (348 | 10.4%), and Accommodation & Food Services (305 | 9.1%).
Employment Industries by Sex in Ramtown
The Ramtown industries that see more men than women are Utilities (100.0%), Transportation & Warehousing (94.0%), and Arts, Entertainment & Recreation (90.5%), whereas the industries that tend to have a higher number of women are Educational Services (82.5%), Health Care & Social Assistance (74.4%), and Accommodation & Food Services (69.5%).
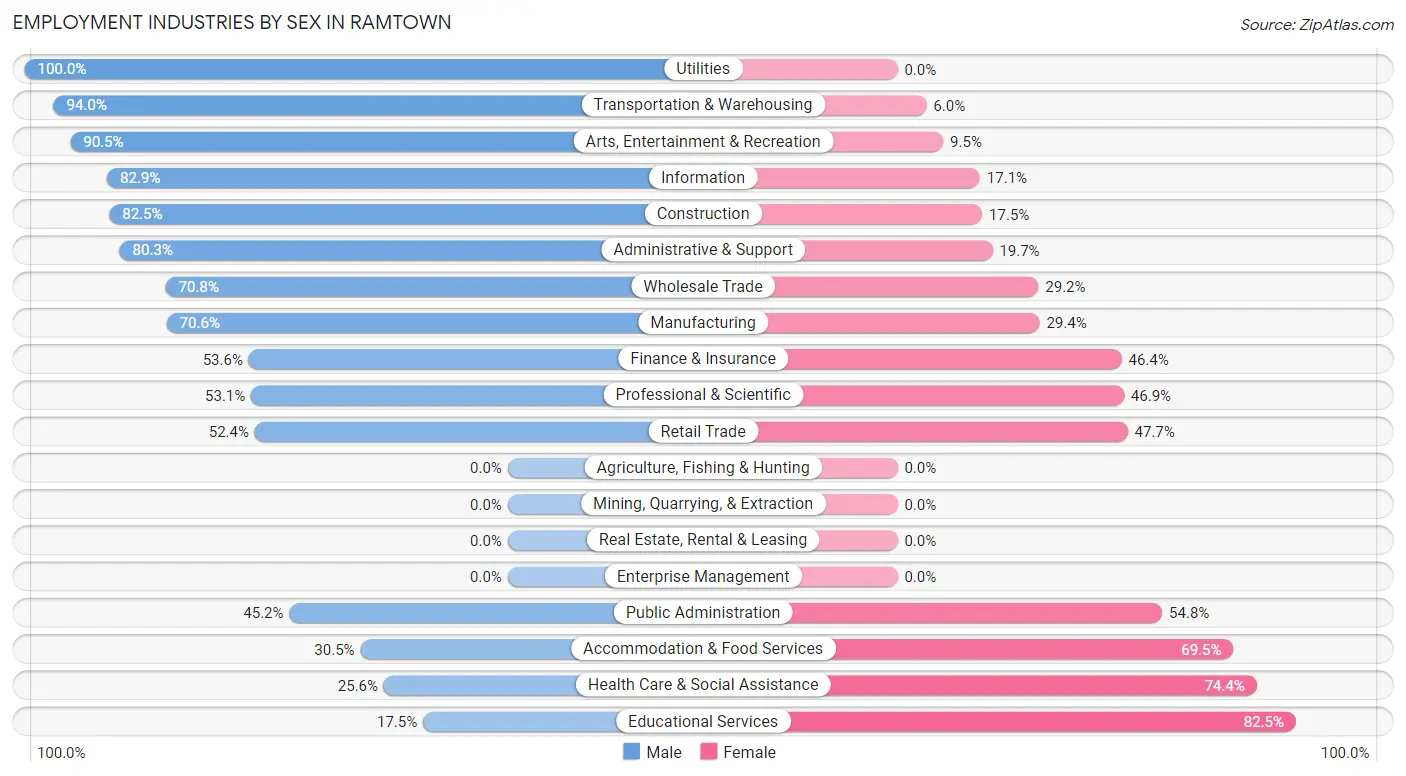
| Industry | Male | Female |
| Agriculture, Fishing & Hunting | 0 (0.0%) | 0 (0.0%) |
| Mining, Quarrying, & Extraction | 0 (0.0%) | 0 (0.0%) |
| Construction | 329 (82.5%) | 70 (17.5%) |
| Manufacturing | 144 (70.6%) | 60 (29.4%) |
| Wholesale Trade | 51 (70.8%) | 21 (29.2%) |
| Retail Trade | 212 (52.3%) | 193 (47.6%) |
| Transportation & Warehousing | 235 (94.0%) | 15 (6.0%) |
| Utilities | 19 (100.0%) | 0 (0.0%) |
| Information | 34 (82.9%) | 7 (17.1%) |
| Finance & Insurance | 104 (53.6%) | 90 (46.4%) |
| Real Estate, Rental & Leasing | 0 (0.0%) | 0 (0.0%) |
| Professional & Scientific | 68 (53.1%) | 60 (46.9%) |
| Enterprise Management | 0 (0.0%) | 0 (0.0%) |
| Administrative & Support | 49 (80.3%) | 12 (19.7%) |
| Educational Services | 61 (17.5%) | 287 (82.5%) |
| Health Care & Social Assistance | 140 (25.6%) | 406 (74.4%) |
| Arts, Entertainment & Recreation | 86 (90.5%) | 9 (9.5%) |
| Accommodation & Food Services | 93 (30.5%) | 212 (69.5%) |
| Public Administration | 80 (45.2%) | 97 (54.8%) |
| Total | 1,766 (52.6%) | 1,592 (47.4%) |
Education in Ramtown
School Enrollment in Ramtown
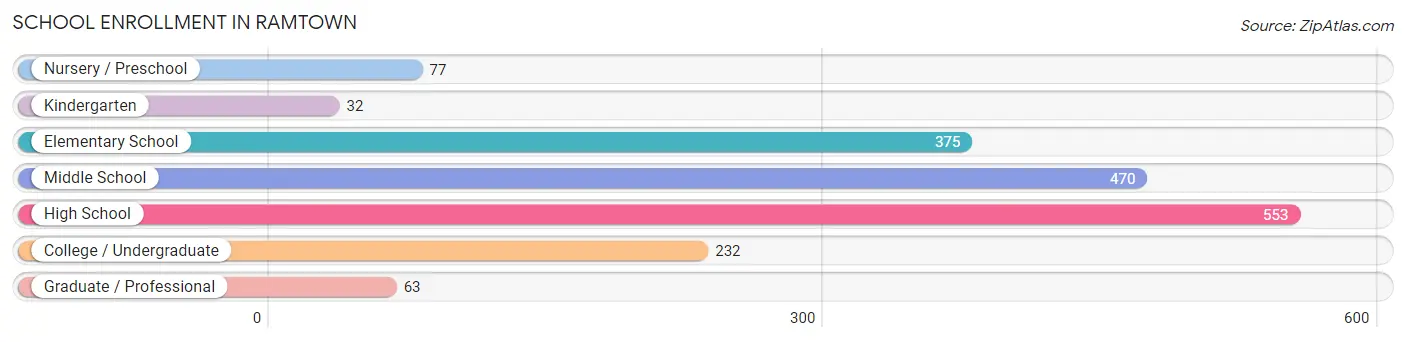
The most common levels of schooling among the 1,802 students in Ramtown are high school (553 | 30.7%), middle school (470 | 26.1%), and elementary school (375 | 20.8%).
| School Level | # Students | % Students |
| Nursery / Preschool | 77 | 4.3% |
| Kindergarten | 32 | 1.8% |
| Elementary School | 375 | 20.8% |
| Middle School | 470 | 26.1% |
| High School | 553 | 30.7% |
| College / Undergraduate | 232 | 12.9% |
| Graduate / Professional | 63 | 3.5% |
| Total | 1,802 | 100.0% |
School Enrollment by Age by Funding Source in Ramtown
Out of a total of 1,802 students who are enrolled in schools in Ramtown, 139 (7.7%) attend a private institution, while the remaining 1,663 (92.3%) are enrolled in public schools. The age group of 3 to 4 year olds has the highest likelihood of being enrolled in private schools, with 53 (68.8% in the age bracket) enrolled. Conversely, the age group of 10 to 14 year olds has the lowest likelihood of being enrolled in a private school, with 652 (100.0% in the age bracket) attending a public institution.
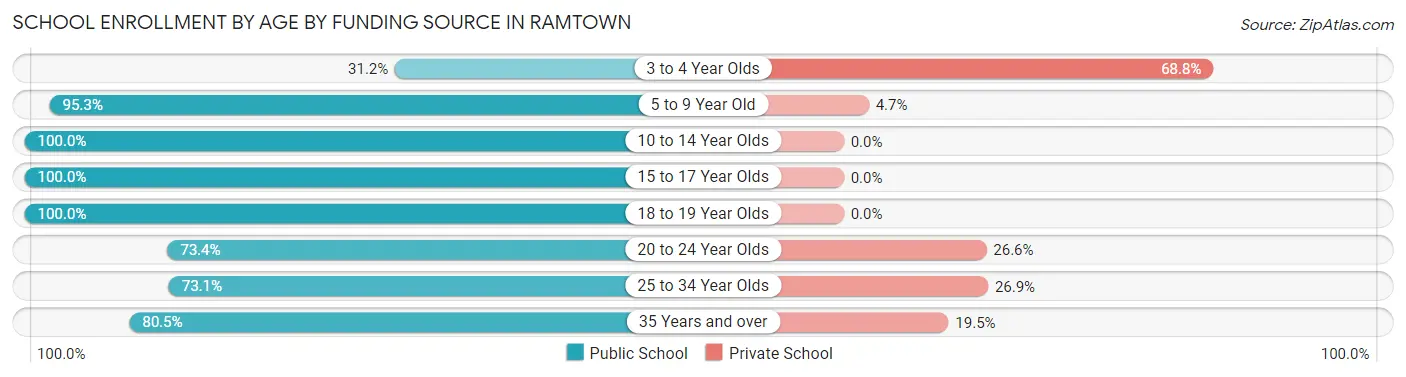
| Age Bracket | Public School | Private School |
| 3 to 4 Year Olds | 24 (31.2%) | 53 (68.8%) |
| 5 to 9 Year Old | 348 (95.3%) | 17 (4.7%) |
| 10 to 14 Year Olds | 652 (100.0%) | 0 (0.0%) |
| 15 to 17 Year Olds | 326 (100.0%) | 0 (0.0%) |
| 18 to 19 Year Olds | 116 (100.0%) | 0 (0.0%) |
| 20 to 24 Year Olds | 116 (73.4%) | 42 (26.6%) |
| 25 to 34 Year Olds | 49 (73.1%) | 18 (26.9%) |
| 35 Years and over | 33 (80.5%) | 8 (19.5%) |
| Total | 1,663 (92.3%) | 139 (7.7%) |
Educational Attainment by Field of Study in Ramtown
Business (679 | 37.0%), education (257 | 14.0%), computers & mathematics (145 | 7.9%), arts & humanities (143 | 7.8%), and psychology (137 | 7.5%) are the most common fields of study among 1,836 individuals in Ramtown who have obtained a bachelor's degree or higher.
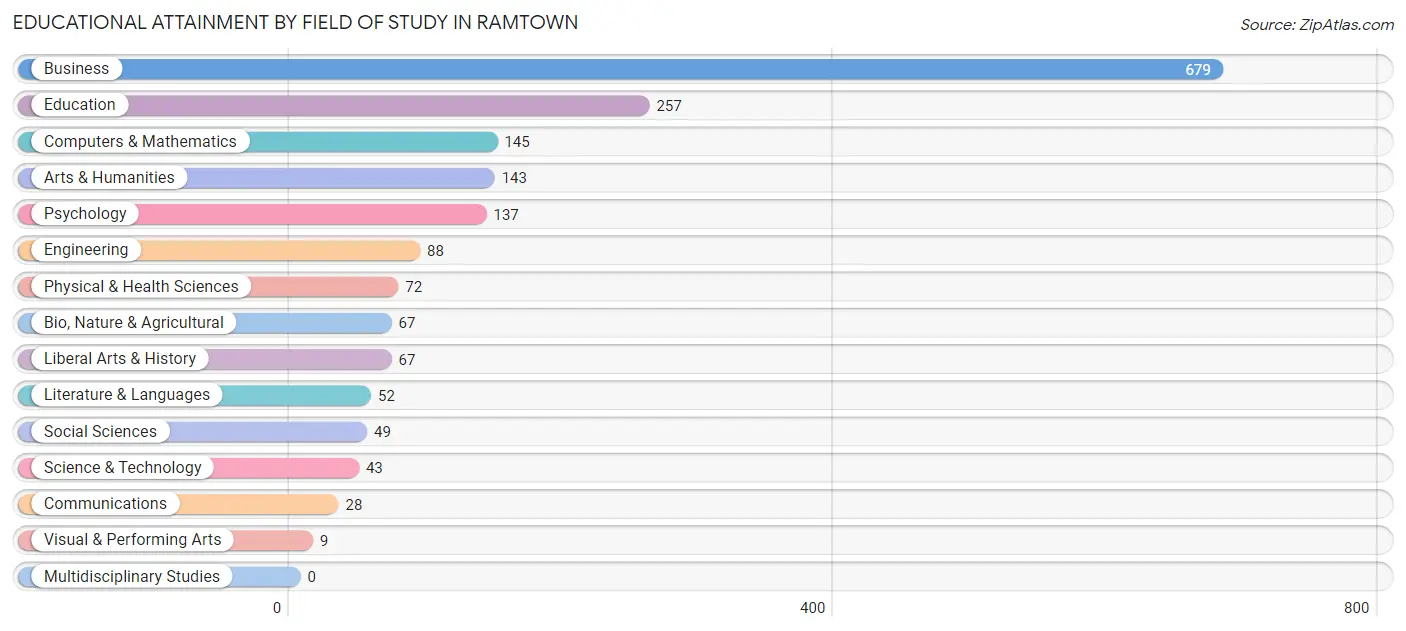
| Field of Study | # Graduates | % Graduates |
| Computers & Mathematics | 145 | 7.9% |
| Bio, Nature & Agricultural | 67 | 3.6% |
| Physical & Health Sciences | 72 | 3.9% |
| Psychology | 137 | 7.5% |
| Social Sciences | 49 | 2.7% |
| Engineering | 88 | 4.8% |
| Multidisciplinary Studies | 0 | 0.0% |
| Science & Technology | 43 | 2.3% |
| Business | 679 | 37.0% |
| Education | 257 | 14.0% |
| Literature & Languages | 52 | 2.8% |
| Liberal Arts & History | 67 | 3.6% |
| Visual & Performing Arts | 9 | 0.5% |
| Communications | 28 | 1.5% |
| Arts & Humanities | 143 | 7.8% |
| Total | 1,836 | 100.0% |
Transportation & Commute in Ramtown
Vehicle Availability by Sex in Ramtown
The most prevalent vehicle ownership categories in Ramtown are males with 2 vehicles (1,024, accounting for 58.4%) and females with 2 vehicles (998, making up 64.8%).
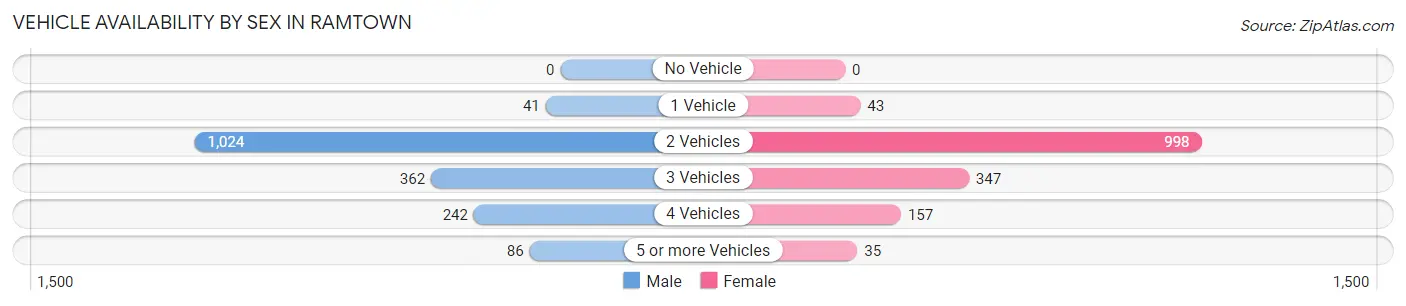
| Vehicles Available | Male | Female |
| No Vehicle | 0 (0.0%) | 0 (0.0%) |
| 1 Vehicle | 41 (2.3%) | 43 (2.7%) |
| 2 Vehicles | 1,024 (58.4%) | 998 (63.2%) |
| 3 Vehicles | 362 (20.6%) | 347 (22.0%) |
| 4 Vehicles | 242 (13.8%) | 157 (9.9%) |
| 5 or more Vehicles | 86 (4.9%) | 35 (2.2%) |
| Total | 1,755 (100.0%) | 1,580 (100.0%) |
Commute Time in Ramtown
The most frequently occuring commute durations in Ramtown are 30 to 34 minutes (618 commuters, 21.0%), 60 to 89 minutes (441 commuters, 15.0%), and 15 to 19 minutes (343 commuters, 11.7%).
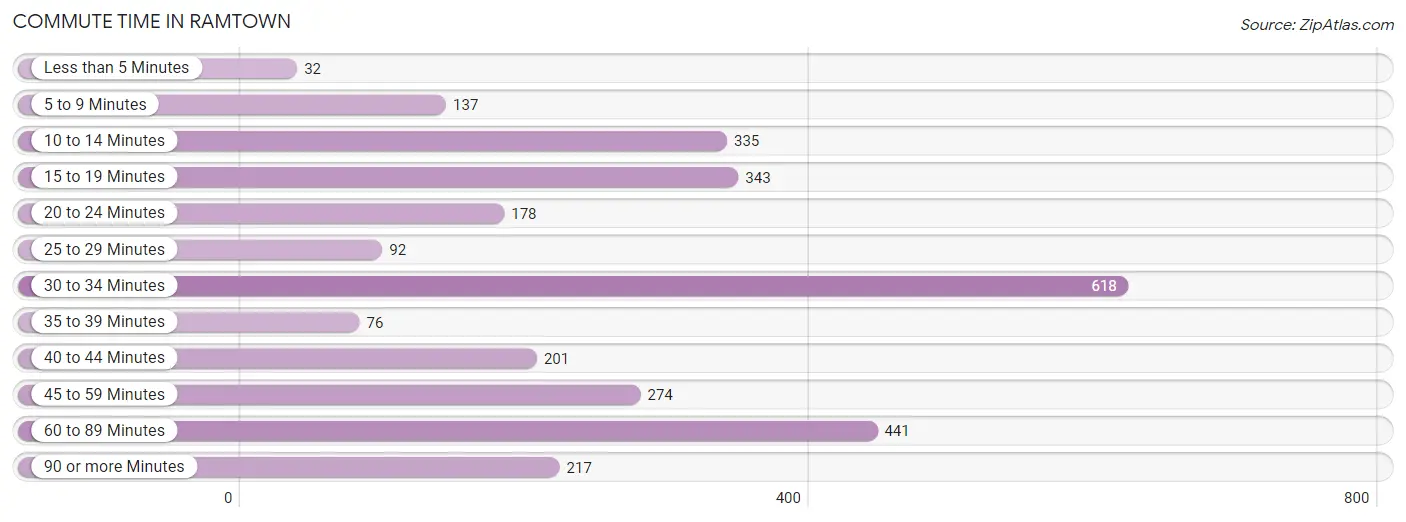
| Commute Time | # Commuters | % Commuters |
| Less than 5 Minutes | 32 | 1.1% |
| 5 to 9 Minutes | 137 | 4.6% |
| 10 to 14 Minutes | 335 | 11.4% |
| 15 to 19 Minutes | 343 | 11.7% |
| 20 to 24 Minutes | 178 | 6.0% |
| 25 to 29 Minutes | 92 | 3.1% |
| 30 to 34 Minutes | 618 | 21.0% |
| 35 to 39 Minutes | 76 | 2.6% |
| 40 to 44 Minutes | 201 | 6.8% |
| 45 to 59 Minutes | 274 | 9.3% |
| 60 to 89 Minutes | 441 | 15.0% |
| 90 or more Minutes | 217 | 7.4% |
Commute Time by Sex in Ramtown
The most common commute times in Ramtown are 30 to 34 minutes (415 commuters, 26.4%) for males and 60 to 89 minutes (240 commuters, 17.5%) for females.
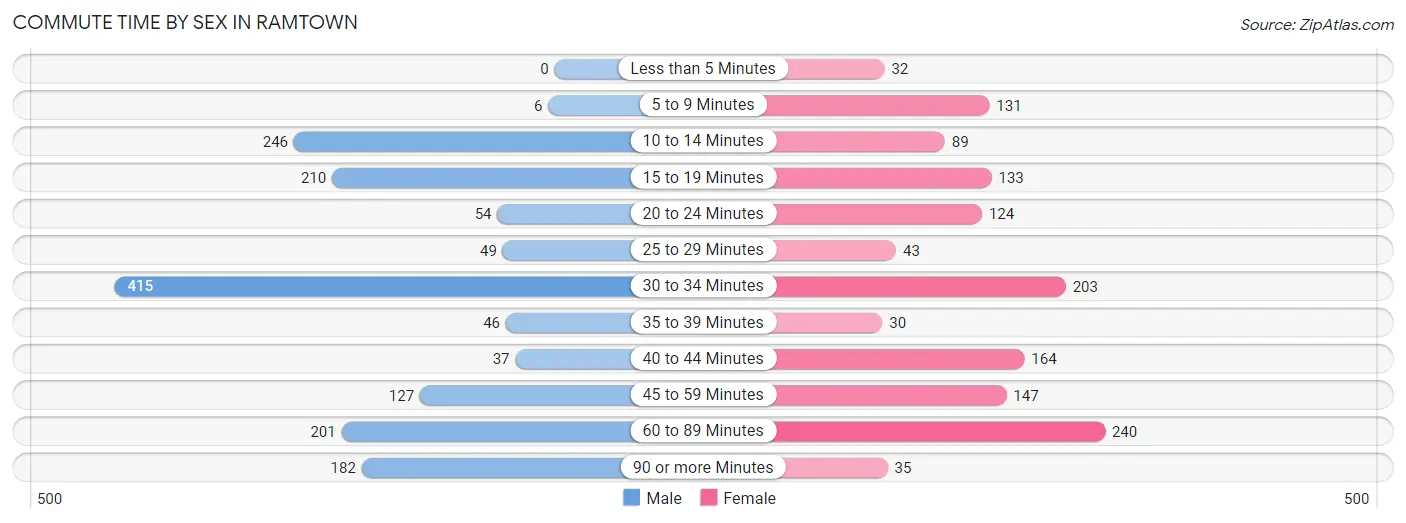
| Commute Time | Male | Female |
| Less than 5 Minutes | 0 (0.0%) | 32 (2.3%) |
| 5 to 9 Minutes | 6 (0.4%) | 131 (9.6%) |
| 10 to 14 Minutes | 246 (15.6%) | 89 (6.5%) |
| 15 to 19 Minutes | 210 (13.4%) | 133 (9.7%) |
| 20 to 24 Minutes | 54 (3.4%) | 124 (9.0%) |
| 25 to 29 Minutes | 49 (3.1%) | 43 (3.1%) |
| 30 to 34 Minutes | 415 (26.4%) | 203 (14.8%) |
| 35 to 39 Minutes | 46 (2.9%) | 30 (2.2%) |
| 40 to 44 Minutes | 37 (2.4%) | 164 (12.0%) |
| 45 to 59 Minutes | 127 (8.1%) | 147 (10.7%) |
| 60 to 89 Minutes | 201 (12.8%) | 240 (17.5%) |
| 90 or more Minutes | 182 (11.6%) | 35 (2.5%) |
Time of Departure to Work by Sex in Ramtown
The most frequent times of departure to work in Ramtown are 6:30 AM to 6:59 AM (218, 13.9%) for males and 7:30 AM to 7:59 AM (386, 28.1%) for females.
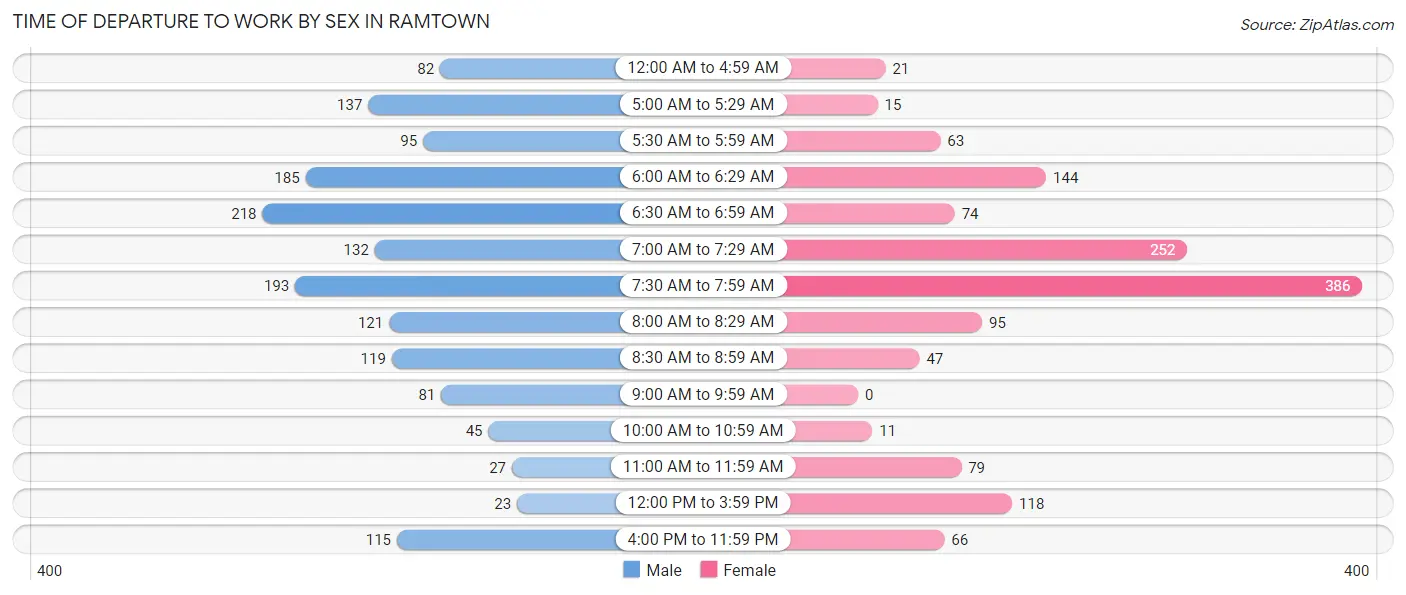
| Time of Departure | Male | Female |
| 12:00 AM to 4:59 AM | 82 (5.2%) | 21 (1.5%) |
| 5:00 AM to 5:29 AM | 137 (8.7%) | 15 (1.1%) |
| 5:30 AM to 5:59 AM | 95 (6.0%) | 63 (4.6%) |
| 6:00 AM to 6:29 AM | 185 (11.8%) | 144 (10.5%) |
| 6:30 AM to 6:59 AM | 218 (13.9%) | 74 (5.4%) |
| 7:00 AM to 7:29 AM | 132 (8.4%) | 252 (18.4%) |
| 7:30 AM to 7:59 AM | 193 (12.3%) | 386 (28.1%) |
| 8:00 AM to 8:29 AM | 121 (7.7%) | 95 (6.9%) |
| 8:30 AM to 8:59 AM | 119 (7.6%) | 47 (3.4%) |
| 9:00 AM to 9:59 AM | 81 (5.1%) | 0 (0.0%) |
| 10:00 AM to 10:59 AM | 45 (2.9%) | 11 (0.8%) |
| 11:00 AM to 11:59 AM | 27 (1.7%) | 79 (5.8%) |
| 12:00 PM to 3:59 PM | 23 (1.5%) | 118 (8.6%) |
| 4:00 PM to 11:59 PM | 115 (7.3%) | 66 (4.8%) |
| Total | 1,573 (100.0%) | 1,371 (100.0%) |
Housing Occupancy in Ramtown
Occupancy by Ownership in Ramtown
Of the total 2,143 dwellings in Ramtown, owner-occupied units account for 2,063 (96.3%), while renter-occupied units make up 80 (3.7%).
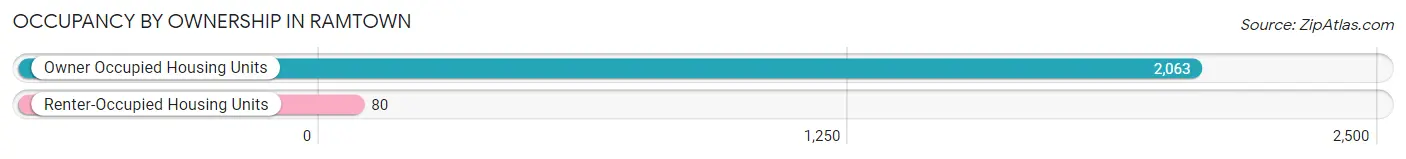
| Occupancy | # Housing Units | % Housing Units |
| Owner Occupied Housing Units | 2,063 | 96.3% |
| Renter-Occupied Housing Units | 80 | 3.7% |
| Total Occupied Housing Units | 2,143 | 100.0% |
Occupancy by Household Size in Ramtown
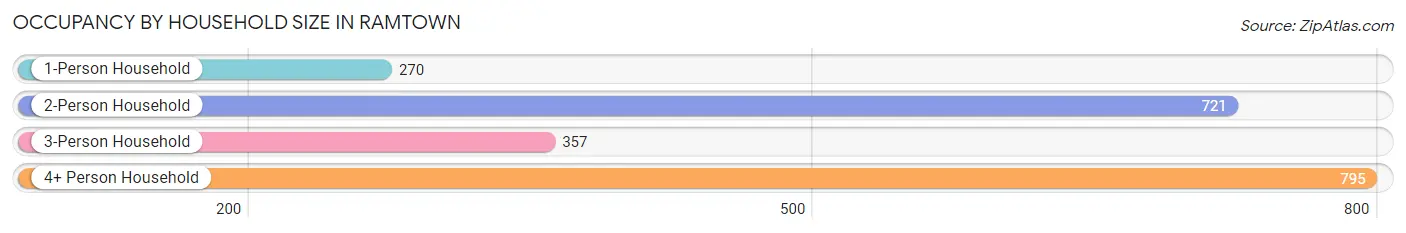
| Household Size | # Housing Units | % Housing Units |
| 1-Person Household | 270 | 12.6% |
| 2-Person Household | 721 | 33.6% |
| 3-Person Household | 357 | 16.7% |
| 4+ Person Household | 795 | 37.1% |
| Total Housing Units | 2,143 | 100.0% |
Occupancy by Ownership by Household Size in Ramtown
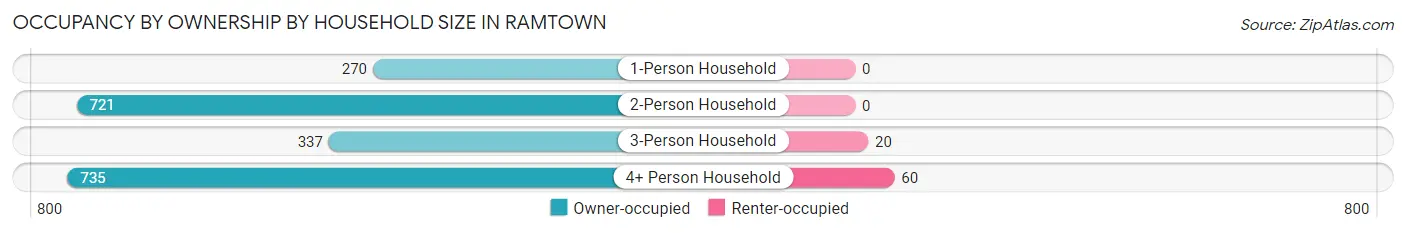
| Household Size | Owner-occupied | Renter-occupied |
| 1-Person Household | 270 (100.0%) | 0 (0.0%) |
| 2-Person Household | 721 (100.0%) | 0 (0.0%) |
| 3-Person Household | 337 (94.4%) | 20 (5.6%) |
| 4+ Person Household | 735 (92.4%) | 60 (7.5%) |
| Total Housing Units | 2,063 (96.3%) | 80 (3.7%) |
Occupancy by Educational Attainment in Ramtown
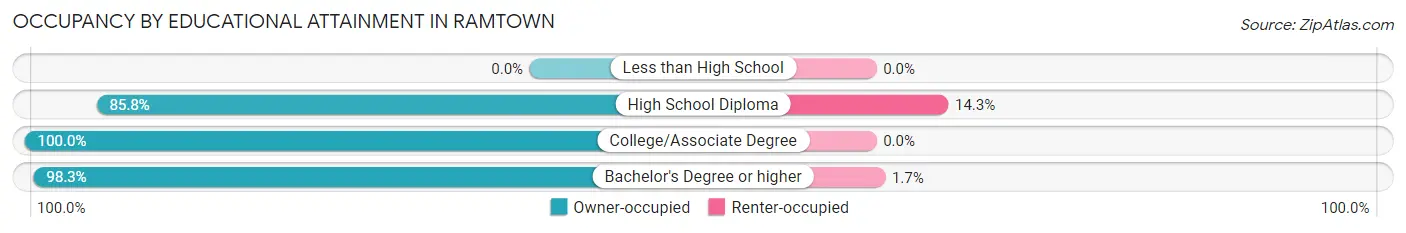
| Household Size | Owner-occupied | Renter-occupied |
| Less than High School | 0 (0.0%) | 0 (0.0%) |
| High School Diploma | 361 (85.8%) | 60 (14.2%) |
| College/Associate Degree | 570 (100.0%) | 0 (0.0%) |
| Bachelor's Degree or higher | 1,132 (98.3%) | 20 (1.7%) |
Occupancy by Age of Householder in Ramtown
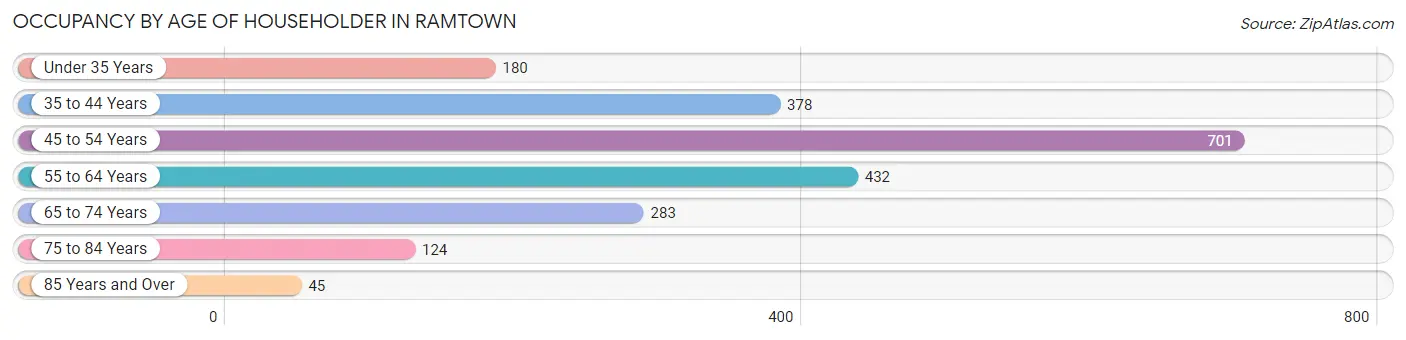
| Age Bracket | # Households | % Households |
| Under 35 Years | 180 | 8.4% |
| 35 to 44 Years | 378 | 17.6% |
| 45 to 54 Years | 701 | 32.7% |
| 55 to 64 Years | 432 | 20.2% |
| 65 to 74 Years | 283 | 13.2% |
| 75 to 84 Years | 124 | 5.8% |
| 85 Years and Over | 45 | 2.1% |
| Total | 2,143 | 100.0% |
Housing Finances in Ramtown
Median Income by Occupancy in Ramtown
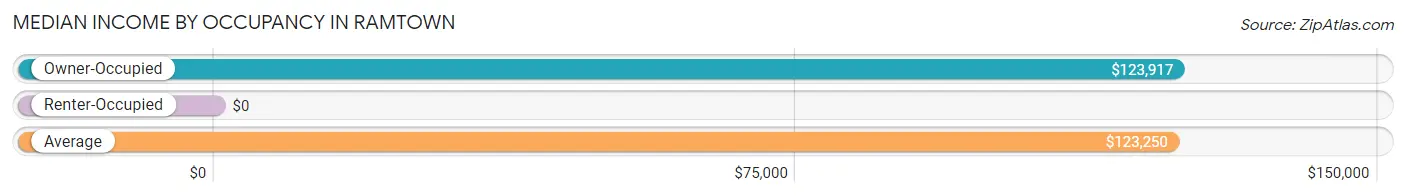
| Occupancy Type | # Households | Median Income |
| Owner-Occupied | 2,063 (96.3%) | $123,917 |
| Renter-Occupied | 80 (3.7%) | $0 |
| Average | 2,143 (100.0%) | $123,250 |
Occupancy by Householder Income Bracket in Ramtown
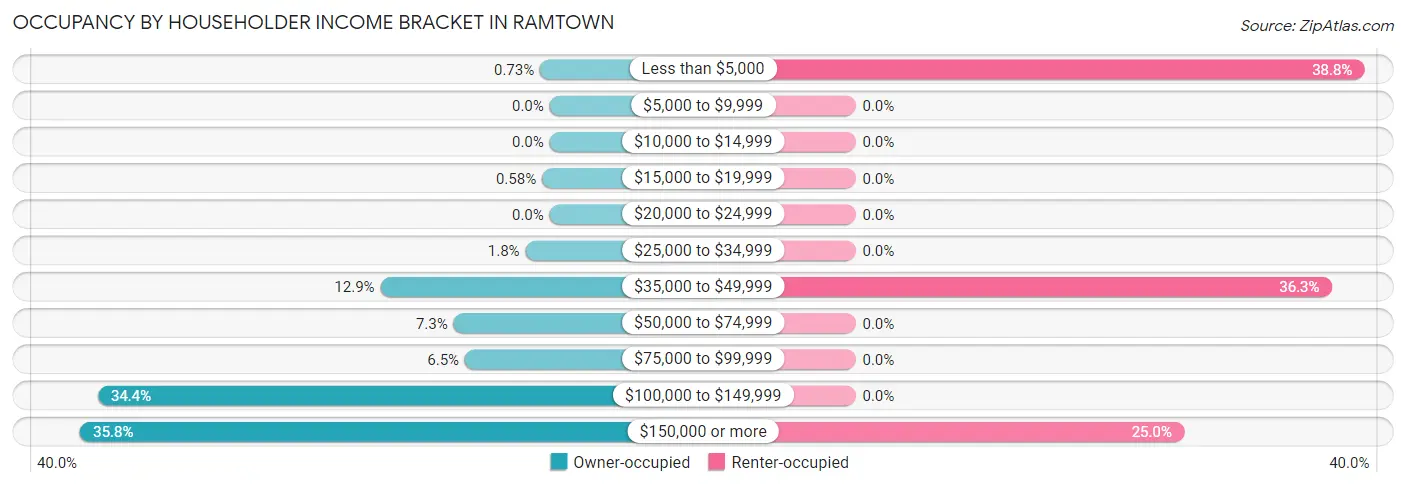
| Income Bracket | Owner-occupied | Renter-occupied |
| Less than $5,000 | 15 (0.7%) | 31 (38.8%) |
| $5,000 to $9,999 | 0 (0.0%) | 0 (0.0%) |
| $10,000 to $14,999 | 0 (0.0%) | 0 (0.0%) |
| $15,000 to $19,999 | 12 (0.6%) | 0 (0.0%) |
| $20,000 to $24,999 | 0 (0.0%) | 0 (0.0%) |
| $25,000 to $34,999 | 38 (1.8%) | 0 (0.0%) |
| $35,000 to $49,999 | 266 (12.9%) | 29 (36.2%) |
| $50,000 to $74,999 | 151 (7.3%) | 0 (0.0%) |
| $75,000 to $99,999 | 133 (6.5%) | 0 (0.0%) |
| $100,000 to $149,999 | 710 (34.4%) | 0 (0.0%) |
| $150,000 or more | 738 (35.8%) | 20 (25.0%) |
| Total | 2,063 (100.0%) | 80 (100.0%) |
Monthly Housing Cost Tiers in Ramtown
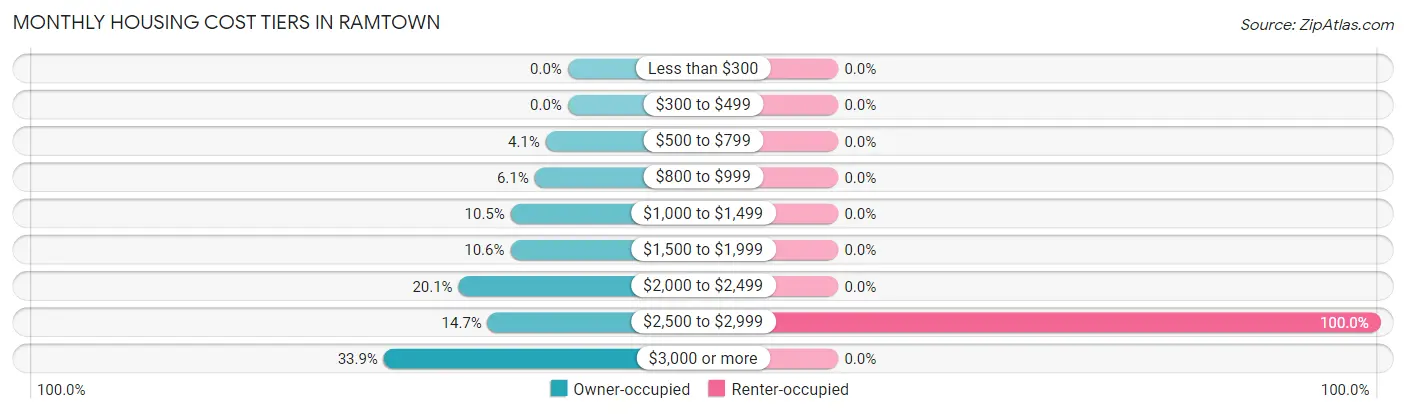
| Monthly Cost | Owner-occupied | Renter-occupied |
| Less than $300 | 0 (0.0%) | 0 (0.0%) |
| $300 to $499 | 0 (0.0%) | 0 (0.0%) |
| $500 to $799 | 84 (4.1%) | 0 (0.0%) |
| $800 to $999 | 126 (6.1%) | 0 (0.0%) |
| $1,000 to $1,499 | 217 (10.5%) | 0 (0.0%) |
| $1,500 to $1,999 | 218 (10.6%) | 0 (0.0%) |
| $2,000 to $2,499 | 415 (20.1%) | 0 (0.0%) |
| $2,500 to $2,999 | 304 (14.7%) | 80 (100.0%) |
| $3,000 or more | 699 (33.9%) | 0 (0.0%) |
| Total | 2,063 (100.0%) | 80 (100.0%) |
Physical Housing Characteristics in Ramtown
Housing Structures in Ramtown
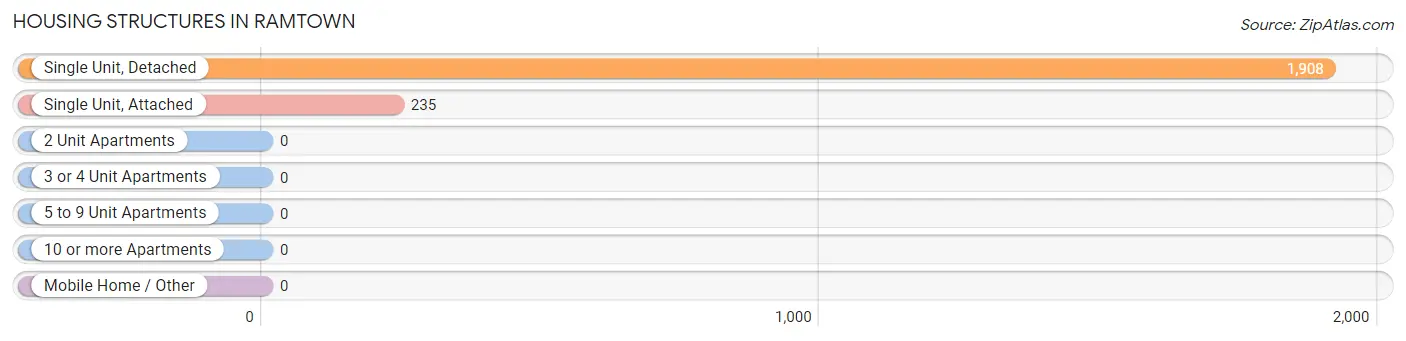
| Structure Type | # Housing Units | % Housing Units |
| Single Unit, Detached | 1,908 | 89.0% |
| Single Unit, Attached | 235 | 11.0% |
| 2 Unit Apartments | 0 | 0.0% |
| 3 or 4 Unit Apartments | 0 | 0.0% |
| 5 to 9 Unit Apartments | 0 | 0.0% |
| 10 or more Apartments | 0 | 0.0% |
| Mobile Home / Other | 0 | 0.0% |
| Total | 2,143 | 100.0% |
Housing Structures by Occupancy in Ramtown
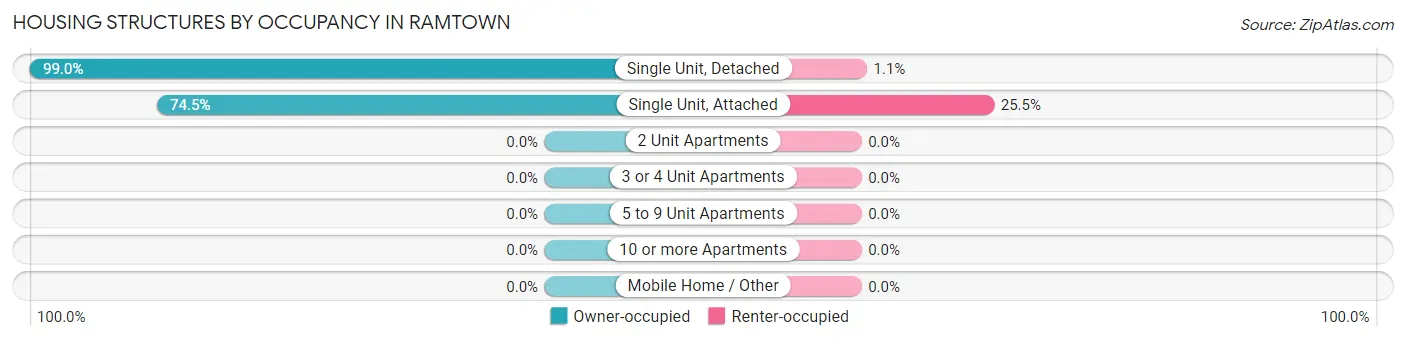
| Structure Type | Owner-occupied | Renter-occupied |
| Single Unit, Detached | 1,888 (99.0%) | 20 (1.1%) |
| Single Unit, Attached | 175 (74.5%) | 60 (25.5%) |
| 2 Unit Apartments | 0 (0.0%) | 0 (0.0%) |
| 3 or 4 Unit Apartments | 0 (0.0%) | 0 (0.0%) |
| 5 to 9 Unit Apartments | 0 (0.0%) | 0 (0.0%) |
| 10 or more Apartments | 0 (0.0%) | 0 (0.0%) |
| Mobile Home / Other | 0 (0.0%) | 0 (0.0%) |
| Total | 2,063 (96.3%) | 80 (3.7%) |
Housing Structures by Number of Rooms in Ramtown
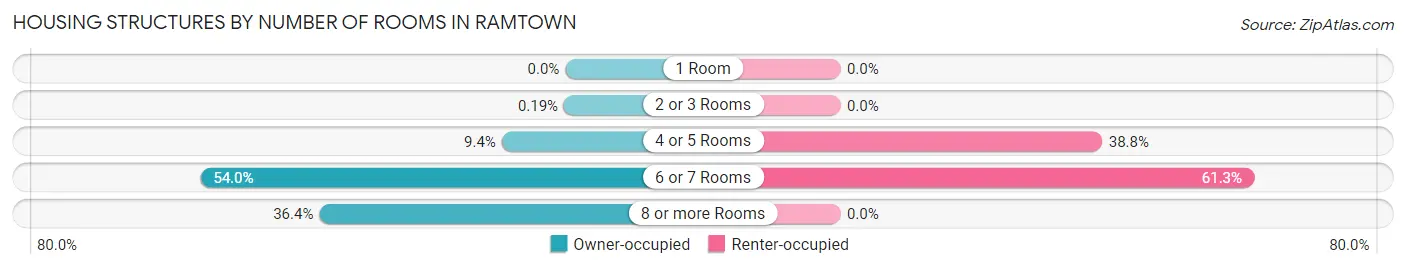
| Number of Rooms | Owner-occupied | Renter-occupied |
| 1 Room | 0 (0.0%) | 0 (0.0%) |
| 2 or 3 Rooms | 4 (0.2%) | 0 (0.0%) |
| 4 or 5 Rooms | 194 (9.4%) | 31 (38.8%) |
| 6 or 7 Rooms | 1,114 (54.0%) | 49 (61.3%) |
| 8 or more Rooms | 751 (36.4%) | 0 (0.0%) |
| Total | 2,063 (100.0%) | 80 (100.0%) |
Housing Structure by Heating Type in Ramtown
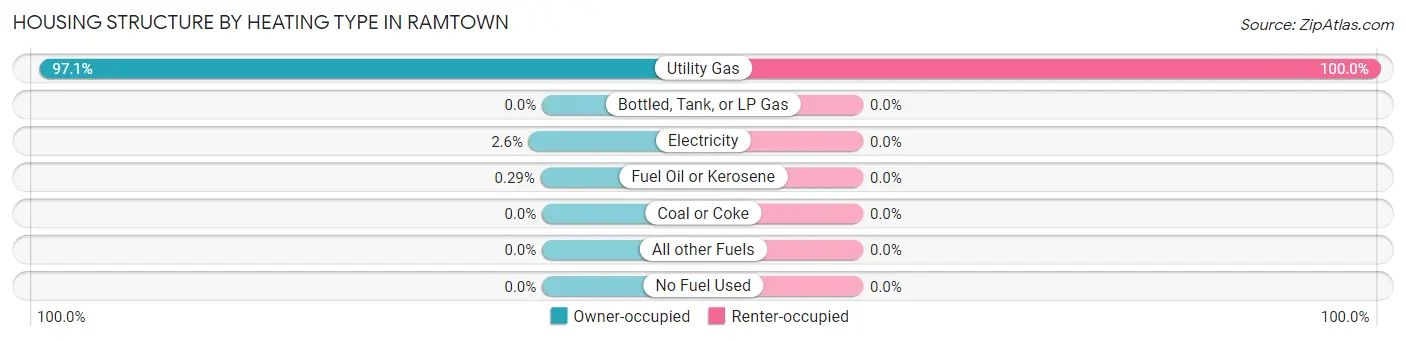
| Heating Type | Owner-occupied | Renter-occupied |
| Utility Gas | 2,004 (97.1%) | 80 (100.0%) |
| Bottled, Tank, or LP Gas | 0 (0.0%) | 0 (0.0%) |
| Electricity | 53 (2.6%) | 0 (0.0%) |
| Fuel Oil or Kerosene | 6 (0.3%) | 0 (0.0%) |
| Coal or Coke | 0 (0.0%) | 0 (0.0%) |
| All other Fuels | 0 (0.0%) | 0 (0.0%) |
| No Fuel Used | 0 (0.0%) | 0 (0.0%) |
| Total | 2,063 (100.0%) | 80 (100.0%) |
Household Vehicle Usage in Ramtown
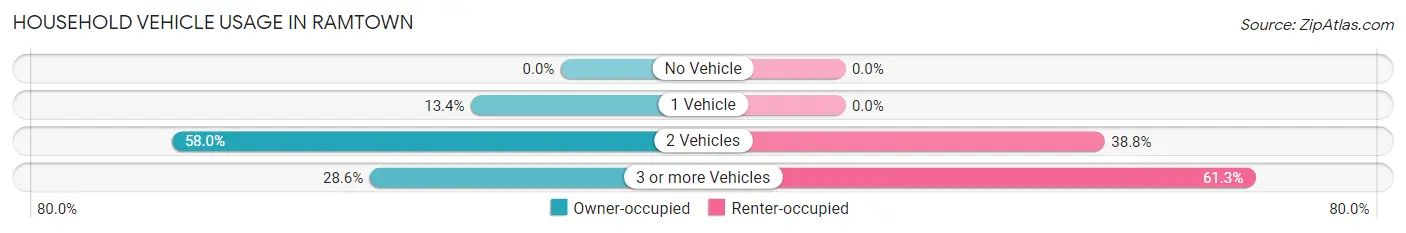
| Vehicles per Household | Owner-occupied | Renter-occupied |
| No Vehicle | 0 (0.0%) | 0 (0.0%) |
| 1 Vehicle | 277 (13.4%) | 0 (0.0%) |
| 2 Vehicles | 1,197 (58.0%) | 31 (38.8%) |
| 3 or more Vehicles | 589 (28.5%) | 49 (61.3%) |
| Total | 2,063 (100.0%) | 80 (100.0%) |
Real Estate & Mortgages in Ramtown
Real Estate and Mortgage Overview in Ramtown
| Characteristic | Without Mortgage | With Mortgage |
| Housing Units | 458 | 1,605 |
| Median Property Value | $353,800 | $416,400 |
| Median Household Income | $100,625 | $639 |
| Monthly Housing Costs | $1,084 | $699 |
| Real Estate Taxes | $8,454 | $0 |
Property Value by Mortgage Status in Ramtown
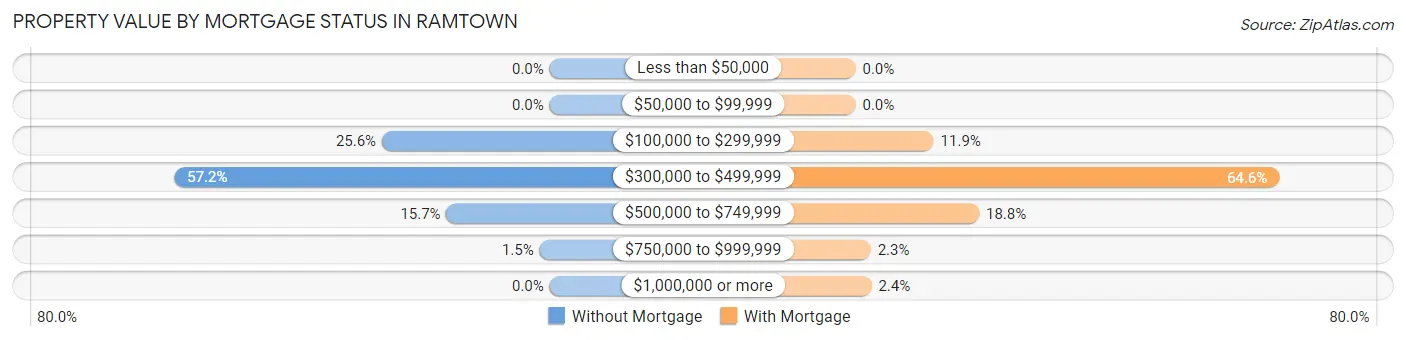
| Property Value | Without Mortgage | With Mortgage |
| Less than $50,000 | 0 (0.0%) | 0 (0.0%) |
| $50,000 to $99,999 | 0 (0.0%) | 0 (0.0%) |
| $100,000 to $299,999 | 117 (25.6%) | 191 (11.9%) |
| $300,000 to $499,999 | 262 (57.2%) | 1,036 (64.5%) |
| $500,000 to $749,999 | 72 (15.7%) | 302 (18.8%) |
| $750,000 to $999,999 | 7 (1.5%) | 37 (2.3%) |
| $1,000,000 or more | 0 (0.0%) | 39 (2.4%) |
| Total | 458 (100.0%) | 1,605 (100.0%) |
Household Income by Mortgage Status in Ramtown
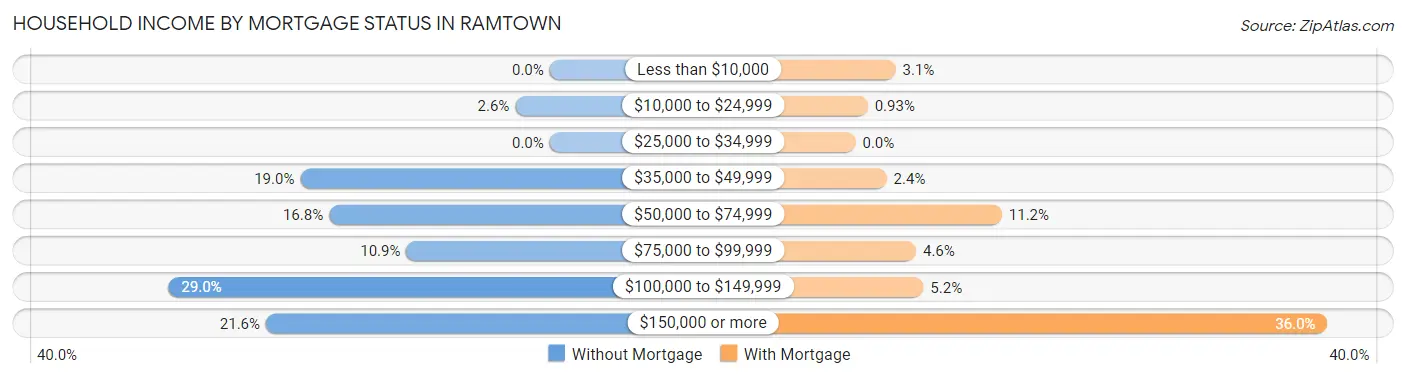
| Household Income | Without Mortgage | With Mortgage |
| Less than $10,000 | 0 (0.0%) | 49 (3.0%) |
| $10,000 to $24,999 | 12 (2.6%) | 15 (0.9%) |
| $25,000 to $34,999 | 0 (0.0%) | 0 (0.0%) |
| $35,000 to $49,999 | 87 (19.0%) | 38 (2.4%) |
| $50,000 to $74,999 | 77 (16.8%) | 179 (11.2%) |
| $75,000 to $99,999 | 50 (10.9%) | 74 (4.6%) |
| $100,000 to $149,999 | 133 (29.0%) | 83 (5.2%) |
| $150,000 or more | 99 (21.6%) | 577 (35.9%) |
| Total | 458 (100.0%) | 1,605 (100.0%) |
Property Value to Household Income Ratio in Ramtown
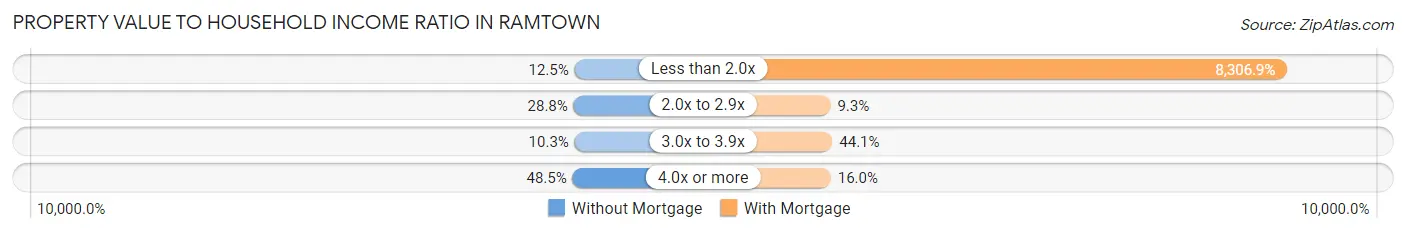
| Value-to-Income Ratio | Without Mortgage | With Mortgage |
| Less than 2.0x | 57 (12.4%) | 133,325 (8,306.9%) |
| 2.0x to 2.9x | 132 (28.8%) | 149 (9.3%) |
| 3.0x to 3.9x | 47 (10.3%) | 708 (44.1%) |
| 4.0x or more | 222 (48.5%) | 257 (16.0%) |
| Total | 458 (100.0%) | 1,605 (100.0%) |
Real Estate Taxes by Mortgage Status in Ramtown

| Property Taxes | Without Mortgage | With Mortgage |
| Less than $800 | 0 (0.0%) | 15 (0.9%) |
| $800 to $1,499 | 0 (0.0%) | 0 (0.0%) |
| $800 to $1,499 | 458 (100.0%) | 0 (0.0%) |
| Total | 458 (100.0%) | 1,605 (100.0%) |
Health & Disability in Ramtown
Health Insurance Coverage by Age in Ramtown
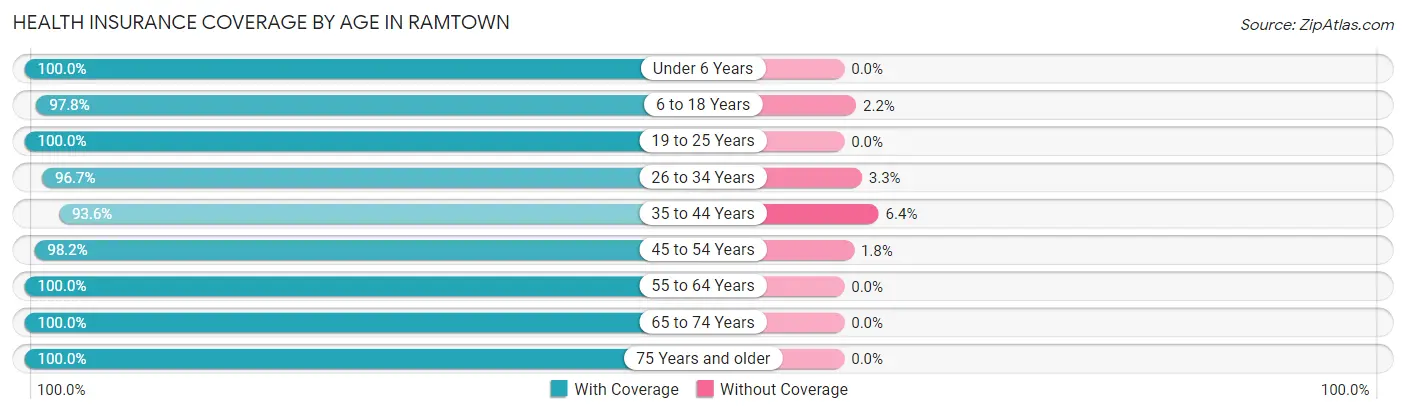
| Age Bracket | With Coverage | Without Coverage |
| Under 6 Years | 414 (100.0%) | 0 (0.0%) |
| 6 to 18 Years | 1,380 (97.8%) | 31 (2.2%) |
| 19 to 25 Years | 442 (100.0%) | 0 (0.0%) |
| 26 to 34 Years | 650 (96.7%) | 22 (3.3%) |
| 35 to 44 Years | 715 (93.6%) | 49 (6.4%) |
| 45 to 54 Years | 1,191 (98.2%) | 22 (1.8%) |
| 55 to 64 Years | 793 (100.0%) | 0 (0.0%) |
| 65 to 74 Years | 540 (100.0%) | 0 (0.0%) |
| 75 Years and older | 257 (100.0%) | 0 (0.0%) |
| Total | 6,382 (98.1%) | 124 (1.9%) |
Health Insurance Coverage by Citizenship Status in Ramtown
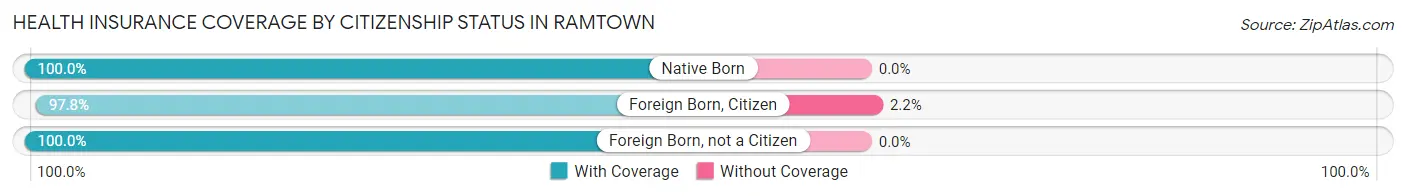
| Citizenship Status | With Coverage | Without Coverage |
| Native Born | 414 (100.0%) | 0 (0.0%) |
| Foreign Born, Citizen | 1,380 (97.8%) | 31 (2.2%) |
| Foreign Born, not a Citizen | 442 (100.0%) | 0 (0.0%) |
Health Insurance Coverage by Household Income in Ramtown
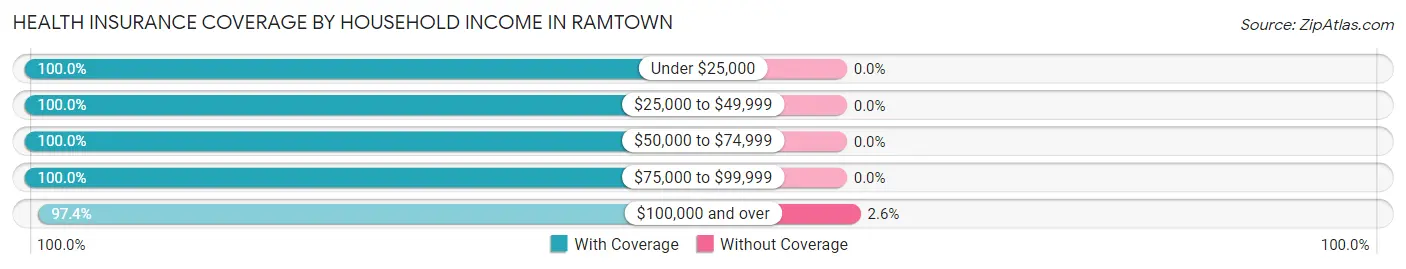
| Household Income | With Coverage | Without Coverage |
| Under $25,000 | 176 (100.0%) | 0 (0.0%) |
| $25,000 to $49,999 | 872 (100.0%) | 0 (0.0%) |
| $50,000 to $74,999 | 357 (100.0%) | 0 (0.0%) |
| $75,000 to $99,999 | 287 (100.0%) | 0 (0.0%) |
| $100,000 and over | 4,690 (97.4%) | 124 (2.6%) |
Public vs Private Health Insurance Coverage by Age in Ramtown
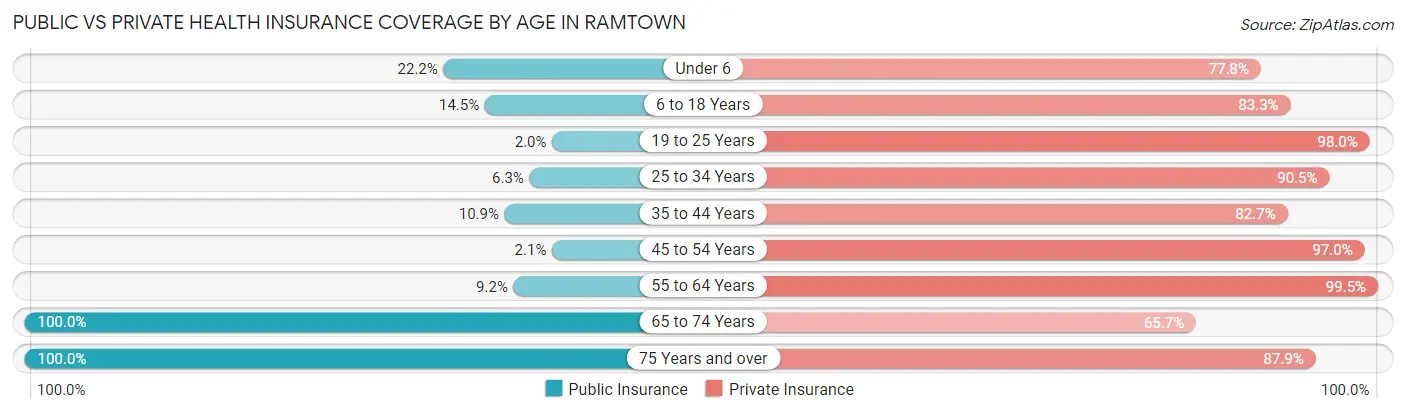
| Age Bracket | Public Insurance | Private Insurance |
| Under 6 | 92 (22.2%) | 322 (77.8%) |
| 6 to 18 Years | 205 (14.5%) | 1,175 (83.3%) |
| 19 to 25 Years | 9 (2.0%) | 433 (98.0%) |
| 25 to 34 Years | 42 (6.2%) | 608 (90.5%) |
| 35 to 44 Years | 83 (10.9%) | 632 (82.7%) |
| 45 to 54 Years | 25 (2.1%) | 1,177 (97.0%) |
| 55 to 64 Years | 73 (9.2%) | 789 (99.5%) |
| 65 to 74 Years | 540 (100.0%) | 355 (65.7%) |
| 75 Years and over | 257 (100.0%) | 226 (87.9%) |
| Total | 1,326 (20.4%) | 5,717 (87.9%) |
Disability Status by Sex by Age in Ramtown
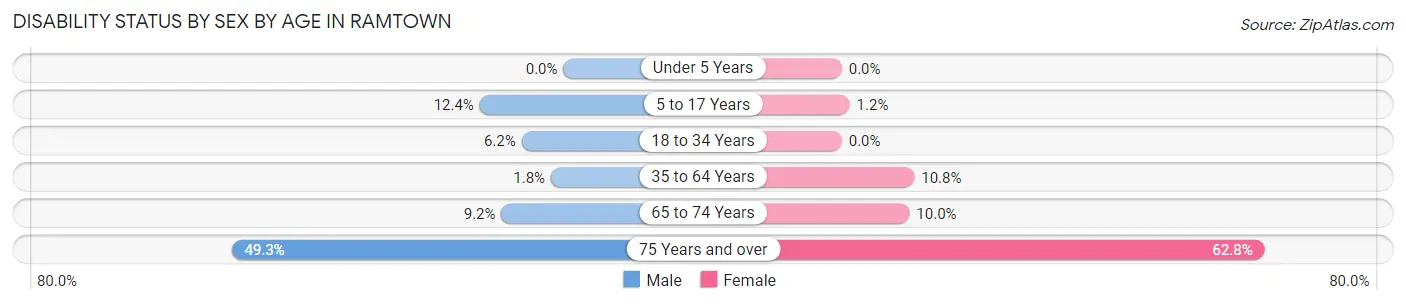
| Age Bracket | Male | Female |
| Under 5 Years | 0 (0.0%) | 0 (0.0%) |
| 5 to 17 Years | 103 (12.4%) | 6 (1.2%) |
| 18 to 34 Years | 37 (6.2%) | 0 (0.0%) |
| 35 to 64 Years | 24 (1.8%) | 158 (10.8%) |
| 65 to 74 Years | 24 (9.2%) | 28 (10.0%) |
| 75 Years and over | 34 (49.3%) | 118 (62.8%) |
Disability Class by Sex by Age in Ramtown
Disability Class: Hearing Difficulty
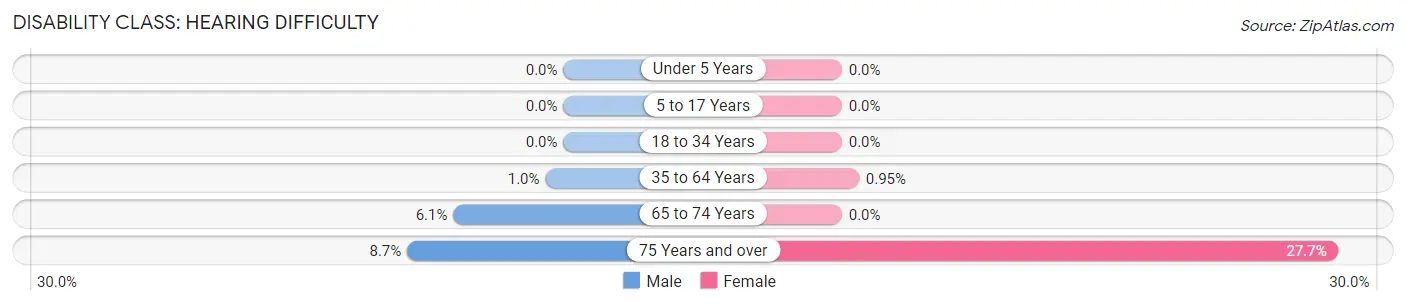
| Age Bracket | Male | Female |
| Under 5 Years | 0 (0.0%) | 0 (0.0%) |
| 5 to 17 Years | 0 (0.0%) | 0 (0.0%) |
| 18 to 34 Years | 0 (0.0%) | 0 (0.0%) |
| 35 to 64 Years | 13 (1.0%) | 14 (0.9%) |
| 65 to 74 Years | 16 (6.1%) | 0 (0.0%) |
| 75 Years and over | 6 (8.7%) | 52 (27.7%) |
Disability Class: Vision Difficulty
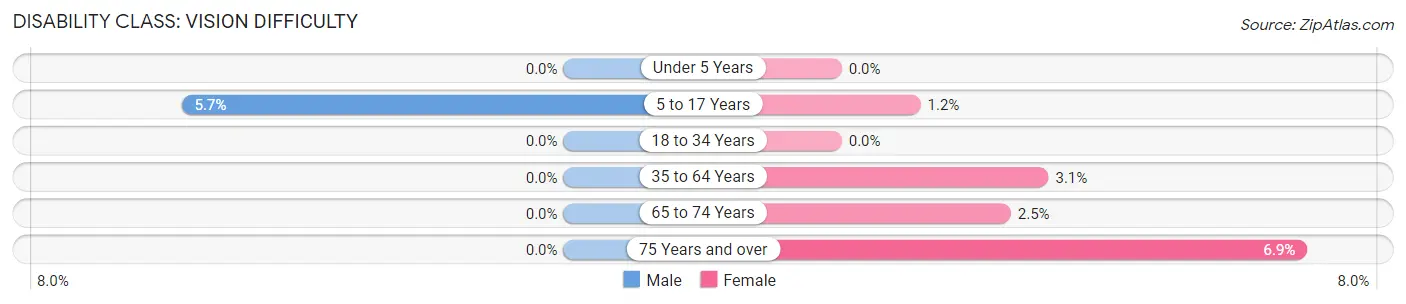
| Age Bracket | Male | Female |
| Under 5 Years | 0 (0.0%) | 0 (0.0%) |
| 5 to 17 Years | 47 (5.7%) | 6 (1.2%) |
| 18 to 34 Years | 0 (0.0%) | 0 (0.0%) |
| 35 to 64 Years | 0 (0.0%) | 45 (3.1%) |
| 65 to 74 Years | 0 (0.0%) | 7 (2.5%) |
| 75 Years and over | 0 (0.0%) | 13 (6.9%) |
Disability Class: Cognitive Difficulty
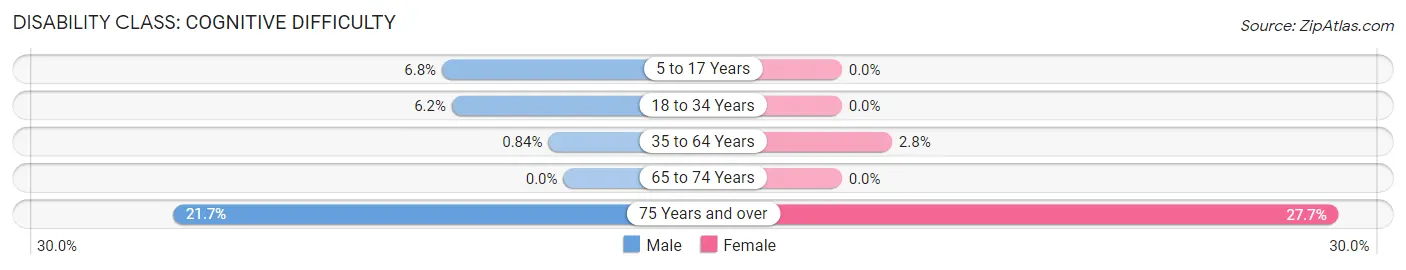
| Age Bracket | Male | Female |
| 5 to 17 Years | 56 (6.8%) | 0 (0.0%) |
| 18 to 34 Years | 37 (6.2%) | 0 (0.0%) |
| 35 to 64 Years | 11 (0.8%) | 41 (2.8%) |
| 65 to 74 Years | 0 (0.0%) | 0 (0.0%) |
| 75 Years and over | 15 (21.7%) | 52 (27.7%) |
Disability Class: Ambulatory Difficulty
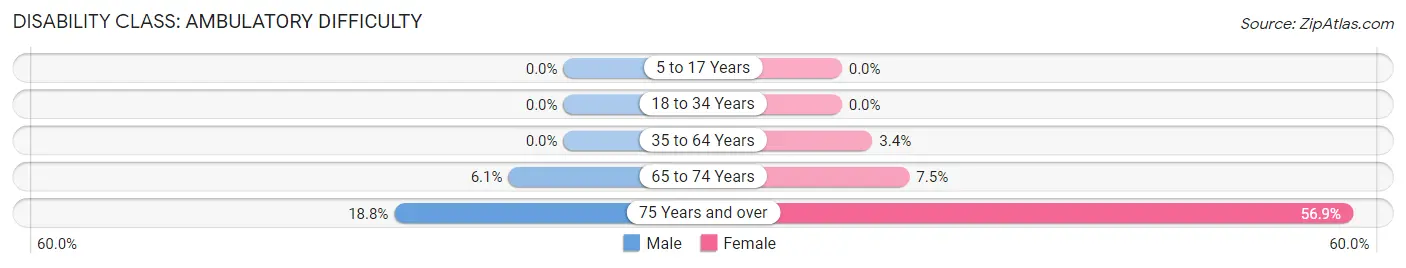
| Age Bracket | Male | Female |
| 5 to 17 Years | 0 (0.0%) | 0 (0.0%) |
| 18 to 34 Years | 0 (0.0%) | 0 (0.0%) |
| 35 to 64 Years | 0 (0.0%) | 50 (3.4%) |
| 65 to 74 Years | 16 (6.1%) | 21 (7.5%) |
| 75 Years and over | 13 (18.8%) | 107 (56.9%) |
Disability Class: Self-Care Difficulty
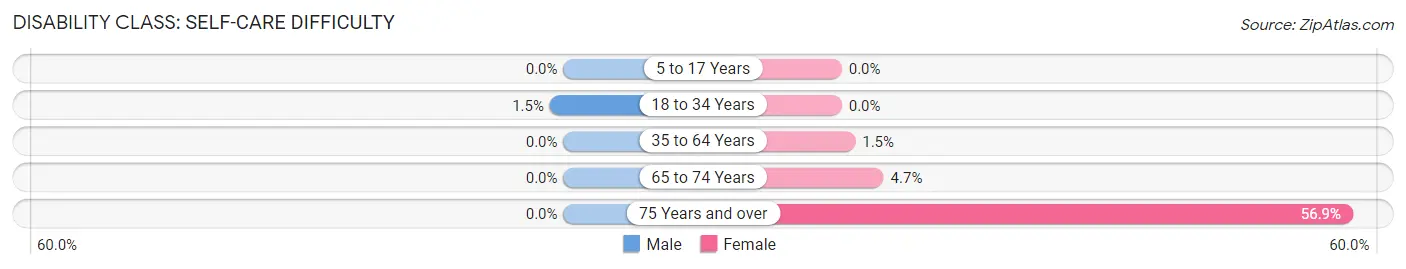
| Age Bracket | Male | Female |
| 5 to 17 Years | 0 (0.0%) | 0 (0.0%) |
| 18 to 34 Years | 9 (1.5%) | 0 (0.0%) |
| 35 to 64 Years | 0 (0.0%) | 22 (1.5%) |
| 65 to 74 Years | 0 (0.0%) | 13 (4.7%) |
| 75 Years and over | 0 (0.0%) | 107 (56.9%) |
Technology Access in Ramtown
Computing Device Access in Ramtown
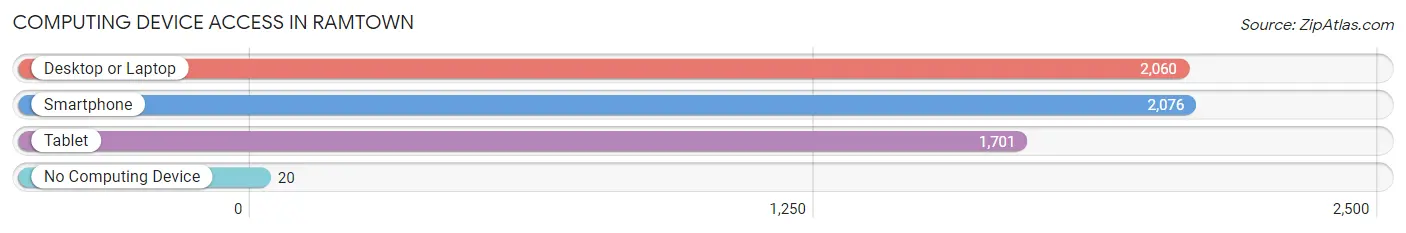
| Device Type | # Households | % Households |
| Desktop or Laptop | 2,060 | 96.1% |
| Smartphone | 2,076 | 96.9% |
| Tablet | 1,701 | 79.4% |
| No Computing Device | 20 | 0.9% |
| Total | 2,143 | 100.0% |
Internet Access in Ramtown
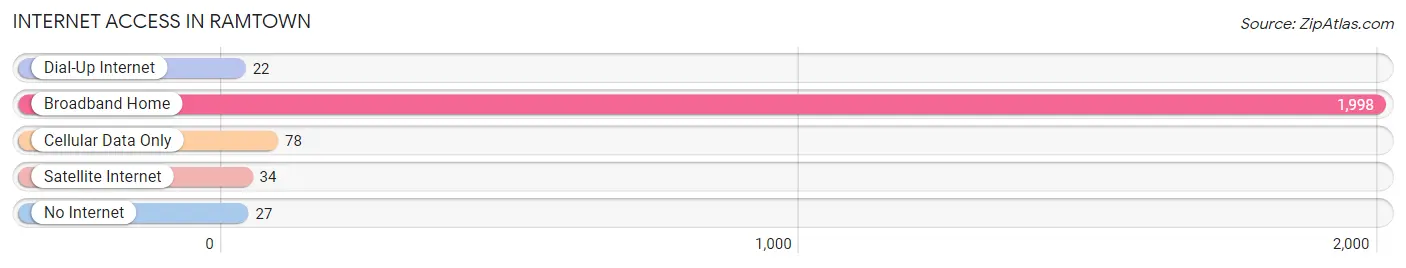
| Internet Type | # Households | % Households |
| Dial-Up Internet | 22 | 1.0% |
| Broadband Home | 1,998 | 93.2% |
| Cellular Data Only | 78 | 3.6% |
| Satellite Internet | 34 | 1.6% |
| No Internet | 27 | 1.3% |
| Total | 2,143 | 100.0% |
Ramtown Summary
Town of Ramtown
Ramtown is a small town located in Ocean County, New Jersey. It is situated on the banks of the Manasquan River, and is part of the Jersey Shore region. The town has a population of approximately 4,000 people, and is known for its small-town charm and friendly atmosphere.
History
The area that is now Ramtown was originally inhabited by the Lenape Native Americans. The first European settlers arrived in the area in the late 1600s, and the town was officially established in 1798. The town was named after the Ram family, who were among the first settlers.
In the early 1800s, the town was a thriving agricultural community, with many farms and orchards. The town also had a thriving fishing industry, and was home to several shipbuilding companies.
In the late 1800s, the town began to experience a period of growth and development. The town was connected to the rest of the state by the Central Railroad of New Jersey, and the town's population began to grow.
In the early 1900s, the town experienced a period of decline. The railroad was abandoned, and the town's economy began to suffer. However, in the late 1900s, the town began to experience a period of revitalization. The town was connected to the rest of the state by the Garden State Parkway, and the town's population began to grow again.
Geography
Ramtown is located in Ocean County, New Jersey. It is situated on the banks of the Manasquan River, and is part of the Jersey Shore region. The town has a total area of 2.2 square miles, all of which is land.
The town is bordered by the towns of Brick Township to the north, Toms River to the east, and Point Pleasant to the south. The town is also bordered by the Manasquan River to the west.
Economy
The economy of Ramtown is largely based on tourism and retail. The town is home to several small businesses, including restaurants, shops, and other retail establishments. The town is also home to several marinas, which attract visitors from all over the region.
The town is also home to several manufacturing companies, including a plastics factory and a metal fabrication plant. The town is also home to several small farms, which produce a variety of fruits and vegetables.
Demographics
As of the 2010 census, the population of Ramtown was 4,000. The racial makeup of the town was 94.2% White, 2.2% African American, 0.7% Asian, 0.3% Native American, and 2.6% from other races. Hispanic or Latino of any race were 4.2% of the population.
The median household income in Ramtown was $60,000, and the median family income was $68,000. The per capita income in the town was $25,000. About 8.2% of the population was below the poverty line.
Conclusion
Ramtown is a small town located in Ocean County, New Jersey. It is situated on the banks of the Manasquan River, and is part of the Jersey Shore region. The town has a population of approximately 4,000 people, and is known for its small-town charm and friendly atmosphere. The town's economy is largely based on tourism and retail, and the town is home to several small businesses, manufacturing companies, and farms. The town has a diverse population, with a median household income of $60,000 and a median family income of $68,000.
Common Questions
What is Per Capita Income in Ramtown?
Per Capita income in Ramtown is $45,392.
What is the Median Family Income in Ramtown?
Median Family Income in Ramtown is $123,750.
What is the Median Household income in Ramtown?
Median Household Income in Ramtown is $123,250.
What is Income or Wage Gap in Ramtown?
Income or Wage Gap in Ramtown is 15.9%.
Women in Ramtown earn 84.1 cents for every dollar earned by a man.
What is Inequality or Gini Index in Ramtown?
Inequality or Gini Index in Ramtown is 0.33.
What is the Total Population of Ramtown?
Total Population of Ramtown is 6,506.
What is the Total Male Population of Ramtown?
Total Male Population of Ramtown is 3,190.
What is the Total Female Population of Ramtown?
Total Female Population of Ramtown is 3,316.
What is the Ratio of Males per 100 Females in Ramtown?
There are 96.20 Males per 100 Females in Ramtown.
What is the Ratio of Females per 100 Males in Ramtown?
There are 103.95 Females per 100 Males in Ramtown.
What is the Median Population Age in Ramtown?
Median Population Age in Ramtown is 37.8 Years.
What is the Average Family Size in Ramtown
Average Family Size in Ramtown is 3.3 People.
What is the Average Household Size in Ramtown
Average Household Size in Ramtown is 3.0 People.
How Large is the Labor Force in Ramtown?
There are 3,482 People in the Labor Forcein in Ramtown.
What is the Percentage of People in the Labor Force in Ramtown?
70.1% of People are in the Labor Force in Ramtown.
What is the Unemployment Rate in Ramtown?
Unemployment Rate in Ramtown is 3.5%.