Mount Arlington borough, NJ Map & Demographics
Mount Arlington borough Overview
$49,096
PER CAPITA INCOME
$106,779
AVG FAMILY INCOME
$95,431
AVG HOUSEHOLD INCOME
26.7%
WAGE / INCOME GAP [ % ]
73.3¢/ $1
WAGE / INCOME GAP [ $ ]
0.40
INEQUALITY / GINI INDEX
5,863
TOTAL POPULATION
2,605
MALE POPULATION
3,258
FEMALE POPULATION
79.96
MALES / 100 FEMALES
125.07
FEMALES / 100 MALES
44.8
MEDIAN AGE
3.1
AVG FAMILY SIZE
2.4
AVG HOUSEHOLD SIZE
3,436
LABOR FORCE [ PEOPLE ]
70.0%
PERCENT IN LABOR FORCE
2.5%
UNEMPLOYMENT RATE
Income in Mount Arlington borough
Income Overview in Mount Arlington borough
Per Capita Income in Mount Arlington borough is $49,096, while median incomes of families and households are $106,779 and $95,431 respectively.
| Characteristic | Number | Measure |
| Per Capita Income | 5,863 | $49,096 |
| Median Family Income | 1,414 | $106,779 |
| Mean Family Income | 1,414 | $129,132 |
| Median Household Income | 2,422 | $95,431 |
| Mean Household Income | 2,422 | $116,693 |
| Income Deficit | 1,414 | $0 |
| Wage / Income Gap (%) | 5,863 | 26.75% |
| Wage / Income Gap ($) | 5,863 | 73.25¢ per $1 |
| Gini / Inequality Index | 5,863 | 0.40 |
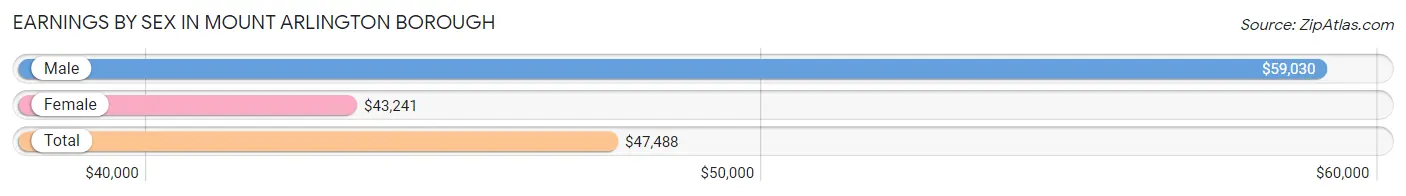
Earnings by Sex in Mount Arlington borough
Average Earnings in Mount Arlington borough are $47,488, $59,030 for men and $43,241 for women, a difference of 26.8%.
| Sex | Number | Average Earnings |
| Male | 1,599 (45.1%) | $59,030 |
| Female | 1,948 (54.9%) | $43,241 |
| Total | 3,547 (100.0%) | $47,488 |
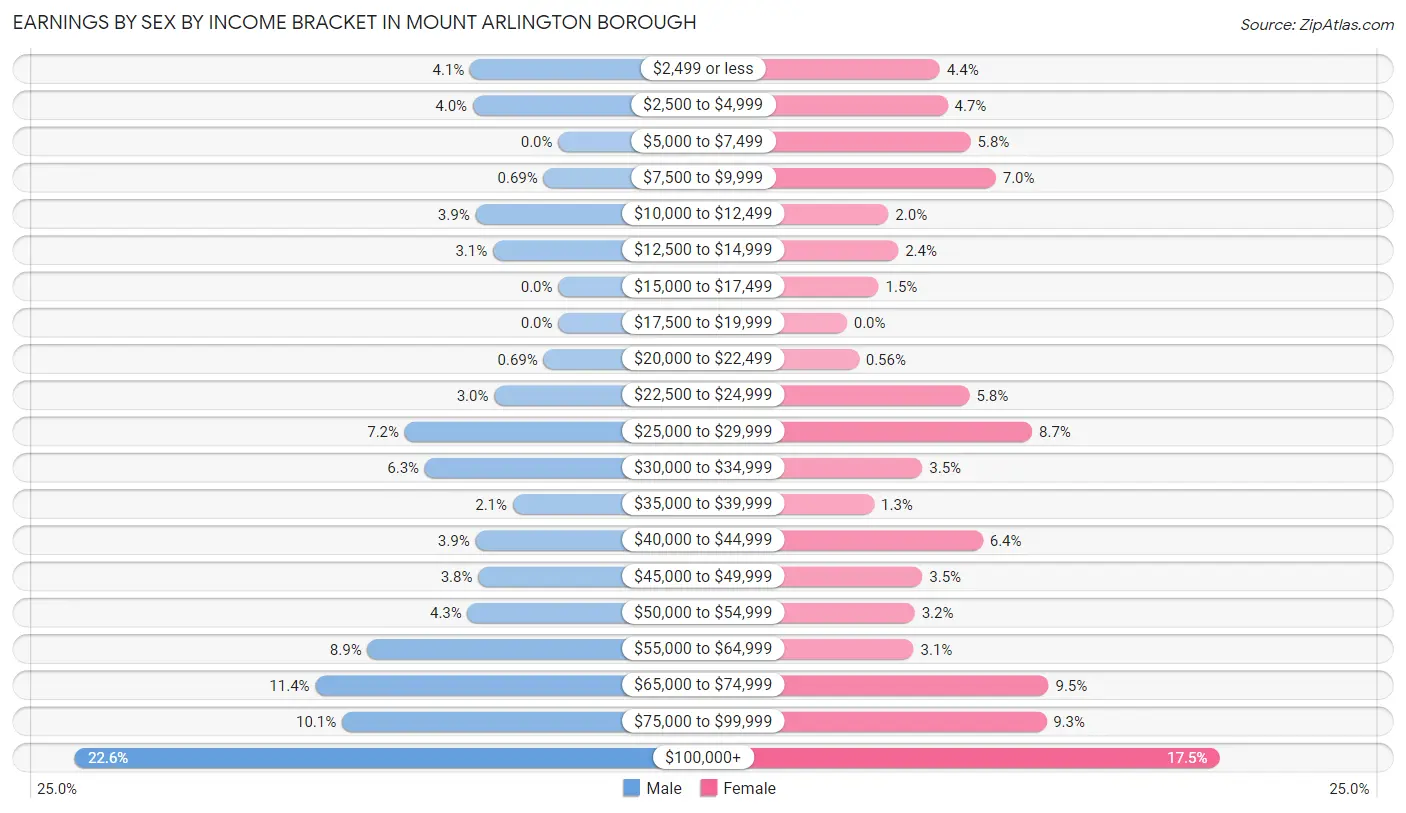
Earnings by Sex by Income Bracket in Mount Arlington borough
The most common earnings brackets in Mount Arlington borough are $100,000+ for men (362 | 22.6%) and $100,000+ for women (340 | 17.4%).
| Income | Male | Female |
| $2,499 or less | 66 (4.1%) | 85 (4.4%) |
| $2,500 to $4,999 | 64 (4.0%) | 92 (4.7%) |
| $5,000 to $7,499 | 0 (0.0%) | 113 (5.8%) |
| $7,500 to $9,999 | 11 (0.7%) | 136 (7.0%) |
| $10,000 to $12,499 | 62 (3.9%) | 38 (1.9%) |
| $12,500 to $14,999 | 49 (3.1%) | 47 (2.4%) |
| $15,000 to $17,499 | 0 (0.0%) | 29 (1.5%) |
| $17,500 to $19,999 | 0 (0.0%) | 0 (0.0%) |
| $20,000 to $22,499 | 11 (0.7%) | 11 (0.6%) |
| $22,500 to $24,999 | 48 (3.0%) | 112 (5.8%) |
| $25,000 to $29,999 | 115 (7.2%) | 169 (8.7%) |
| $30,000 to $34,999 | 100 (6.2%) | 69 (3.5%) |
| $35,000 to $39,999 | 34 (2.1%) | 25 (1.3%) |
| $40,000 to $44,999 | 62 (3.9%) | 124 (6.4%) |
| $45,000 to $49,999 | 60 (3.7%) | 69 (3.5%) |
| $50,000 to $54,999 | 68 (4.3%) | 62 (3.2%) |
| $55,000 to $64,999 | 143 (8.9%) | 61 (3.1%) |
| $65,000 to $74,999 | 182 (11.4%) | 184 (9.5%) |
| $75,000 to $99,999 | 162 (10.1%) | 182 (9.3%) |
| $100,000+ | 362 (22.6%) | 340 (17.4%) |
| Total | 1,599 (100.0%) | 1,948 (100.0%) |
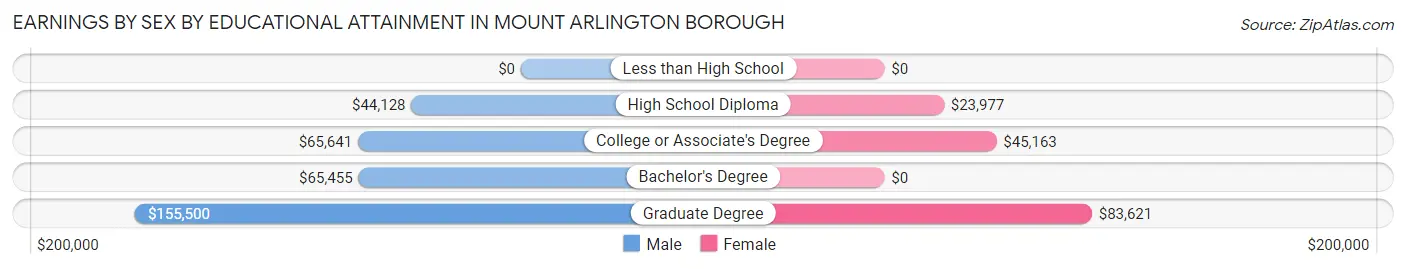
Earnings by Sex by Educational Attainment in Mount Arlington borough
Average earnings in Mount Arlington borough are $64,399 for men and $45,707 for women, a difference of 29.0%. Men with an educational attainment of graduate degree enjoy the highest average annual earnings of $155,500, while those with high school diploma education earn the least with $44,128. Women with an educational attainment of graduate degree earn the most with the average annual earnings of $83,621, while those with high school diploma education have the smallest earnings of $23,977.
| Educational Attainment | Male Income | Female Income |
| Less than High School | - | - |
| High School Diploma | $44,128 | $23,977 |
| College or Associate's Degree | $65,641 | $45,163 |
| Bachelor's Degree | $65,455 | $0 |
| Graduate Degree | $155,500 | $83,621 |
| Total | $64,399 | $45,707 |
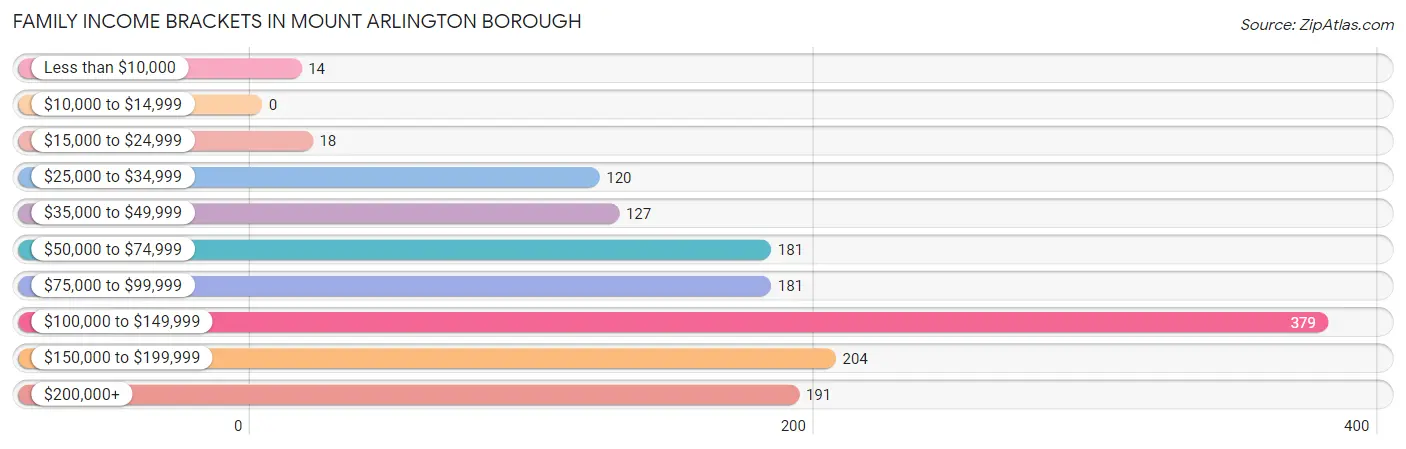
Family Income in Mount Arlington borough
Family Income Brackets in Mount Arlington borough
According to the Mount Arlington borough family income data, there are 379 families falling into the $100,000 to $149,999 income range, which is the most common income bracket and makes up 26.8% of all families.
| Income Bracket | # Families | % Families |
| Less than $10,000 | 14 | 1.0% |
| $10,000 to $14,999 | 0 | 0.0% |
| $15,000 to $24,999 | 18 | 1.3% |
| $25,000 to $34,999 | 120 | 8.5% |
| $35,000 to $49,999 | 127 | 9.0% |
| $50,000 to $74,999 | 181 | 12.8% |
| $75,000 to $99,999 | 181 | 12.8% |
| $100,000 to $149,999 | 379 | 26.8% |
| $150,000 to $199,999 | 204 | 14.4% |
| $200,000+ | 191 | 13.5% |
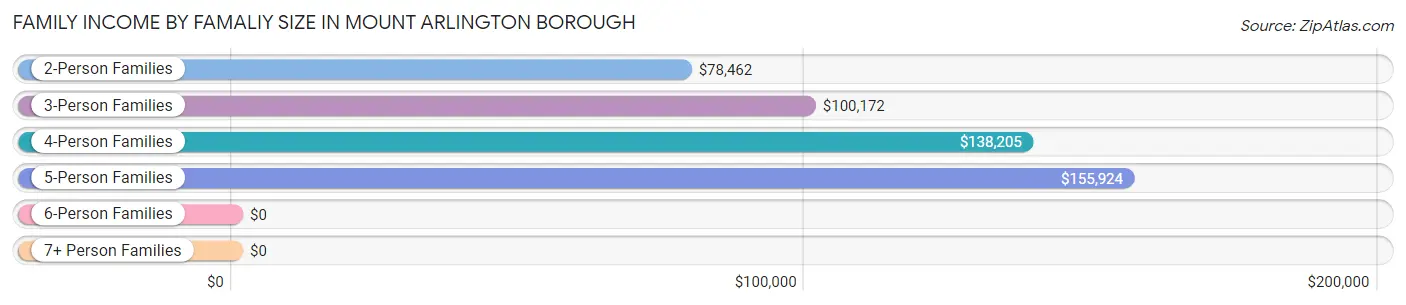
Family Income by Famaliy Size in Mount Arlington borough
5-person families (83 | 5.9%) account for the highest median family income in Mount Arlington borough with $155,924 per family, while 2-person families (568 | 40.2%) have the highest median income of $39,231 per family member.
| Income Bracket | # Families | Median Income |
| 2-Person Families | 568 (40.2%) | $78,462 |
| 3-Person Families | 474 (33.5%) | $100,172 |
| 4-Person Families | 270 (19.1%) | $138,205 |
| 5-Person Families | 83 (5.9%) | $155,924 |
| 6-Person Families | 0 (0.0%) | $0 |
| 7+ Person Families | 19 (1.3%) | $0 |
| Total | 1,414 (100.0%) | $106,779 |
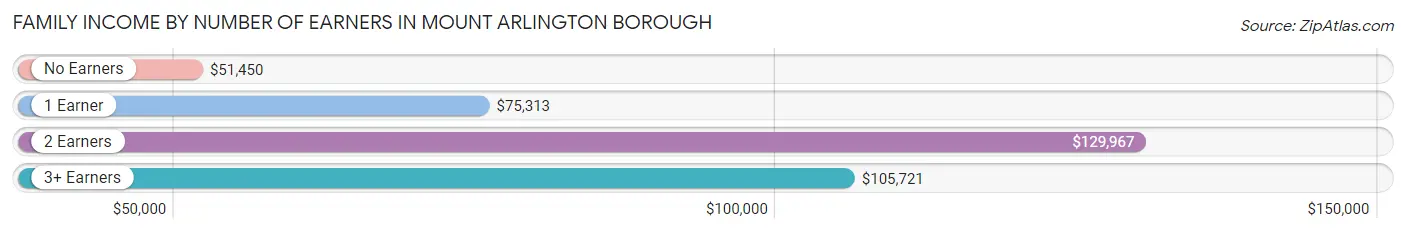
Family Income by Number of Earners in Mount Arlington borough
The median family income in Mount Arlington borough is $106,779, with families comprising 2 earners (575) having the highest median family income of $129,967, while families with no earners (189) have the lowest median family income of $51,450, accounting for 40.7% and 13.4% of families, respectively.
| Number of Earners | # Families | Median Income |
| No Earners | 189 (13.4%) | $51,450 |
| 1 Earner | 413 (29.2%) | $75,313 |
| 2 Earners | 575 (40.7%) | $129,967 |
| 3+ Earners | 237 (16.8%) | $105,721 |
| Total | 1,414 (100.0%) | $106,779 |
Household Income in Mount Arlington borough
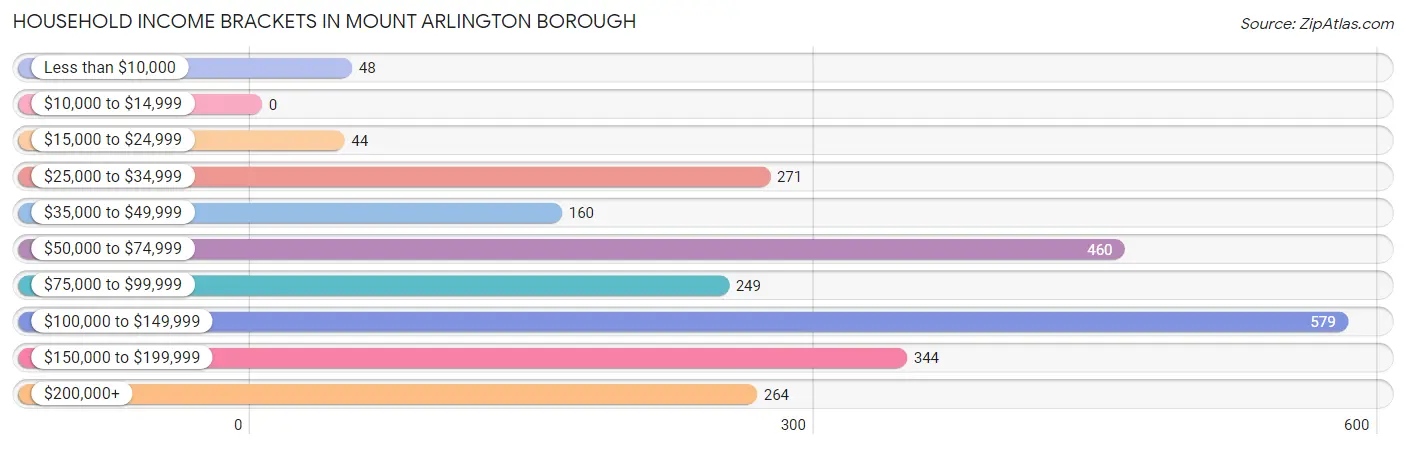
Household Income Brackets in Mount Arlington borough
With 579 households falling in the category, the $100,000 to $149,999 income range is the most frequent in Mount Arlington borough, accounting for 23.9% of all households.
| Income Bracket | # Households | % Households |
| Less than $10,000 | 48 | 2.0% |
| $10,000 to $14,999 | 0 | 0.0% |
| $15,000 to $24,999 | 44 | 1.8% |
| $25,000 to $34,999 | 271 | 11.2% |
| $35,000 to $49,999 | 160 | 6.6% |
| $50,000 to $74,999 | 460 | 19.0% |
| $75,000 to $99,999 | 249 | 10.3% |
| $100,000 to $149,999 | 579 | 23.9% |
| $150,000 to $199,999 | 344 | 14.2% |
| $200,000+ | 264 | 10.9% |
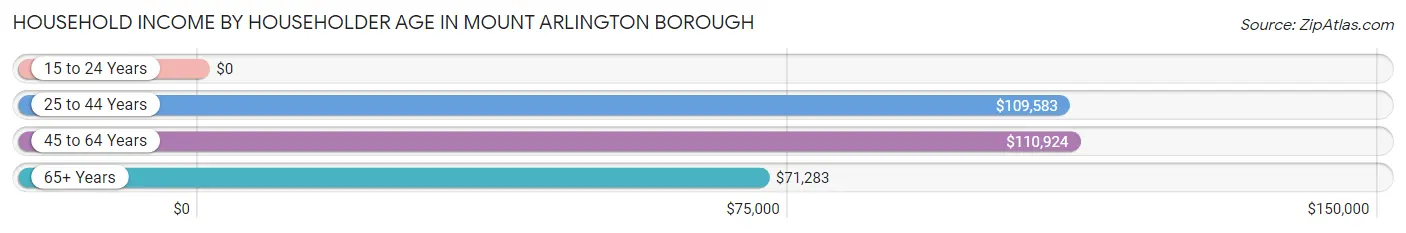
Household Income by Householder Age in Mount Arlington borough
The median household income in Mount Arlington borough is $95,431, with the highest median household income of $110,924 found in the 45 to 64 years age bracket for the primary householder. A total of 917 households (37.9%) fall into this category. Meanwhile, the 15 to 24 years age bracket for the primary householder has the lowest median household income of $0, with 52 households (2.1%) in this group.
| Income Bracket | # Households | Median Income |
| 15 to 24 Years | 52 (2.1%) | $0 |
| 25 to 44 Years | 638 (26.3%) | $109,583 |
| 45 to 64 Years | 917 (37.9%) | $110,924 |
| 65+ Years | 815 (33.7%) | $71,283 |
| Total | 2,422 (100.0%) | $95,431 |
Poverty in Mount Arlington borough
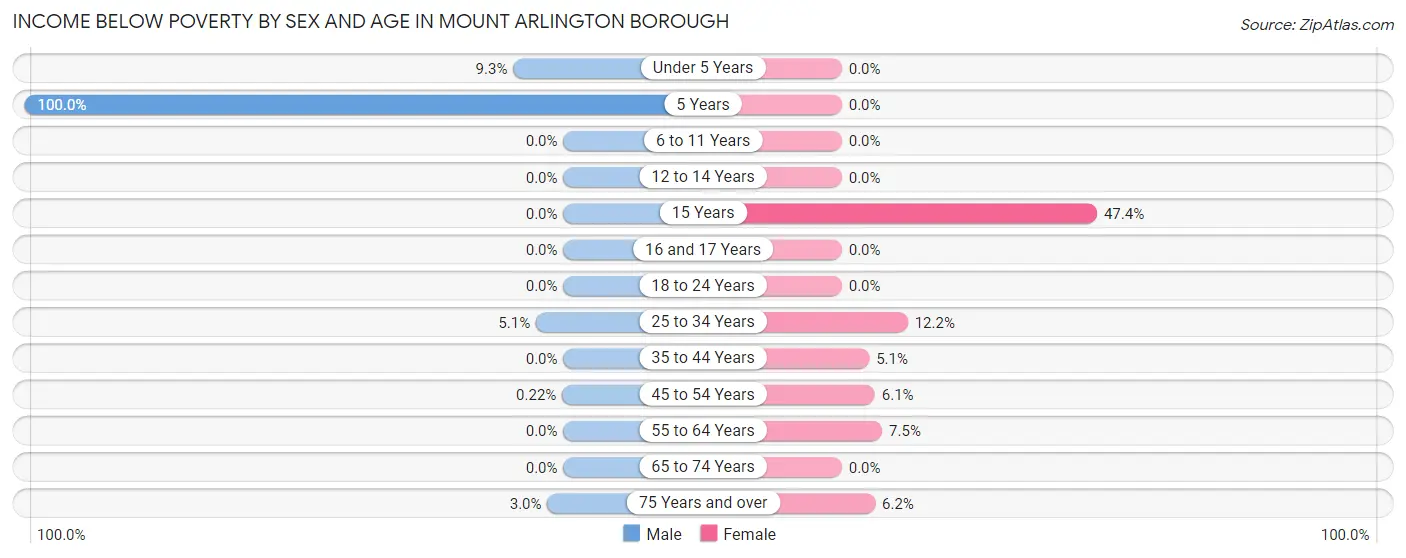
Income Below Poverty by Sex and Age in Mount Arlington borough
With 2.4% poverty level for males and 5.2% for females among the residents of Mount Arlington borough, 5 year old males and 15 year old females are the most vulnerable to poverty, with 21 males (100.0%) and 18 females (47.4%) in their respective age groups living below the poverty level.
| Age Bracket | Male | Female |
| Under 5 Years | 16 (9.3%) | 0 (0.0%) |
| 5 Years | 21 (100.0%) | 0 (0.0%) |
| 6 to 11 Years | 0 (0.0%) | 0 (0.0%) |
| 12 to 14 Years | 0 (0.0%) | 0 (0.0%) |
| 15 Years | 0 (0.0%) | 18 (47.4%) |
| 16 and 17 Years | 0 (0.0%) | 0 (0.0%) |
| 18 to 24 Years | 0 (0.0%) | 0 (0.0%) |
| 25 to 34 Years | 18 (5.1%) | 54 (12.2%) |
| 35 to 44 Years | 0 (0.0%) | 19 (5.1%) |
| 45 to 54 Years | 1 (0.2%) | 26 (6.1%) |
| 55 to 64 Years | 0 (0.0%) | 35 (7.5%) |
| 65 to 74 Years | 0 (0.0%) | 0 (0.0%) |
| 75 Years and over | 6 (3.0%) | 16 (6.2%) |
| Total | 62 (2.4%) | 168 (5.2%) |
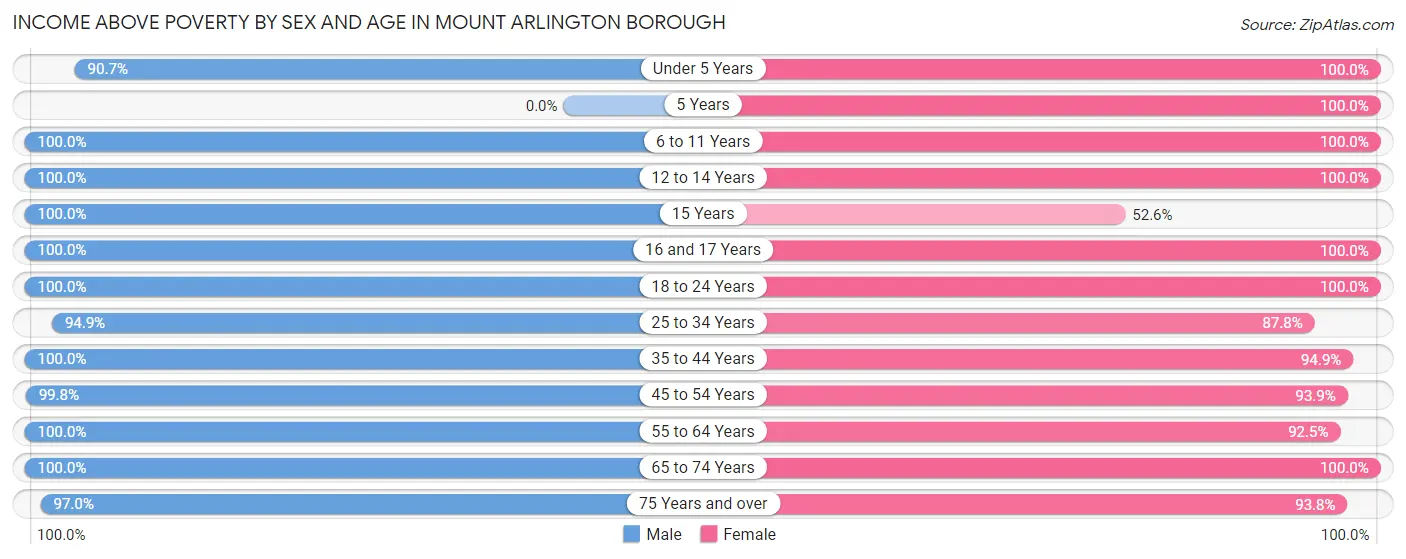
Income Above Poverty by Sex and Age in Mount Arlington borough
According to the poverty statistics in Mount Arlington borough, males aged 6 to 11 years and females aged under 5 years are the age groups that are most secure financially, with 100.0% of males and 100.0% of females in these age groups living above the poverty line.
| Age Bracket | Male | Female |
| Under 5 Years | 156 (90.7%) | 167 (100.0%) |
| 5 Years | 0 (0.0%) | 21 (100.0%) |
| 6 to 11 Years | 180 (100.0%) | 197 (100.0%) |
| 12 to 14 Years | 22 (100.0%) | 75 (100.0%) |
| 15 Years | 36 (100.0%) | 20 (52.6%) |
| 16 and 17 Years | 30 (100.0%) | 99 (100.0%) |
| 18 to 24 Years | 232 (100.0%) | 255 (100.0%) |
| 25 to 34 Years | 336 (94.9%) | 387 (87.8%) |
| 35 to 44 Years | 225 (100.0%) | 354 (94.9%) |
| 45 to 54 Years | 452 (99.8%) | 398 (93.9%) |
| 55 to 64 Years | 355 (100.0%) | 432 (92.5%) |
| 65 to 74 Years | 298 (100.0%) | 442 (100.0%) |
| 75 Years and over | 196 (97.0%) | 243 (93.8%) |
| Total | 2,518 (97.6%) | 3,090 (94.8%) |
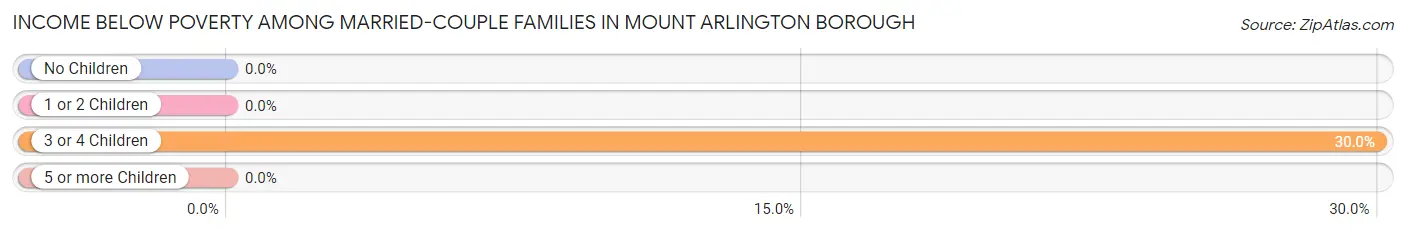
Income Below Poverty Among Married-Couple Families in Mount Arlington borough
The poverty statistics for married-couple families in Mount Arlington borough show that 1.8% or 18 of the total 1,030 families live below the poverty line. Families with 3 or 4 children have the highest poverty rate of 30.0%, comprising of 18 families. On the other hand, families with no children have the lowest poverty rate of 0.0%, which includes 0 families.
| Children | Above Poverty | Below Poverty |
| No Children | 576 (100.0%) | 0 (0.0%) |
| 1 or 2 Children | 394 (100.0%) | 0 (0.0%) |
| 3 or 4 Children | 42 (70.0%) | 18 (30.0%) |
| 5 or more Children | 0 (0.0%) | 0 (0.0%) |
| Total | 1,012 (98.3%) | 18 (1.8%) |
Income Below Poverty Among Single-Parent Households in Mount Arlington borough
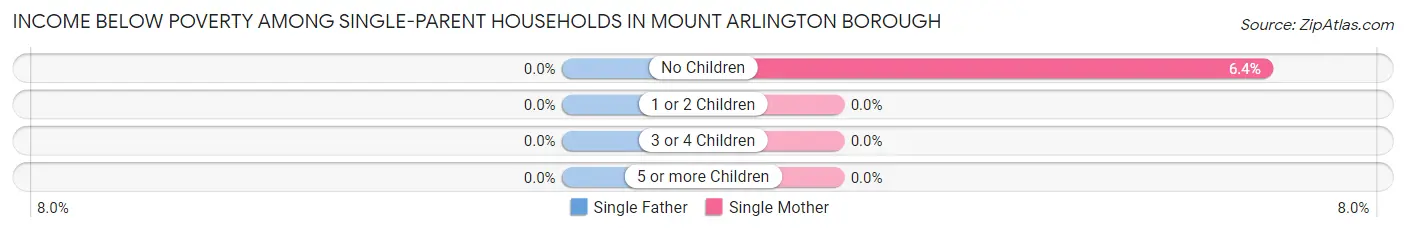
| Children | Single Father | Single Mother |
| No Children | 0 (0.0%) | 14 (6.4%) |
| 1 or 2 Children | 0 (0.0%) | 0 (0.0%) |
| 3 or 4 Children | 0 (0.0%) | 0 (0.0%) |
| 5 or more Children | 0 (0.0%) | 0 (0.0%) |
| Total | 0 (0.0%) | 14 (3.8%) |
Income Below Poverty Among Married-Couple vs Single-Parent Households in Mount Arlington borough
The poverty data for Mount Arlington borough shows that 18 of the married-couple family households (1.8%) and 14 of the single-parent households (3.6%) are living below the poverty level. Within the married-couple family households, those with 3 or 4 children have the highest poverty rate, with 18 households (30.0%) falling below the poverty line. Among the single-parent households, those with no children have the highest poverty rate, with 14 household (6.4%) living below poverty.
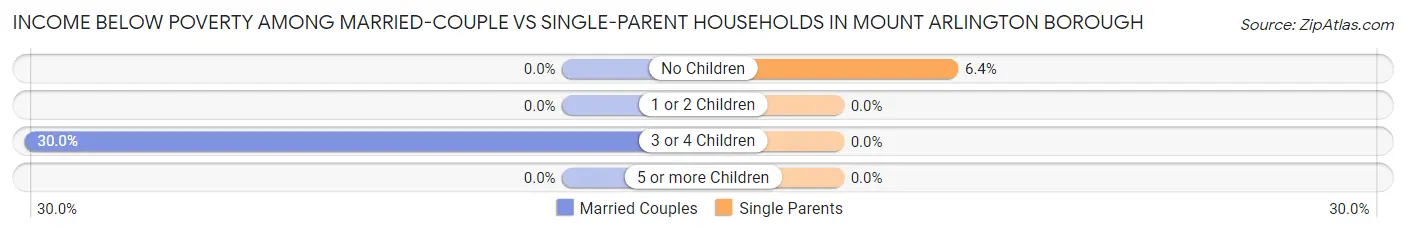
| Children | Married-Couple Families | Single-Parent Households |
| No Children | 0 (0.0%) | 14 (6.4%) |
| 1 or 2 Children | 0 (0.0%) | 0 (0.0%) |
| 3 or 4 Children | 18 (30.0%) | 0 (0.0%) |
| 5 or more Children | 0 (0.0%) | 0 (0.0%) |
| Total | 18 (1.8%) | 14 (3.6%) |
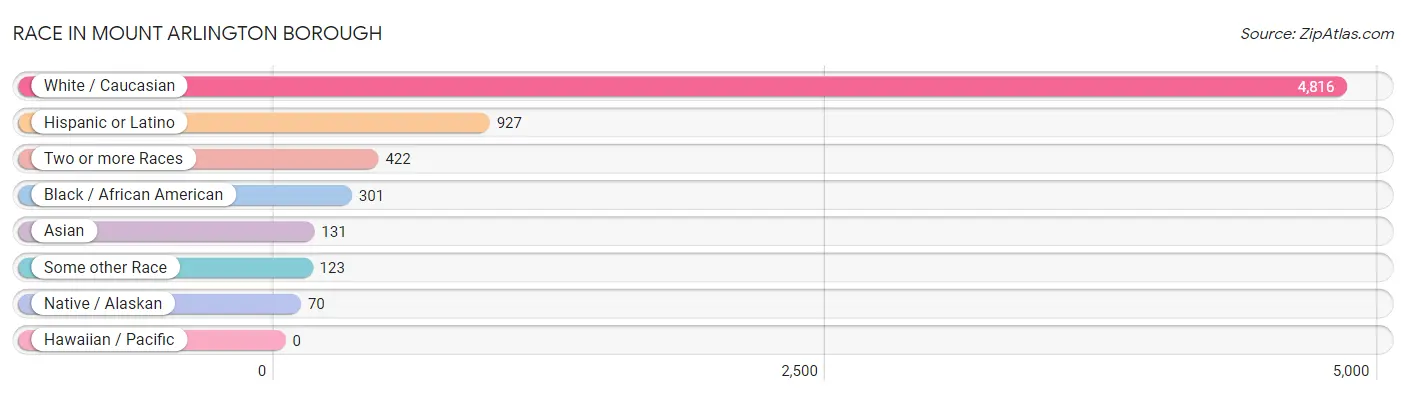
Race in Mount Arlington borough
The most populous races in Mount Arlington borough are White / Caucasian (4,816 | 82.1%), Hispanic or Latino (927 | 15.8%), and Two or more Races (422 | 7.2%).
| Race | # Population | % Population |
| Asian | 131 | 2.2% |
| Black / African American | 301 | 5.1% |
| Hawaiian / Pacific | 0 | 0.0% |
| Hispanic or Latino | 927 | 15.8% |
| Native / Alaskan | 70 | 1.2% |
| White / Caucasian | 4,816 | 82.1% |
| Two or more Races | 422 | 7.2% |
| Some other Race | 123 | 2.1% |
| Total | 5,863 | 100.0% |
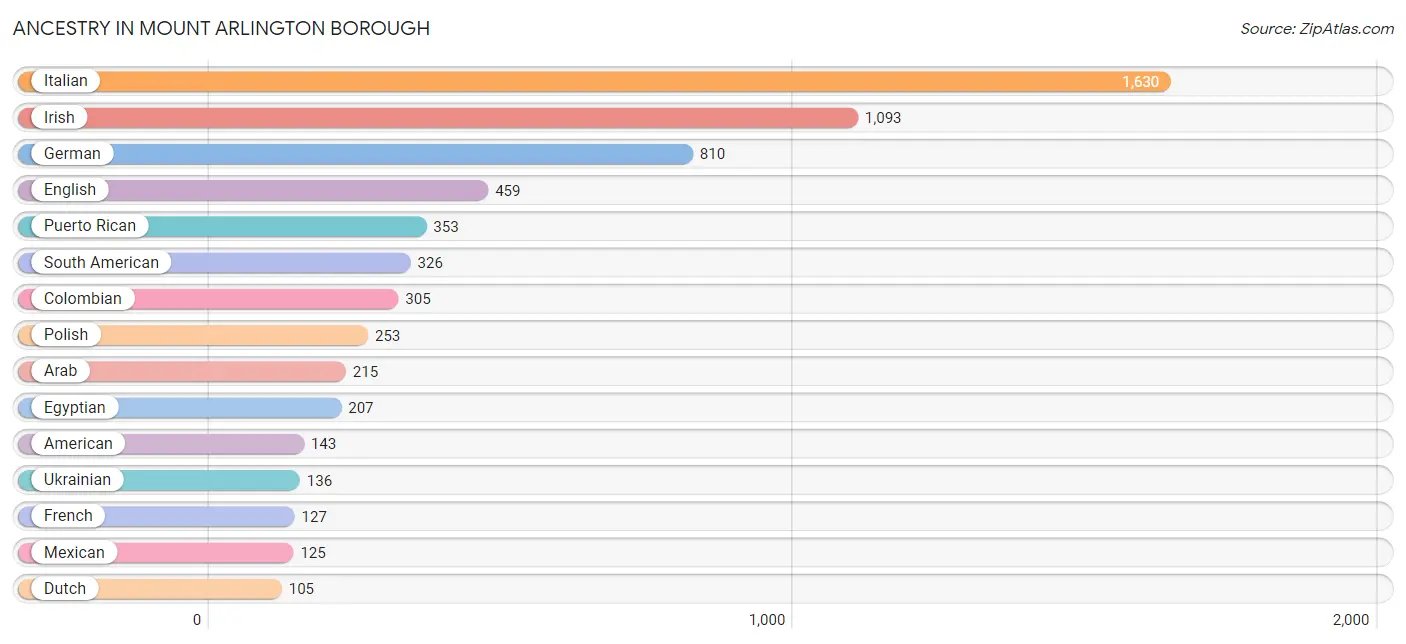
Ancestry in Mount Arlington borough
The most populous ancestries reported in Mount Arlington borough are Italian (1,630 | 27.8%), Irish (1,093 | 18.6%), German (810 | 13.8%), English (459 | 7.8%), and Puerto Rican (353 | 6.0%), together accounting for 74.1% of all Mount Arlington borough residents.
| Ancestry | # Population | % Population |
| American | 143 | 2.4% |
| Arab | 215 | 3.7% |
| Austrian | 27 | 0.5% |
| Belgian | 7 | 0.1% |
| Cambodian | 20 | 0.3% |
| Celtic | 8 | 0.1% |
| Central American | 74 | 1.3% |
| Colombian | 305 | 5.2% |
| Costa Rican | 44 | 0.7% |
| Cuban | 15 | 0.3% |
| Czech | 27 | 0.5% |
| Dominican | 11 | 0.2% |
| Dutch | 105 | 1.8% |
| Egyptian | 207 | 3.5% |
| English | 459 | 7.8% |
| European | 17 | 0.3% |
| French | 127 | 2.2% |
| German | 810 | 13.8% |
| Greek | 63 | 1.1% |
| Hungarian | 77 | 1.3% |
| Irish | 1,093 | 18.6% |
| Italian | 1,630 | 27.8% |
| Korean | 62 | 1.1% |
| Lebanese | 8 | 0.1% |
| Lithuanian | 7 | 0.1% |
| Maltese | 12 | 0.2% |
| Mexican | 125 | 2.1% |
| Norwegian | 43 | 0.7% |
| Panamanian | 30 | 0.5% |
| Peruvian | 21 | 0.4% |
| Polish | 253 | 4.3% |
| Puerto Rican | 353 | 6.0% |
| Russian | 41 | 0.7% |
| Scandinavian | 12 | 0.2% |
| Scottish | 75 | 1.3% |
| Slavic | 12 | 0.2% |
| South American | 326 | 5.6% |
| Swedish | 27 | 0.5% |
| Swiss | 36 | 0.6% |
| Thai | 82 | 1.4% |
| Turkish | 32 | 0.5% |
| Ukrainian | 136 | 2.3% |
| Welsh | 17 | 0.3% | View All 43 Rows |
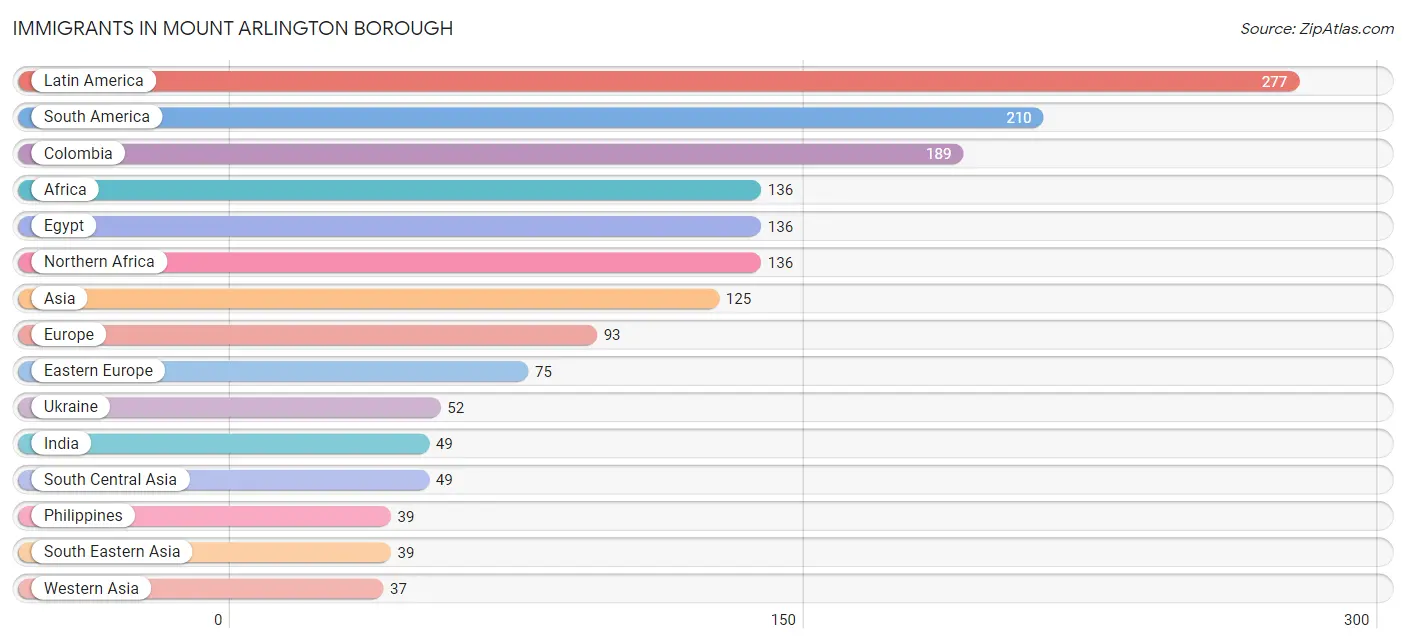
Immigrants in Mount Arlington borough
The most numerous immigrant groups reported in Mount Arlington borough came from Latin America (277 | 4.7%), South America (210 | 3.6%), Colombia (189 | 3.2%), Africa (136 | 2.3%), and Egypt (136 | 2.3%), together accounting for 16.2% of all Mount Arlington borough residents.
| Immigration Origin | # Population | % Population |
| Africa | 136 | 2.3% |
| Asia | 125 | 2.1% |
| Belarus | 23 | 0.4% |
| Caribbean | 34 | 0.6% |
| Central America | 33 | 0.6% |
| Colombia | 189 | 3.2% |
| Cuba | 34 | 0.6% |
| Eastern Europe | 75 | 1.3% |
| Egypt | 136 | 2.3% |
| Europe | 93 | 1.6% |
| Germany | 9 | 0.2% |
| Greece | 8 | 0.1% |
| India | 49 | 0.8% |
| Italy | 1 | 0.0% |
| Latin America | 277 | 4.7% |
| Lebanon | 15 | 0.3% |
| Mexico | 33 | 0.6% |
| Northern Africa | 136 | 2.3% |
| Peru | 21 | 0.4% |
| Philippines | 39 | 0.7% |
| South America | 210 | 3.6% |
| South Central Asia | 49 | 0.8% |
| South Eastern Asia | 39 | 0.7% |
| Southern Europe | 9 | 0.2% |
| Turkey | 22 | 0.4% |
| Ukraine | 52 | 0.9% |
| Western Asia | 37 | 0.6% |
| Western Europe | 9 | 0.2% | View All 28 Rows |
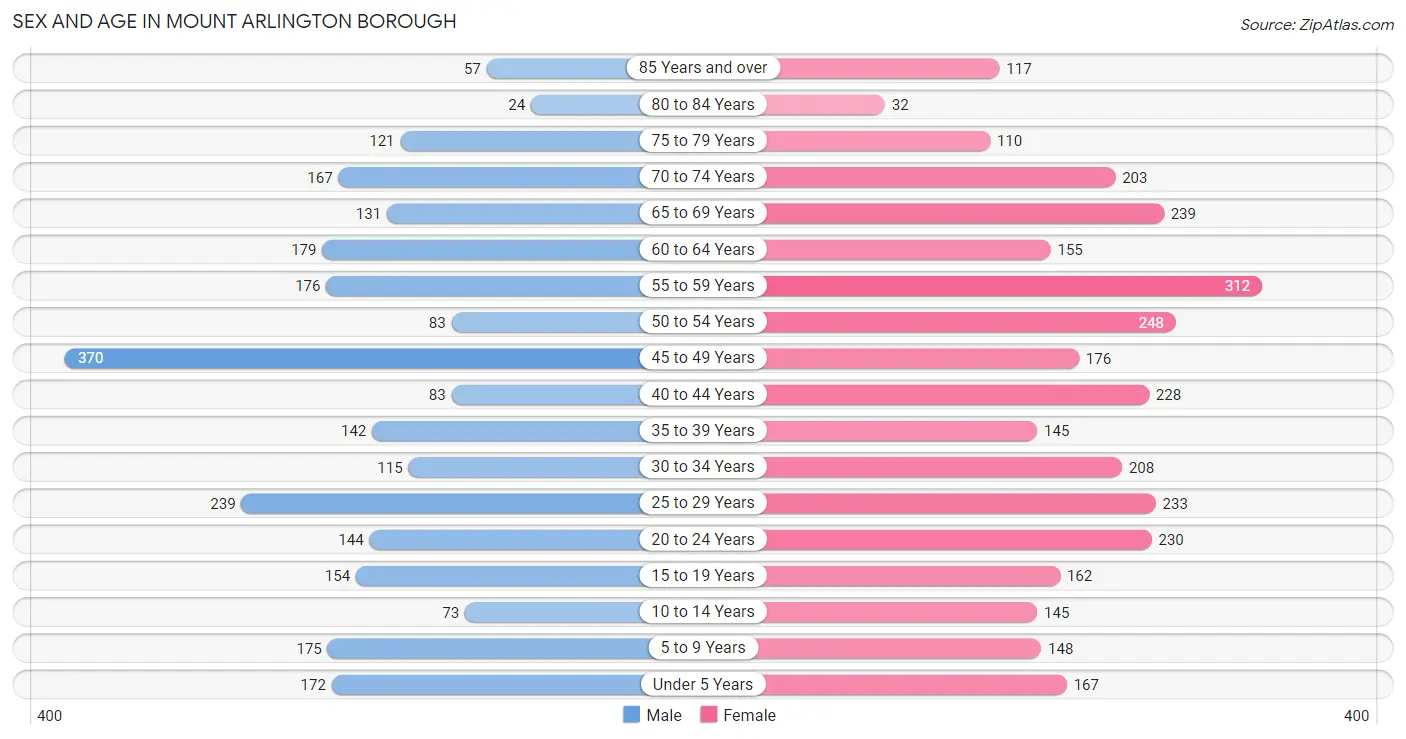
Sex and Age in Mount Arlington borough
Sex and Age in Mount Arlington borough
The most populous age groups in Mount Arlington borough are 45 to 49 Years (370 | 14.2%) for men and 55 to 59 Years (312 | 9.6%) for women.
| Age Bracket | Male | Female |
| Under 5 Years | 172 (6.6%) | 167 (5.1%) |
| 5 to 9 Years | 175 (6.7%) | 148 (4.5%) |
| 10 to 14 Years | 73 (2.8%) | 145 (4.4%) |
| 15 to 19 Years | 154 (5.9%) | 162 (5.0%) |
| 20 to 24 Years | 144 (5.5%) | 230 (7.1%) |
| 25 to 29 Years | 239 (9.2%) | 233 (7.1%) |
| 30 to 34 Years | 115 (4.4%) | 208 (6.4%) |
| 35 to 39 Years | 142 (5.4%) | 145 (4.4%) |
| 40 to 44 Years | 83 (3.2%) | 228 (7.0%) |
| 45 to 49 Years | 370 (14.2%) | 176 (5.4%) |
| 50 to 54 Years | 83 (3.2%) | 248 (7.6%) |
| 55 to 59 Years | 176 (6.8%) | 312 (9.6%) |
| 60 to 64 Years | 179 (6.9%) | 155 (4.8%) |
| 65 to 69 Years | 131 (5.0%) | 239 (7.3%) |
| 70 to 74 Years | 167 (6.4%) | 203 (6.2%) |
| 75 to 79 Years | 121 (4.6%) | 110 (3.4%) |
| 80 to 84 Years | 24 (0.9%) | 32 (1.0%) |
| 85 Years and over | 57 (2.2%) | 117 (3.6%) |
| Total | 2,605 (100.0%) | 3,258 (100.0%) |
Families and Households in Mount Arlington borough
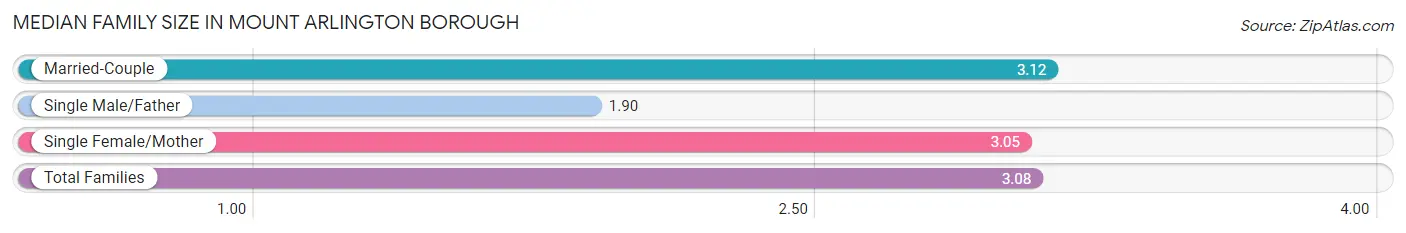
Median Family Size in Mount Arlington borough
The median family size in Mount Arlington borough is 3.08 persons per family, with married-couple families (1,030 | 72.8%) accounting for the largest median family size of 3.12 persons per family. On the other hand, single male/father families (20 | 1.4%) represent the smallest median family size with 1.90 persons per family.
| Family Type | # Families | Family Size |
| Married-Couple | 1,030 (72.8%) | 3.12 |
| Single Male/Father | 20 (1.4%) | 1.90 |
| Single Female/Mother | 364 (25.7%) | 3.05 |
| Total Families | 1,414 (100.0%) | 3.08 |
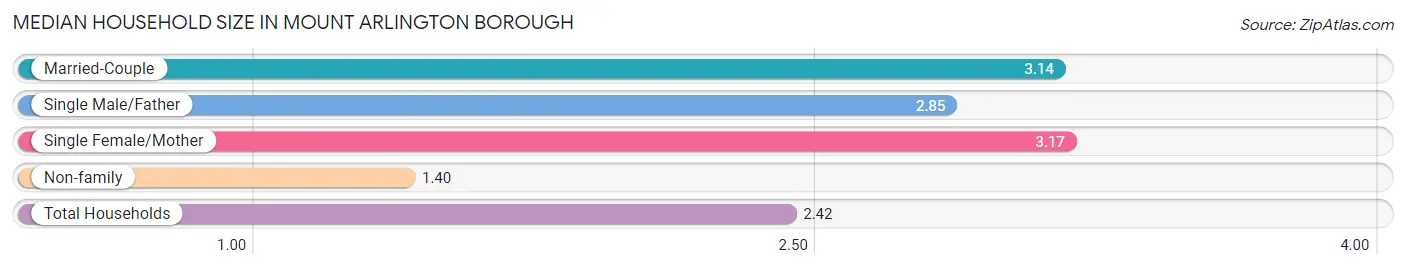
Median Household Size in Mount Arlington borough
The median household size in Mount Arlington borough is 2.42 persons per household, with single female/mother households (364 | 15.0%) accounting for the largest median household size of 3.17 persons per household. non-family households (1,008 | 41.6%) represent the smallest median household size with 1.40 persons per household.
| Household Type | # Households | Household Size |
| Married-Couple | 1,030 (42.5%) | 3.14 |
| Single Male/Father | 20 (0.8%) | 2.85 |
| Single Female/Mother | 364 (15.0%) | 3.17 |
| Non-family | 1,008 (41.6%) | 1.40 |
| Total Households | 2,422 (100.0%) | 2.42 |
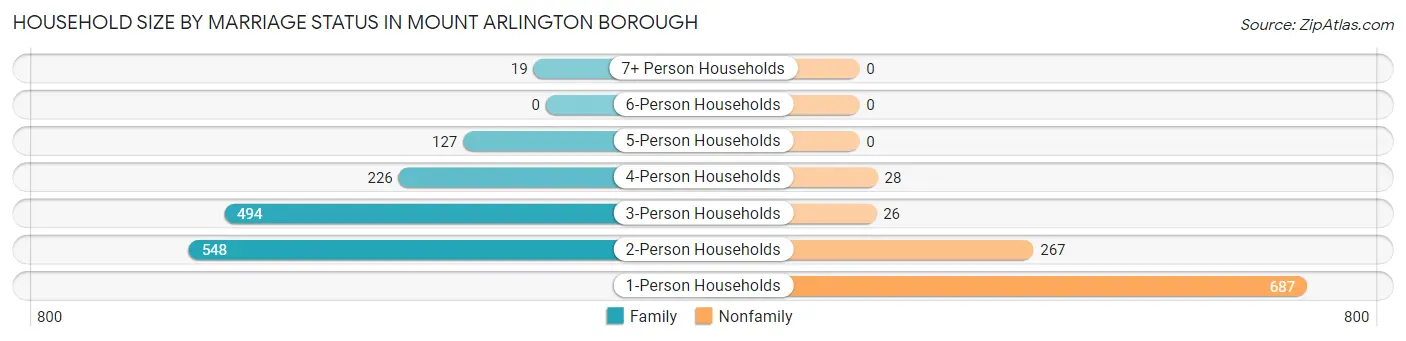
Household Size by Marriage Status in Mount Arlington borough
Out of a total of 2,422 households in Mount Arlington borough, 1,414 (58.4%) are family households, while 1,008 (41.6%) are nonfamily households. The most numerous type of family households are 2-person households, comprising 548, and the most common type of nonfamily households are 1-person households, comprising 687.
| Household Size | Family Households | Nonfamily Households |
| 1-Person Households | - | 687 (28.4%) |
| 2-Person Households | 548 (22.6%) | 267 (11.0%) |
| 3-Person Households | 494 (20.4%) | 26 (1.1%) |
| 4-Person Households | 226 (9.3%) | 28 (1.2%) |
| 5-Person Households | 127 (5.2%) | 0 (0.0%) |
| 6-Person Households | 0 (0.0%) | 0 (0.0%) |
| 7+ Person Households | 19 (0.8%) | 0 (0.0%) |
| Total | 1,414 (58.4%) | 1,008 (41.6%) |
Female Fertility in Mount Arlington borough
Fertility by Age in Mount Arlington borough
Average fertility rate in Mount Arlington borough is 76.0 births per 1,000 women. Women in the age bracket of 20 to 34 years have the highest fertility rate with 133.0 births per 1,000 women. Women in the age bracket of 20 to 34 years acount for 82.4% of all women with births.
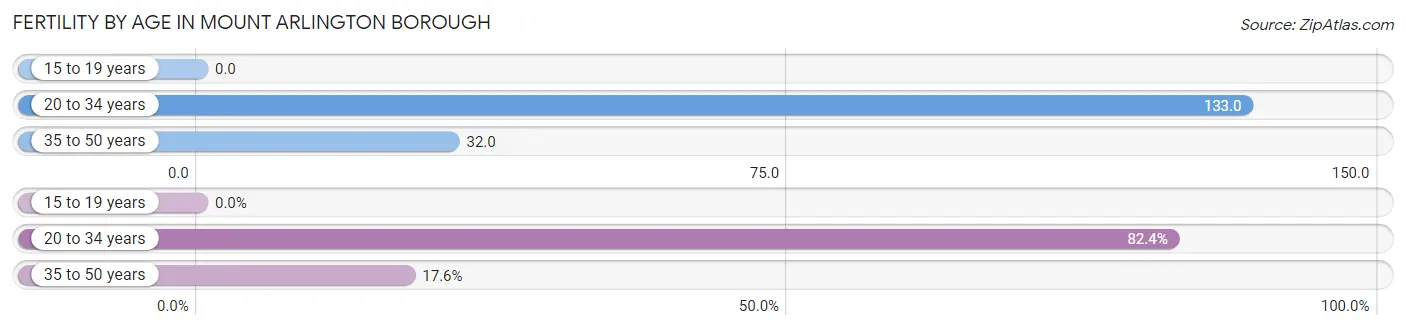
| Age Bracket | Women with Births | Births / 1,000 Women |
| 15 to 19 years | 0 (0.0%) | 0.0 |
| 20 to 34 years | 89 (82.4%) | 133.0 |
| 35 to 50 years | 19 (17.6%) | 32.0 |
| Total | 108 (100.0%) | 76.0 |
Fertility by Age by Marriage Status in Mount Arlington borough
57.4% of women with births (108) in Mount Arlington borough are married. The highest percentage of unmarried women with births falls into 20 to 34 years age bracket with 51.7% of them unmarried at the time of birth, while the lowest percentage of unmarried women with births belong to 35 to 50 years age bracket with 0.0% of them unmarried.
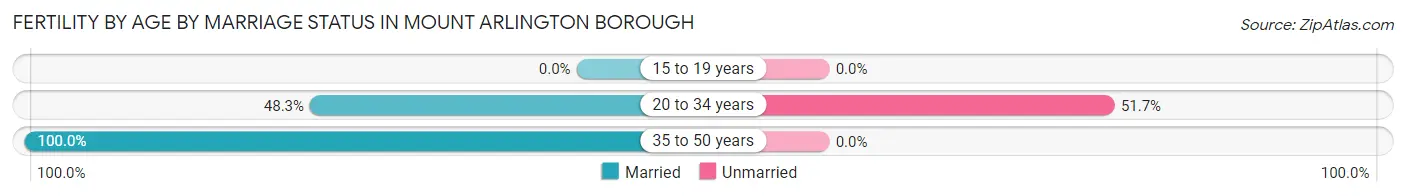
| Age Bracket | Married | Unmarried |
| 15 to 19 years | 0 (0.0%) | 0 (0.0%) |
| 20 to 34 years | 43 (48.3%) | 46 (51.7%) |
| 35 to 50 years | 19 (100.0%) | 0 (0.0%) |
| Total | 62 (57.4%) | 46 (42.6%) |
Fertility by Education in Mount Arlington borough
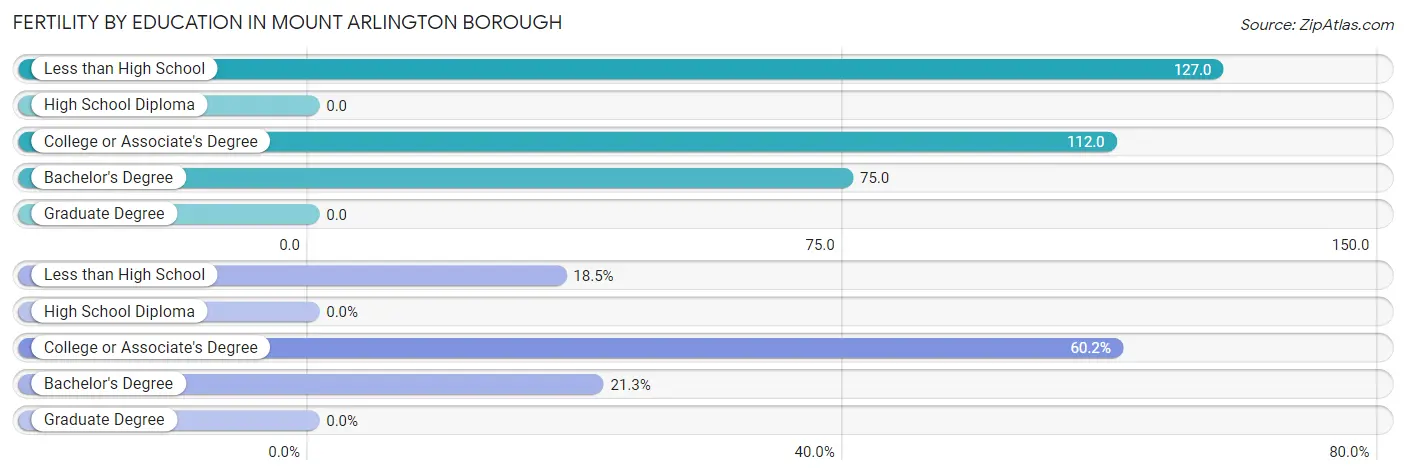
| Educational Attainment | Women with Births | Births / 1,000 Women |
| Less than High School | 20 (18.5%) | 127.0 |
| High School Diploma | 0 (0.0%) | 0.0 |
| College or Associate's Degree | 65 (60.2%) | 112.0 |
| Bachelor's Degree | 23 (21.3%) | 75.0 |
| Graduate Degree | 0 (0.0%) | 0.0 |
| Total | 108 (100.0%) | 76.0 |
Fertility by Education by Marriage Status in Mount Arlington borough
42.6% of women with births in Mount Arlington borough are unmarried. Women with the educational attainment of less than high school are most likely to be married with 100.0% of them married at childbirth, while women with the educational attainment of college or associate's degree are least likely to be married with 70.8% of them unmarried at childbirth.
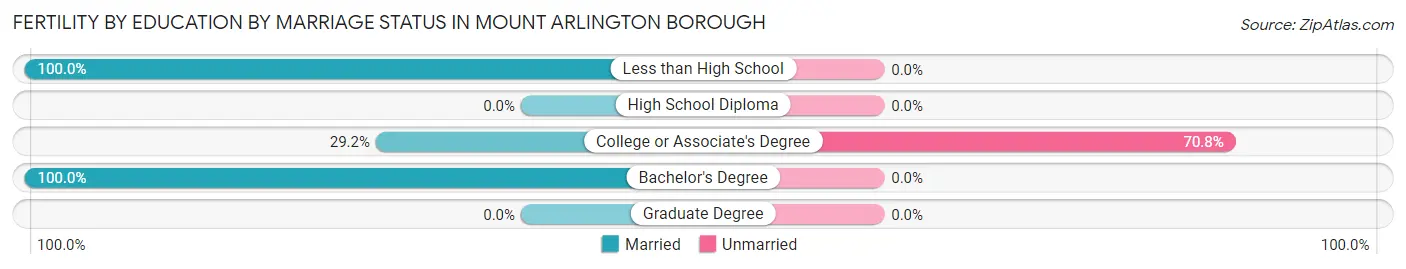
| Educational Attainment | Married | Unmarried |
| Less than High School | 20 (100.0%) | 0 (0.0%) |
| High School Diploma | 0 (0.0%) | 0 (0.0%) |
| College or Associate's Degree | 19 (29.2%) | 46 (70.8%) |
| Bachelor's Degree | 23 (100.0%) | 0 (0.0%) |
| Graduate Degree | 0 (0.0%) | 0 (0.0%) |
| Total | 62 (57.4%) | 46 (42.6%) |
Employment Characteristics in Mount Arlington borough
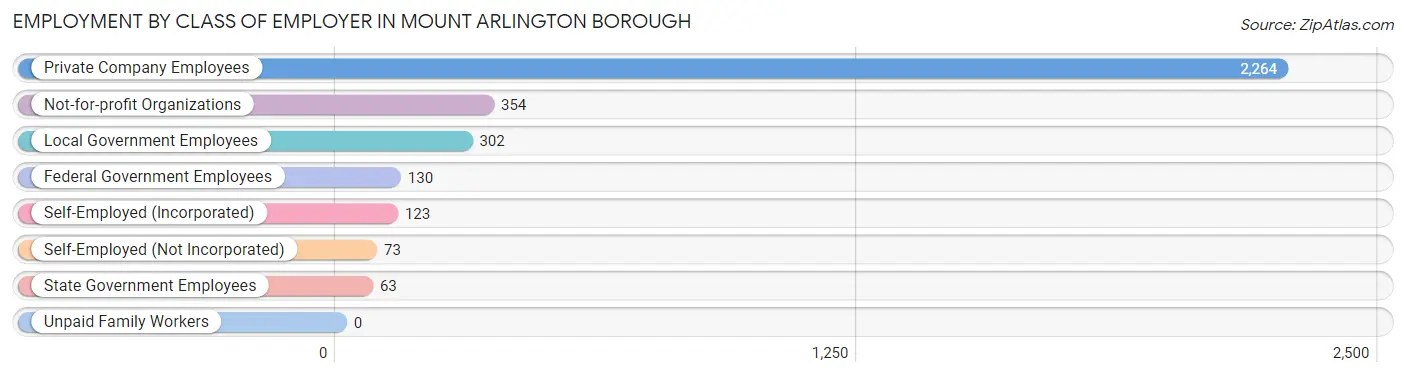
Employment by Class of Employer in Mount Arlington borough
Among the 3,309 employed individuals in Mount Arlington borough, private company employees (2,264 | 68.4%), not-for-profit organizations (354 | 10.7%), and local government employees (302 | 9.1%) make up the most common classes of employment.
| Employer Class | # Employees | % Employees |
| Private Company Employees | 2,264 | 68.4% |
| Self-Employed (Incorporated) | 123 | 3.7% |
| Self-Employed (Not Incorporated) | 73 | 2.2% |
| Not-for-profit Organizations | 354 | 10.7% |
| Local Government Employees | 302 | 9.1% |
| State Government Employees | 63 | 1.9% |
| Federal Government Employees | 130 | 3.9% |
| Unpaid Family Workers | 0 | 0.0% |
| Total | 3,309 | 100.0% |
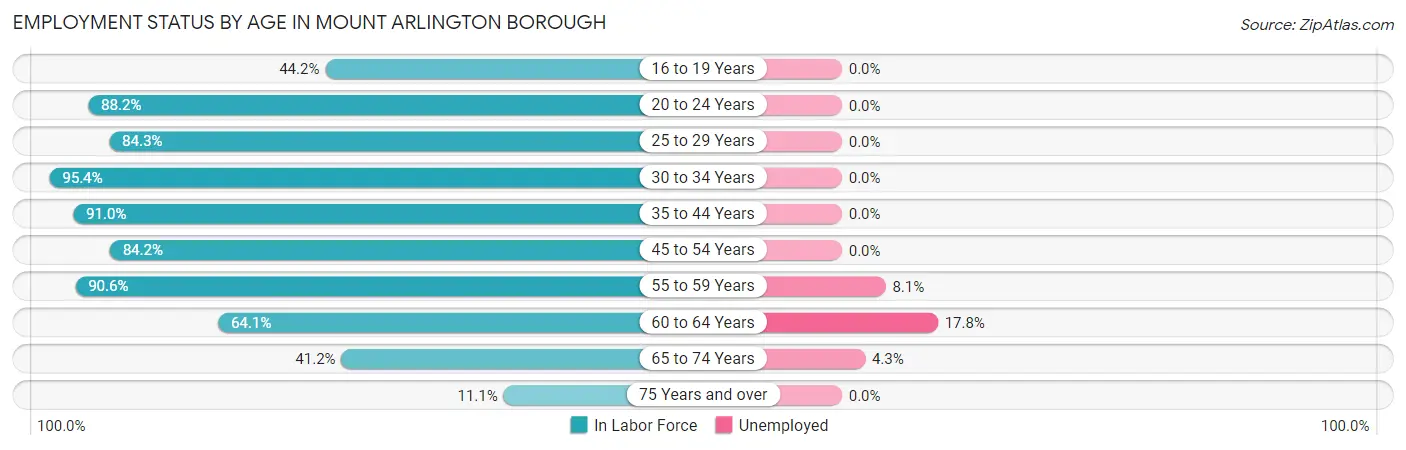
Employment Status by Age in Mount Arlington borough
According to the labor force statistics for Mount Arlington borough, out of the total population over 16 years of age (4,909), 70.0% or 3,436 individuals are in the labor force, with 2.5% or 86 of them unemployed. The age group with the highest labor force participation rate is 30 to 34 years, with 95.4% or 308 individuals in the labor force. Within the labor force, the 60 to 64 years age range has the highest percentage of unemployed individuals, with 17.8% or 38 of them being unemployed.
| Age Bracket | In Labor Force | Unemployed |
| 16 to 19 Years | 107 (44.2%) | 0 (0.0%) |
| 20 to 24 Years | 330 (88.2%) | 0 (0.0%) |
| 25 to 29 Years | 398 (84.3%) | 0 (0.0%) |
| 30 to 34 Years | 308 (95.4%) | 0 (0.0%) |
| 35 to 44 Years | 544 (91.0%) | 0 (0.0%) |
| 45 to 54 Years | 738 (84.2%) | 0 (0.0%) |
| 55 to 59 Years | 442 (90.6%) | 36 (8.1%) |
| 60 to 64 Years | 214 (64.1%) | 38 (17.8%) |
| 65 to 74 Years | 305 (41.2%) | 13 (4.3%) |
| 75 Years and over | 51 (11.1%) | 0 (0.0%) |
| Total | 3,436 (70.0%) | 86 (2.5%) |
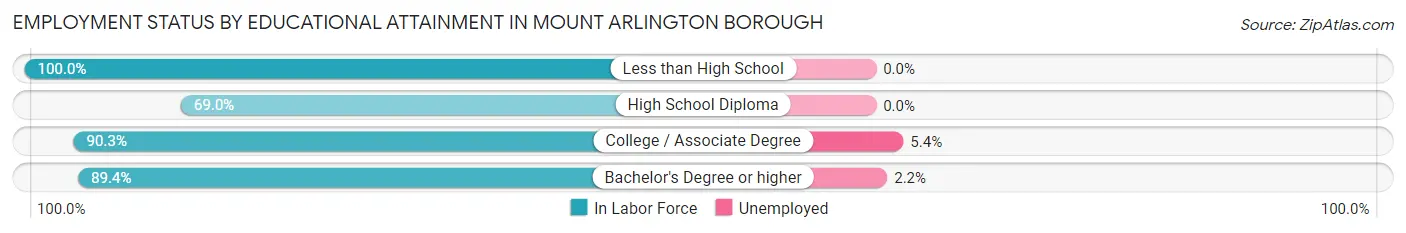
Employment Status by Educational Attainment in Mount Arlington borough
According to labor force statistics for Mount Arlington borough, 85.5% of individuals (2,644) out of the total population between 25 and 64 years of age (3,092) are in the labor force, with 2.8% or 74 of them being unemployed. The group with the highest labor force participation rate are those with the educational attainment of less than high school, with 100.0% or 41 individuals in the labor force. Within the labor force, individuals with college / associate degree education have the highest percentage of unemployment, with 5.4% or 46 of them being unemployed.
| Educational Attainment | In Labor Force | Unemployed |
| Less than High School | 41 (100.0%) | 0 (0.0%) |
| High School Diploma | 455 (69.0%) | 0 (0.0%) |
| College / Associate Degree | 852 (90.3%) | 51 (5.4%) |
| Bachelor's Degree or higher | 1,295 (89.4%) | 32 (2.2%) |
| Total | 2,644 (85.5%) | 87 (2.8%) |
Employment Occupations by Sex in Mount Arlington borough
Management, Business, Science and Arts Occupations
The most common Management, Business, Science and Arts occupations in Mount Arlington borough are Community & Social Service (451 | 13.5%), Management (387 | 11.6%), Health Diagnosing & Treating (320 | 9.6%), Education Instruction & Library (288 | 8.6%), and Health Technologists (246 | 7.3%).
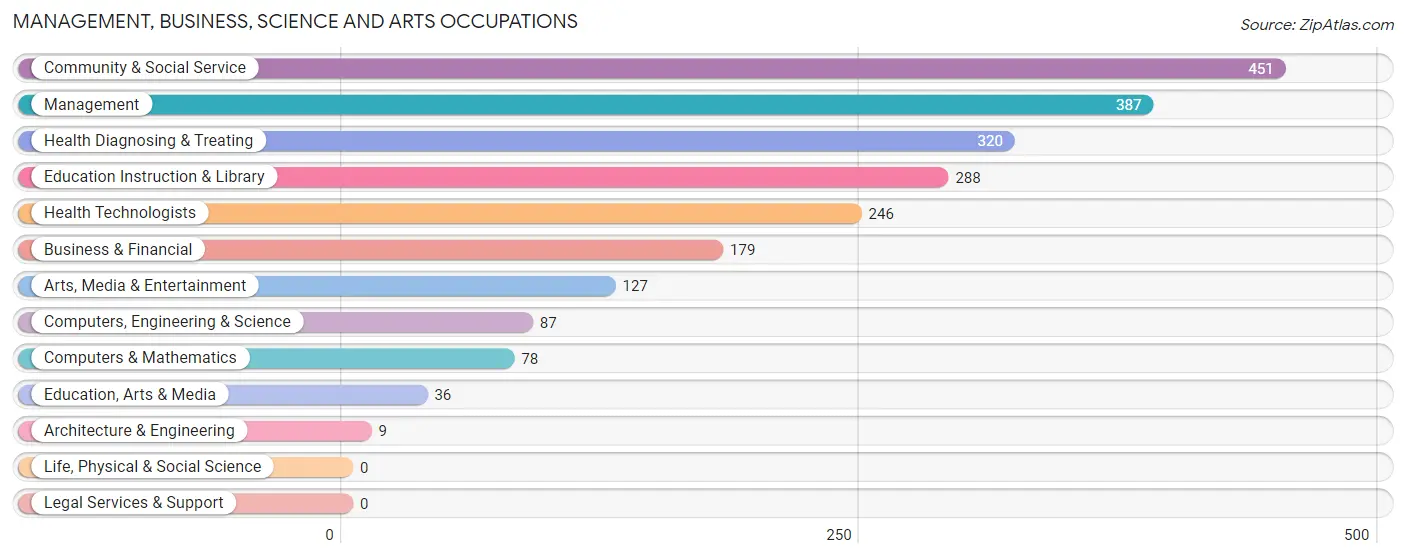
Management, Business, Science and Arts Occupations by Sex
Within the Management, Business, Science and Arts occupations in Mount Arlington borough, the most male-oriented occupations are Architecture & Engineering (100.0%), Arts, Media & Entertainment (80.3%), and Computers, Engineering & Science (69.0%), while the most female-oriented occupations are Health Technologists (81.7%), Education Instruction & Library (81.2%), and Health Diagnosing & Treating (76.9%).
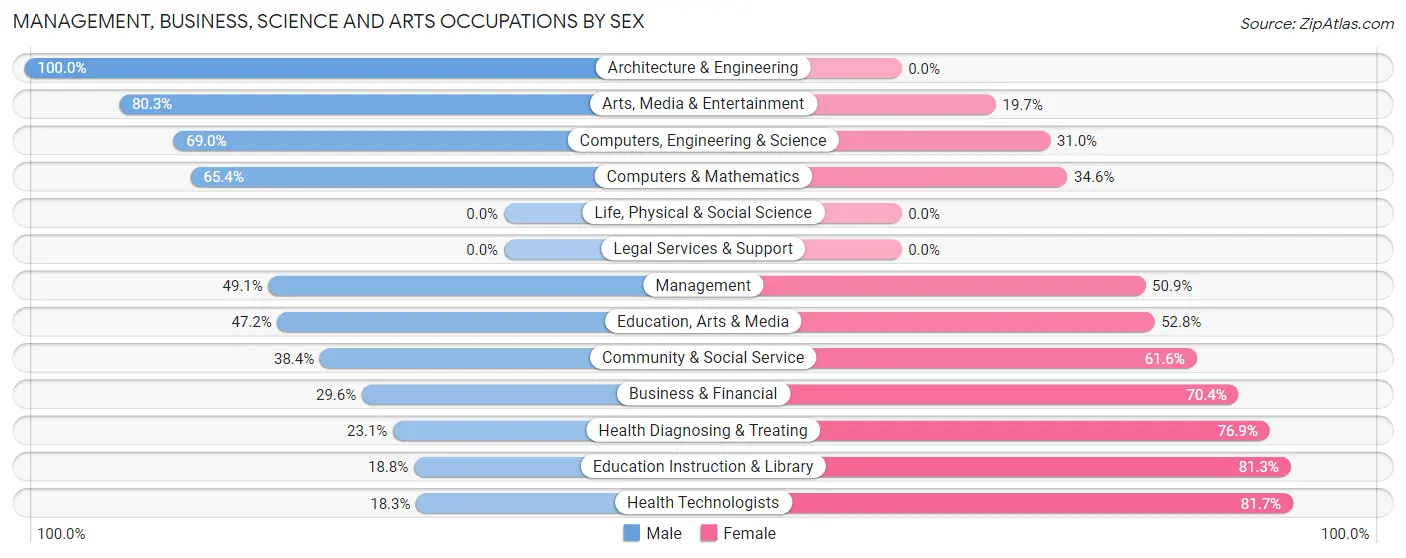
| Occupation | Male | Female |
| Management | 190 (49.1%) | 197 (50.9%) |
| Business & Financial | 53 (29.6%) | 126 (70.4%) |
| Computers, Engineering & Science | 60 (69.0%) | 27 (31.0%) |
| Computers & Mathematics | 51 (65.4%) | 27 (34.6%) |
| Architecture & Engineering | 9 (100.0%) | 0 (0.0%) |
| Life, Physical & Social Science | 0 (0.0%) | 0 (0.0%) |
| Community & Social Service | 173 (38.4%) | 278 (61.6%) |
| Education, Arts & Media | 17 (47.2%) | 19 (52.8%) |
| Legal Services & Support | 0 (0.0%) | 0 (0.0%) |
| Education Instruction & Library | 54 (18.8%) | 234 (81.2%) |
| Arts, Media & Entertainment | 102 (80.3%) | 25 (19.7%) |
| Health Diagnosing & Treating | 74 (23.1%) | 246 (76.9%) |
| Health Technologists | 45 (18.3%) | 201 (81.7%) |
| Total (Category) | 550 (38.6%) | 874 (61.4%) |
| Total (Overall) | 1,486 (44.4%) | 1,864 (55.6%) |
Services Occupations
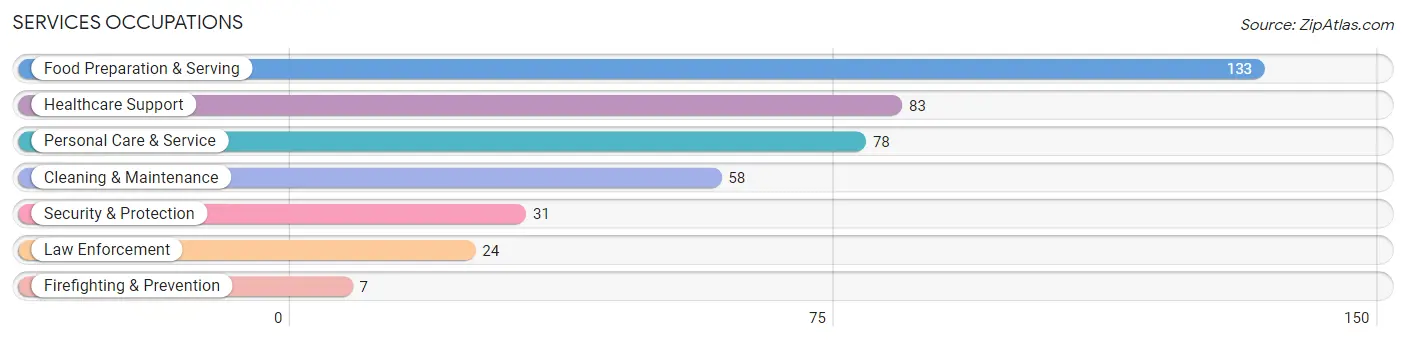
The most common Services occupations in Mount Arlington borough are Food Preparation & Serving (133 | 4.0%), Healthcare Support (83 | 2.5%), Personal Care & Service (78 | 2.3%), Cleaning & Maintenance (58 | 1.7%), and Security & Protection (31 | 0.9%).
Services Occupations by Sex
Within the Services occupations in Mount Arlington borough, the most male-oriented occupations are Security & Protection (100.0%), Firefighting & Prevention (100.0%), and Law Enforcement (100.0%), while the most female-oriented occupations are Personal Care & Service (100.0%), Food Preparation & Serving (99.3%), and Healthcare Support (72.3%).
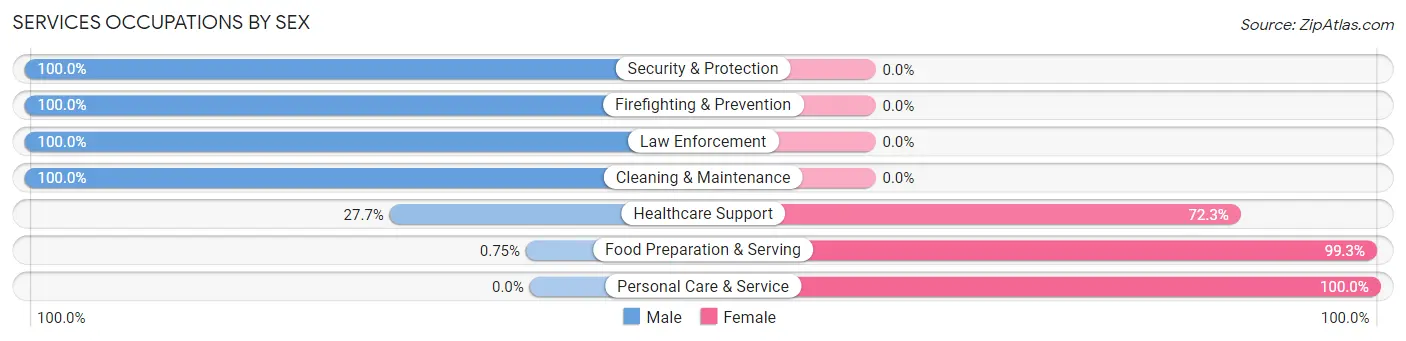
| Occupation | Male | Female |
| Healthcare Support | 23 (27.7%) | 60 (72.3%) |
| Security & Protection | 31 (100.0%) | 0 (0.0%) |
| Firefighting & Prevention | 7 (100.0%) | 0 (0.0%) |
| Law Enforcement | 24 (100.0%) | 0 (0.0%) |
| Food Preparation & Serving | 1 (0.7%) | 132 (99.3%) |
| Cleaning & Maintenance | 58 (100.0%) | 0 (0.0%) |
| Personal Care & Service | 0 (0.0%) | 78 (100.0%) |
| Total (Category) | 113 (29.5%) | 270 (70.5%) |
| Total (Overall) | 1,486 (44.4%) | 1,864 (55.6%) |
Sales and Office Occupations
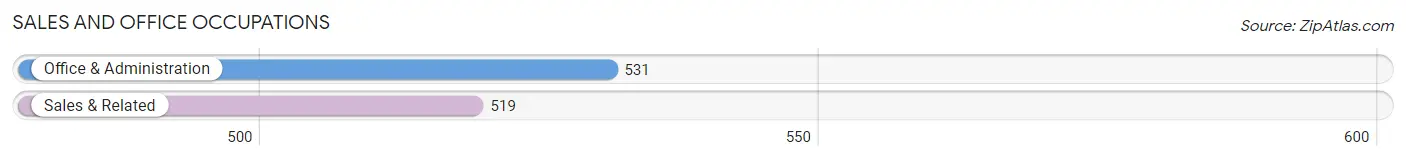
The most common Sales and Office occupations in Mount Arlington borough are Office & Administration (531 | 15.9%), and Sales & Related (519 | 15.5%).
Sales and Office Occupations by Sex
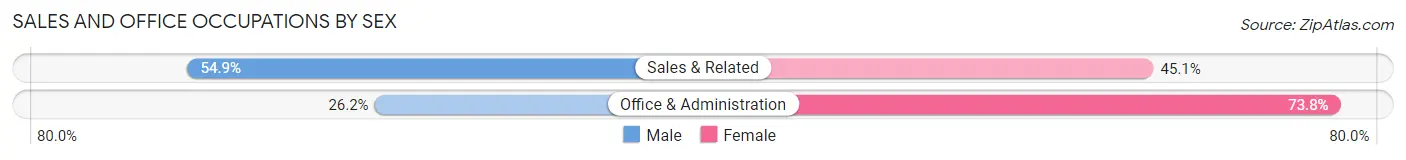
| Occupation | Male | Female |
| Sales & Related | 285 (54.9%) | 234 (45.1%) |
| Office & Administration | 139 (26.2%) | 392 (73.8%) |
| Total (Category) | 424 (40.4%) | 626 (59.6%) |
| Total (Overall) | 1,486 (44.4%) | 1,864 (55.6%) |
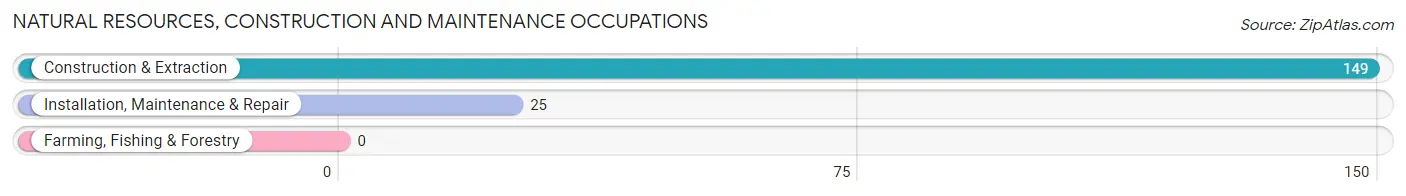
Natural Resources, Construction and Maintenance Occupations
The most common Natural Resources, Construction and Maintenance occupations in Mount Arlington borough are Construction & Extraction (149 | 4.4%), and Installation, Maintenance & Repair (25 | 0.7%).
Natural Resources, Construction and Maintenance Occupations by Sex
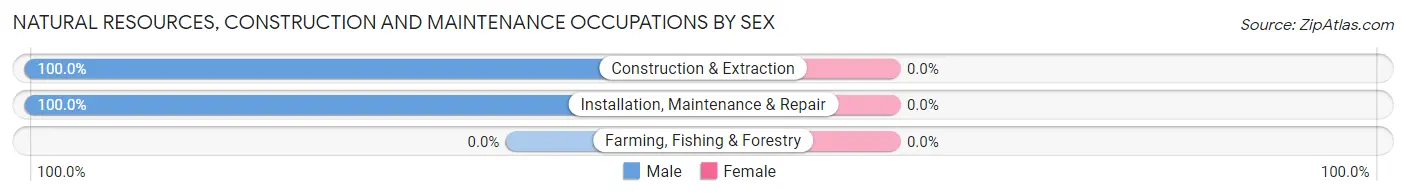
| Occupation | Male | Female |
| Farming, Fishing & Forestry | 0 (0.0%) | 0 (0.0%) |
| Construction & Extraction | 149 (100.0%) | 0 (0.0%) |
| Installation, Maintenance & Repair | 25 (100.0%) | 0 (0.0%) |
| Total (Category) | 174 (100.0%) | 0 (0.0%) |
| Total (Overall) | 1,486 (44.4%) | 1,864 (55.6%) |
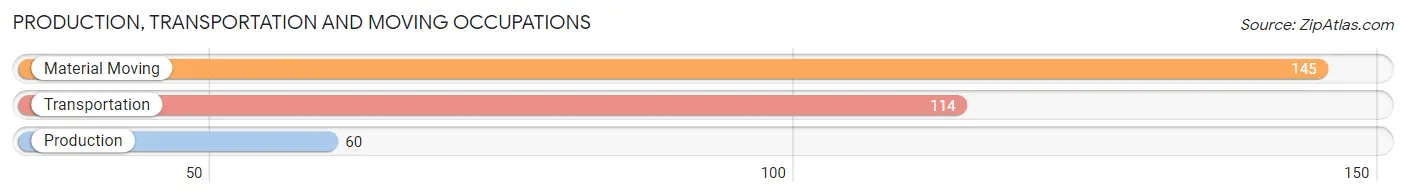
Production, Transportation and Moving Occupations
The most common Production, Transportation and Moving occupations in Mount Arlington borough are Material Moving (145 | 4.3%), Transportation (114 | 3.4%), and Production (60 | 1.8%).
Production, Transportation and Moving Occupations by Sex
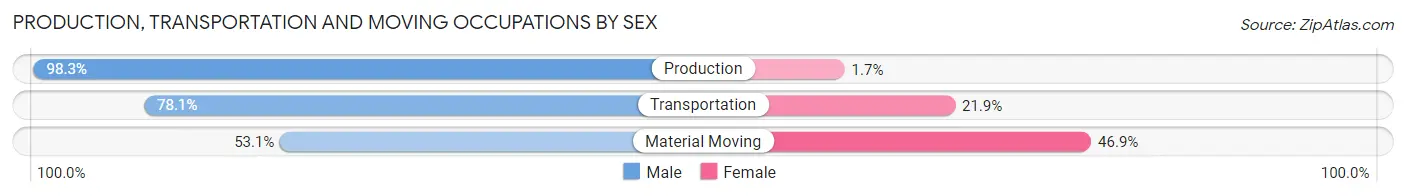
| Occupation | Male | Female |
| Production | 59 (98.3%) | 1 (1.7%) |
| Transportation | 89 (78.1%) | 25 (21.9%) |
| Material Moving | 77 (53.1%) | 68 (46.9%) |
| Total (Category) | 225 (70.5%) | 94 (29.5%) |
| Total (Overall) | 1,486 (44.4%) | 1,864 (55.6%) |
Employment Industries by Sex in Mount Arlington borough
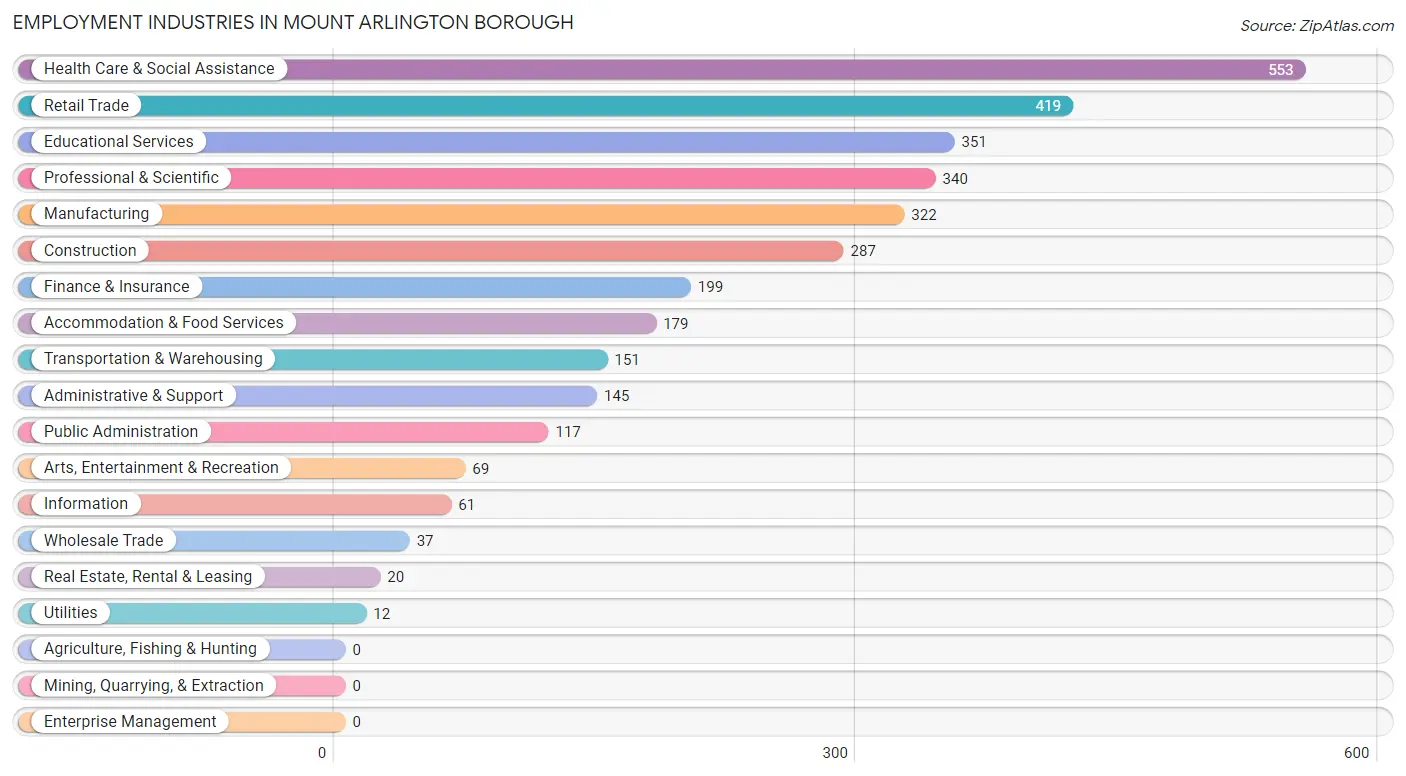
Employment Industries in Mount Arlington borough
The major employment industries in Mount Arlington borough include Health Care & Social Assistance (553 | 16.5%), Retail Trade (419 | 12.5%), Educational Services (351 | 10.5%), Professional & Scientific (340 | 10.2%), and Manufacturing (322 | 9.6%).
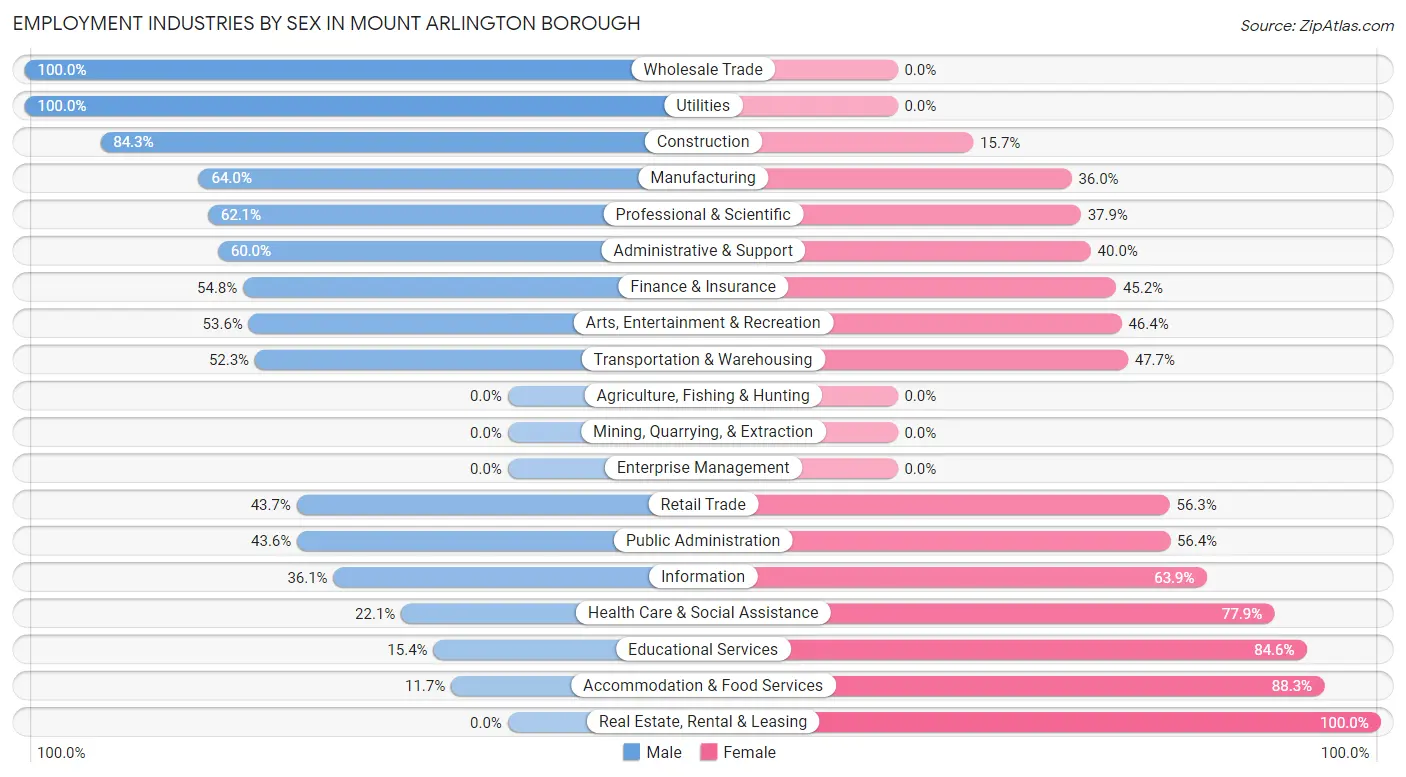
Employment Industries by Sex in Mount Arlington borough
The Mount Arlington borough industries that see more men than women are Wholesale Trade (100.0%), Utilities (100.0%), and Construction (84.3%), whereas the industries that tend to have a higher number of women are Real Estate, Rental & Leasing (100.0%), Accommodation & Food Services (88.3%), and Educational Services (84.6%).
| Industry | Male | Female |
| Agriculture, Fishing & Hunting | 0 (0.0%) | 0 (0.0%) |
| Mining, Quarrying, & Extraction | 0 (0.0%) | 0 (0.0%) |
| Construction | 242 (84.3%) | 45 (15.7%) |
| Manufacturing | 206 (64.0%) | 116 (36.0%) |
| Wholesale Trade | 37 (100.0%) | 0 (0.0%) |
| Retail Trade | 183 (43.7%) | 236 (56.3%) |
| Transportation & Warehousing | 79 (52.3%) | 72 (47.7%) |
| Utilities | 12 (100.0%) | 0 (0.0%) |
| Information | 22 (36.1%) | 39 (63.9%) |
| Finance & Insurance | 109 (54.8%) | 90 (45.2%) |
| Real Estate, Rental & Leasing | 0 (0.0%) | 20 (100.0%) |
| Professional & Scientific | 211 (62.1%) | 129 (37.9%) |
| Enterprise Management | 0 (0.0%) | 0 (0.0%) |
| Administrative & Support | 87 (60.0%) | 58 (40.0%) |
| Educational Services | 54 (15.4%) | 297 (84.6%) |
| Health Care & Social Assistance | 122 (22.1%) | 431 (77.9%) |
| Arts, Entertainment & Recreation | 37 (53.6%) | 32 (46.4%) |
| Accommodation & Food Services | 21 (11.7%) | 158 (88.3%) |
| Public Administration | 51 (43.6%) | 66 (56.4%) |
| Total | 1,486 (44.4%) | 1,864 (55.6%) |
Education in Mount Arlington borough
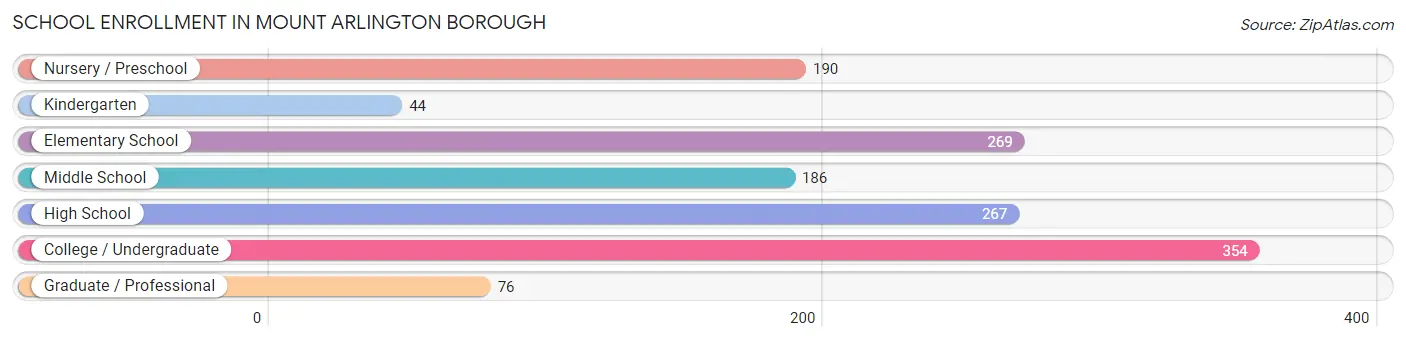
School Enrollment in Mount Arlington borough
The most common levels of schooling among the 1,386 students in Mount Arlington borough are college / undergraduate (354 | 25.5%), elementary school (269 | 19.4%), and high school (267 | 19.3%).
| School Level | # Students | % Students |
| Nursery / Preschool | 190 | 13.7% |
| Kindergarten | 44 | 3.2% |
| Elementary School | 269 | 19.4% |
| Middle School | 186 | 13.4% |
| High School | 267 | 19.3% |
| College / Undergraduate | 354 | 25.5% |
| Graduate / Professional | 76 | 5.5% |
| Total | 1,386 | 100.0% |
School Enrollment by Age by Funding Source in Mount Arlington borough
Out of a total of 1,386 students who are enrolled in schools in Mount Arlington borough, 251 (18.1%) attend a private institution, while the remaining 1,135 (81.9%) are enrolled in public schools. The age group of 3 to 4 year olds has the highest likelihood of being enrolled in private schools, with 107 (72.3% in the age bracket) enrolled. Conversely, the age group of 10 to 14 year olds has the lowest likelihood of being enrolled in a private school, with 218 (100.0% in the age bracket) attending a public institution.
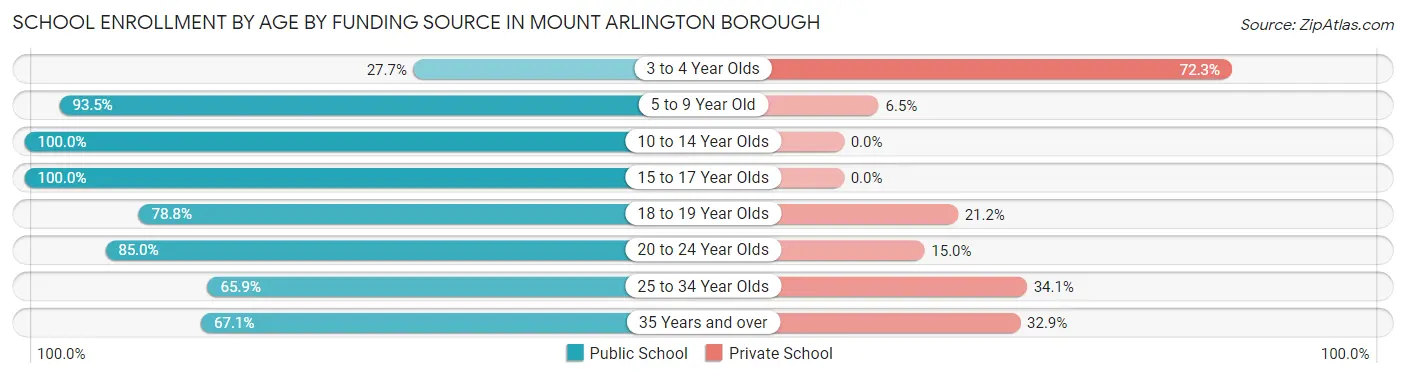
| Age Bracket | Public School | Private School |
| 3 to 4 Year Olds | 41 (27.7%) | 107 (72.3%) |
| 5 to 9 Year Old | 302 (93.5%) | 21 (6.5%) |
| 10 to 14 Year Olds | 218 (100.0%) | 0 (0.0%) |
| 15 to 17 Year Olds | 203 (100.0%) | 0 (0.0%) |
| 18 to 19 Year Olds | 89 (78.8%) | 24 (21.2%) |
| 20 to 24 Year Olds | 130 (85.0%) | 23 (15.0%) |
| 25 to 34 Year Olds | 58 (65.9%) | 30 (34.1%) |
| 35 Years and over | 94 (67.1%) | 46 (32.9%) |
| Total | 1,135 (81.9%) | 251 (18.1%) |
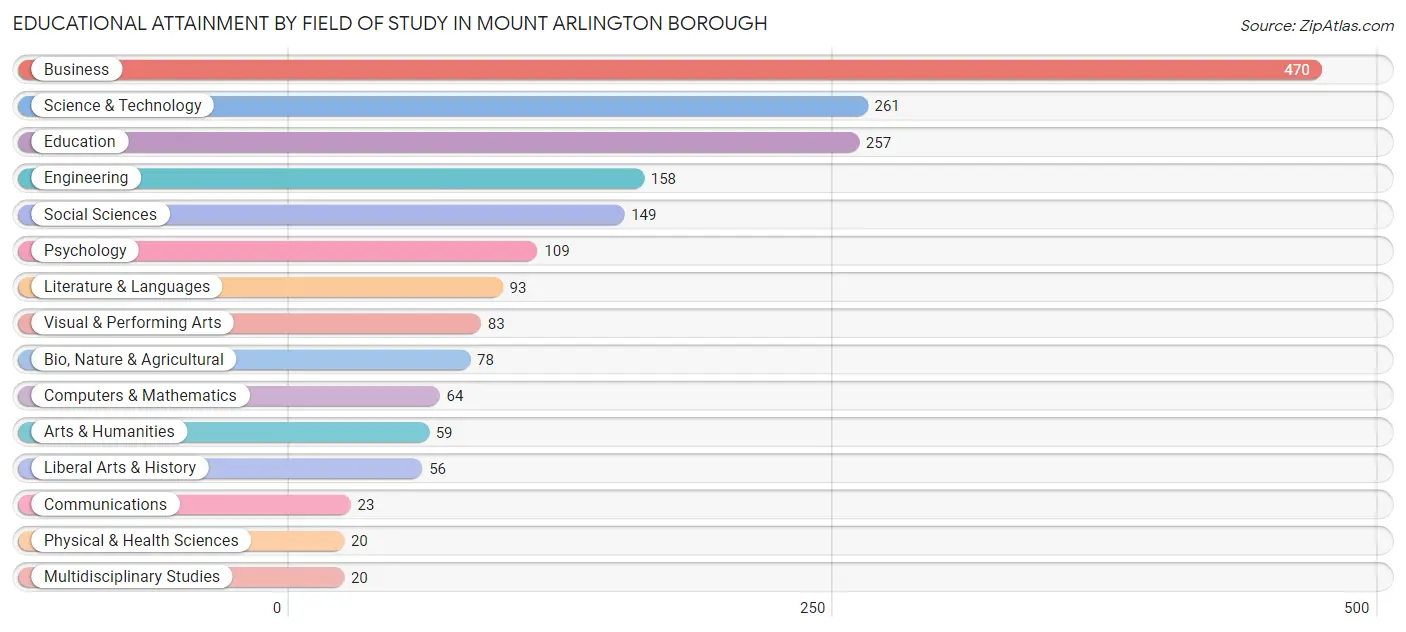
Educational Attainment by Field of Study in Mount Arlington borough
Business (470 | 24.7%), science & technology (261 | 13.7%), education (257 | 13.5%), engineering (158 | 8.3%), and social sciences (149 | 7.8%) are the most common fields of study among 1,900 individuals in Mount Arlington borough who have obtained a bachelor's degree or higher.
| Field of Study | # Graduates | % Graduates |
| Computers & Mathematics | 64 | 3.4% |
| Bio, Nature & Agricultural | 78 | 4.1% |
| Physical & Health Sciences | 20 | 1.1% |
| Psychology | 109 | 5.7% |
| Social Sciences | 149 | 7.8% |
| Engineering | 158 | 8.3% |
| Multidisciplinary Studies | 20 | 1.1% |
| Science & Technology | 261 | 13.7% |
| Business | 470 | 24.7% |
| Education | 257 | 13.5% |
| Literature & Languages | 93 | 4.9% |
| Liberal Arts & History | 56 | 2.9% |
| Visual & Performing Arts | 83 | 4.4% |
| Communications | 23 | 1.2% |
| Arts & Humanities | 59 | 3.1% |
| Total | 1,900 | 100.0% |
Transportation & Commute in Mount Arlington borough
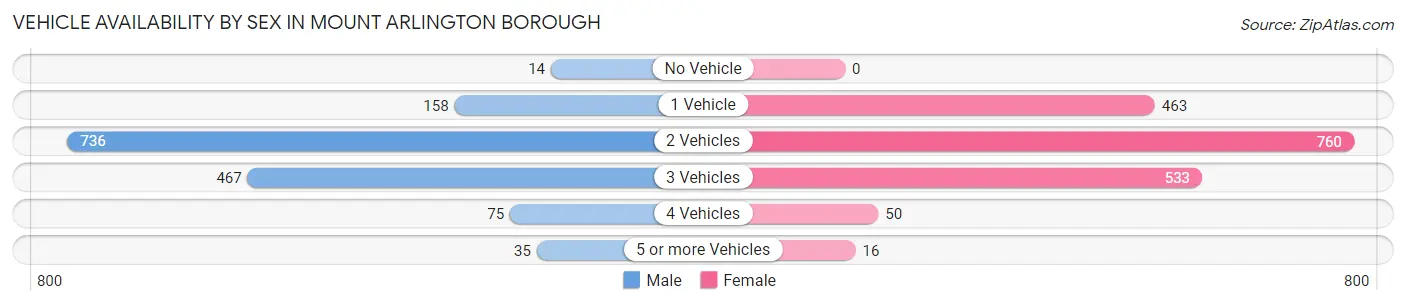
Vehicle Availability by Sex in Mount Arlington borough
The most prevalent vehicle ownership categories in Mount Arlington borough are males with 2 vehicles (736, accounting for 49.6%) and females with 2 vehicles (760, making up 40.4%).
| Vehicles Available | Male | Female |
| No Vehicle | 14 (0.9%) | 0 (0.0%) |
| 1 Vehicle | 158 (10.6%) | 463 (25.4%) |
| 2 Vehicles | 736 (49.6%) | 760 (41.7%) |
| 3 Vehicles | 467 (31.5%) | 533 (29.2%) |
| 4 Vehicles | 75 (5.1%) | 50 (2.7%) |
| 5 or more Vehicles | 35 (2.4%) | 16 (0.9%) |
| Total | 1,485 (100.0%) | 1,822 (100.0%) |
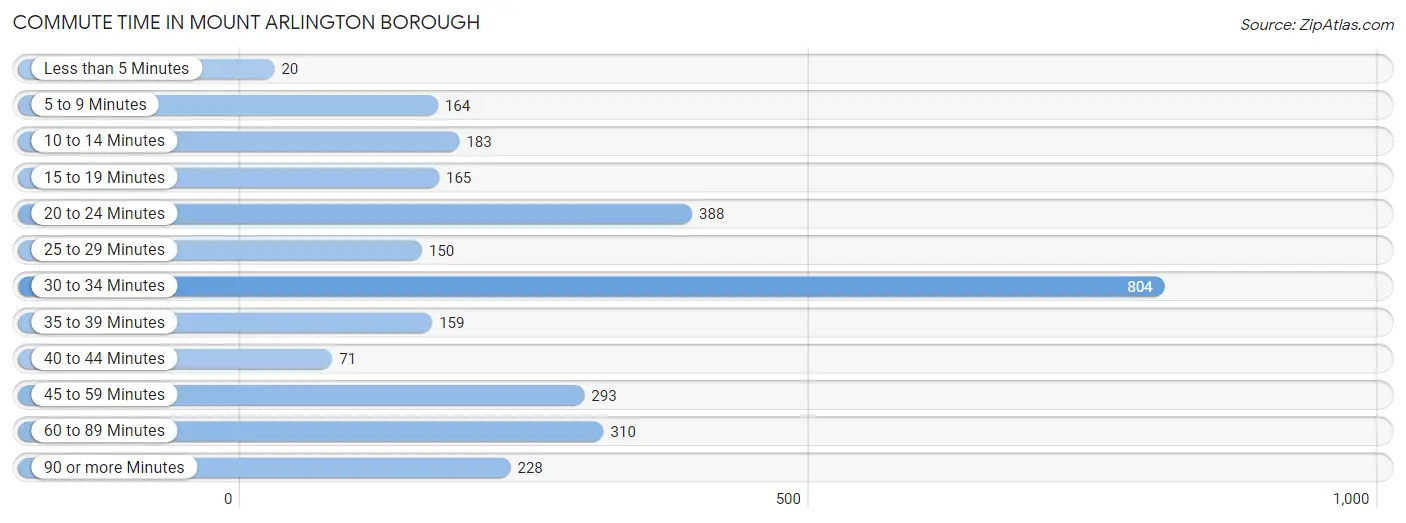
Commute Time in Mount Arlington borough
The most frequently occuring commute durations in Mount Arlington borough are 30 to 34 minutes (804 commuters, 27.4%), 20 to 24 minutes (388 commuters, 13.2%), and 60 to 89 minutes (310 commuters, 10.6%).
| Commute Time | # Commuters | % Commuters |
| Less than 5 Minutes | 20 | 0.7% |
| 5 to 9 Minutes | 164 | 5.6% |
| 10 to 14 Minutes | 183 | 6.2% |
| 15 to 19 Minutes | 165 | 5.6% |
| 20 to 24 Minutes | 388 | 13.2% |
| 25 to 29 Minutes | 150 | 5.1% |
| 30 to 34 Minutes | 804 | 27.4% |
| 35 to 39 Minutes | 159 | 5.4% |
| 40 to 44 Minutes | 71 | 2.4% |
| 45 to 59 Minutes | 293 | 10.0% |
| 60 to 89 Minutes | 310 | 10.6% |
| 90 or more Minutes | 228 | 7.8% |
Commute Time by Sex in Mount Arlington borough
The most common commute times in Mount Arlington borough are 30 to 34 minutes (516 commuters, 37.3%) for males and 30 to 34 minutes (288 commuters, 18.6%) for females.
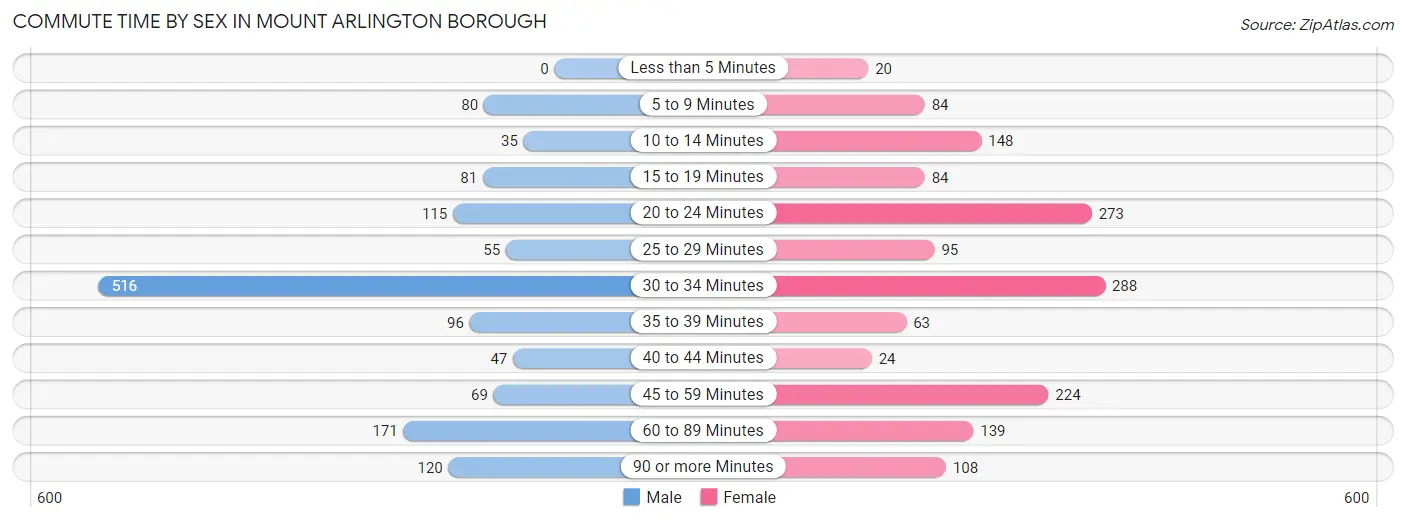
| Commute Time | Male | Female |
| Less than 5 Minutes | 0 (0.0%) | 20 (1.3%) |
| 5 to 9 Minutes | 80 (5.8%) | 84 (5.4%) |
| 10 to 14 Minutes | 35 (2.5%) | 148 (9.6%) |
| 15 to 19 Minutes | 81 (5.9%) | 84 (5.4%) |
| 20 to 24 Minutes | 115 (8.3%) | 273 (17.6%) |
| 25 to 29 Minutes | 55 (4.0%) | 95 (6.1%) |
| 30 to 34 Minutes | 516 (37.3%) | 288 (18.6%) |
| 35 to 39 Minutes | 96 (6.9%) | 63 (4.1%) |
| 40 to 44 Minutes | 47 (3.4%) | 24 (1.5%) |
| 45 to 59 Minutes | 69 (5.0%) | 224 (14.4%) |
| 60 to 89 Minutes | 171 (12.3%) | 139 (9.0%) |
| 90 or more Minutes | 120 (8.7%) | 108 (7.0%) |
Time of Departure to Work by Sex in Mount Arlington borough
The most frequent times of departure to work in Mount Arlington borough are 7:00 AM to 7:29 AM (214, 15.4%) for males and 10:00 AM to 10:59 AM (218, 14.1%) for females.
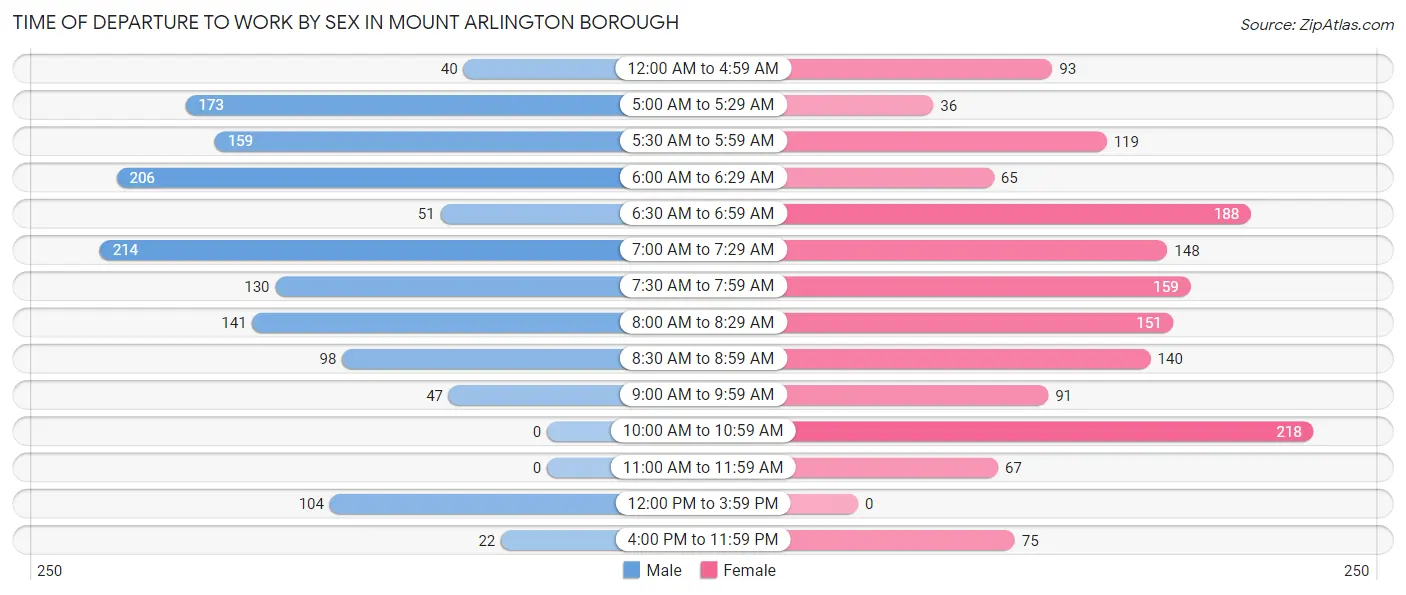
| Time of Departure | Male | Female |
| 12:00 AM to 4:59 AM | 40 (2.9%) | 93 (6.0%) |
| 5:00 AM to 5:29 AM | 173 (12.5%) | 36 (2.3%) |
| 5:30 AM to 5:59 AM | 159 (11.5%) | 119 (7.7%) |
| 6:00 AM to 6:29 AM | 206 (14.9%) | 65 (4.2%) |
| 6:30 AM to 6:59 AM | 51 (3.7%) | 188 (12.1%) |
| 7:00 AM to 7:29 AM | 214 (15.4%) | 148 (9.6%) |
| 7:30 AM to 7:59 AM | 130 (9.4%) | 159 (10.3%) |
| 8:00 AM to 8:29 AM | 141 (10.2%) | 151 (9.7%) |
| 8:30 AM to 8:59 AM | 98 (7.1%) | 140 (9.0%) |
| 9:00 AM to 9:59 AM | 47 (3.4%) | 91 (5.9%) |
| 10:00 AM to 10:59 AM | 0 (0.0%) | 218 (14.1%) |
| 11:00 AM to 11:59 AM | 0 (0.0%) | 67 (4.3%) |
| 12:00 PM to 3:59 PM | 104 (7.5%) | 0 (0.0%) |
| 4:00 PM to 11:59 PM | 22 (1.6%) | 75 (4.8%) |
| Total | 1,385 (100.0%) | 1,550 (100.0%) |
Housing Occupancy in Mount Arlington borough
Occupancy by Ownership in Mount Arlington borough
Of the total 2,422 dwellings in Mount Arlington borough, owner-occupied units account for 1,652 (68.2%), while renter-occupied units make up 770 (31.8%).
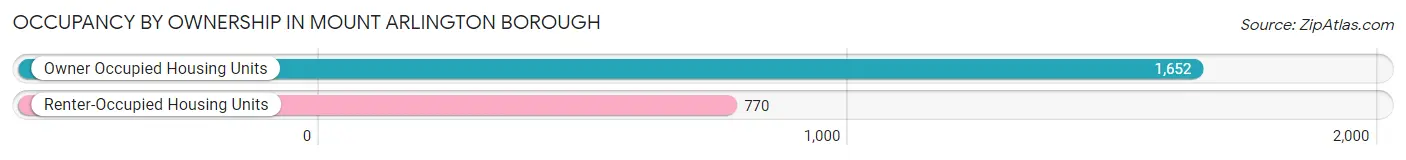
| Occupancy | # Housing Units | % Housing Units |
| Owner Occupied Housing Units | 1,652 | 68.2% |
| Renter-Occupied Housing Units | 770 | 31.8% |
| Total Occupied Housing Units | 2,422 | 100.0% |
Occupancy by Household Size in Mount Arlington borough
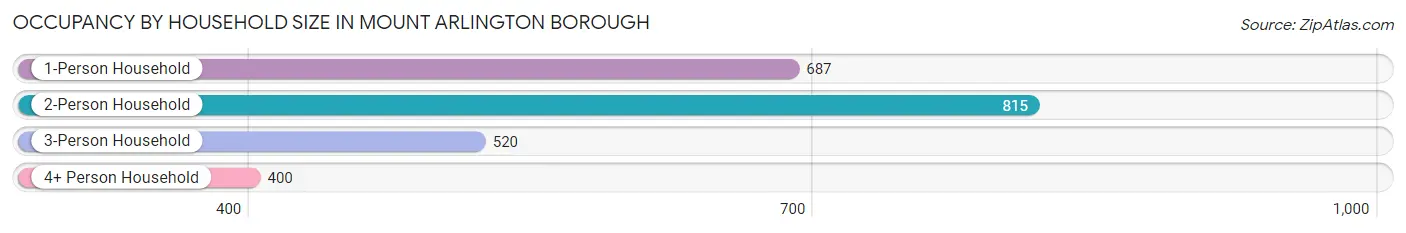
| Household Size | # Housing Units | % Housing Units |
| 1-Person Household | 687 | 28.4% |
| 2-Person Household | 815 | 33.7% |
| 3-Person Household | 520 | 21.5% |
| 4+ Person Household | 400 | 16.5% |
| Total Housing Units | 2,422 | 100.0% |
Occupancy by Ownership by Household Size in Mount Arlington borough
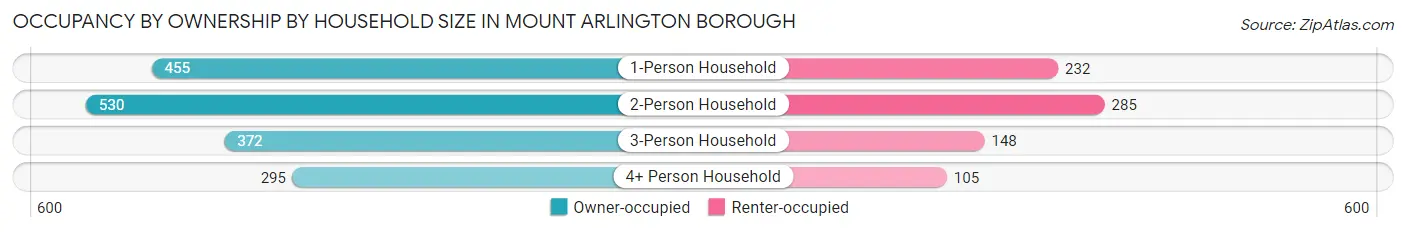
| Household Size | Owner-occupied | Renter-occupied |
| 1-Person Household | 455 (66.2%) | 232 (33.8%) |
| 2-Person Household | 530 (65.0%) | 285 (35.0%) |
| 3-Person Household | 372 (71.5%) | 148 (28.5%) |
| 4+ Person Household | 295 (73.8%) | 105 (26.3%) |
| Total Housing Units | 1,652 (68.2%) | 770 (31.8%) |
Occupancy by Educational Attainment in Mount Arlington borough
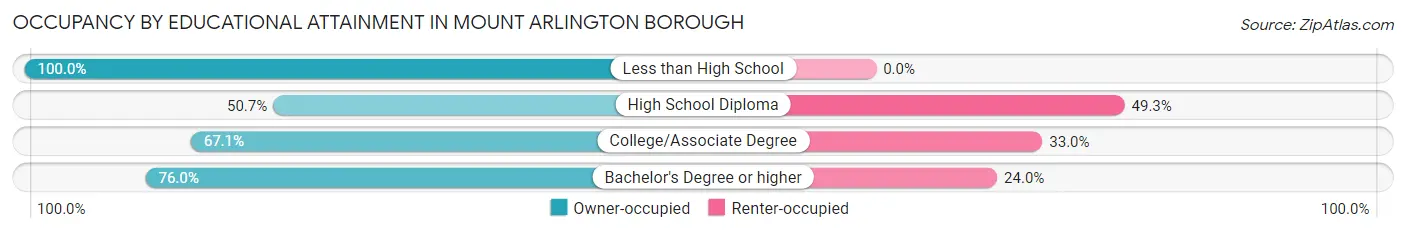
| Household Size | Owner-occupied | Renter-occupied |
| Less than High School | 79 (100.0%) | 0 (0.0%) |
| High School Diploma | 276 (50.7%) | 268 (49.3%) |
| College/Associate Degree | 527 (67.0%) | 259 (33.0%) |
| Bachelor's Degree or higher | 770 (76.0%) | 243 (24.0%) |
Occupancy by Age of Householder in Mount Arlington borough
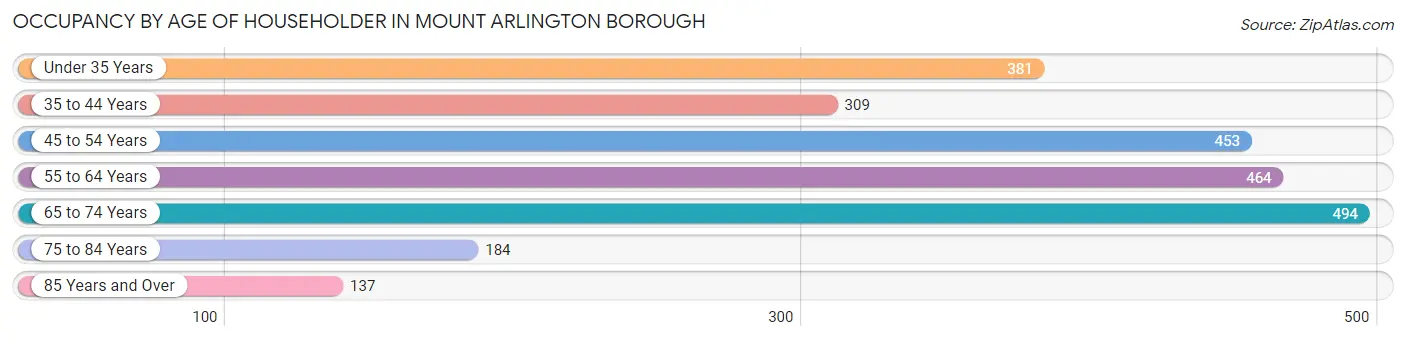
| Age Bracket | # Households | % Households |
| Under 35 Years | 381 | 15.7% |
| 35 to 44 Years | 309 | 12.8% |
| 45 to 54 Years | 453 | 18.7% |
| 55 to 64 Years | 464 | 19.2% |
| 65 to 74 Years | 494 | 20.4% |
| 75 to 84 Years | 184 | 7.6% |
| 85 Years and Over | 137 | 5.7% |
| Total | 2,422 | 100.0% |
Housing Finances in Mount Arlington borough
Median Income by Occupancy in Mount Arlington borough
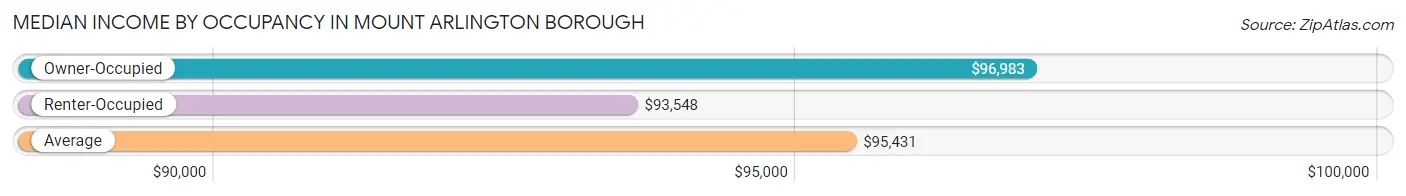
| Occupancy Type | # Households | Median Income |
| Owner-Occupied | 1,652 (68.2%) | $96,983 |
| Renter-Occupied | 770 (31.8%) | $93,548 |
| Average | 2,422 (100.0%) | $95,431 |
Occupancy by Householder Income Bracket in Mount Arlington borough
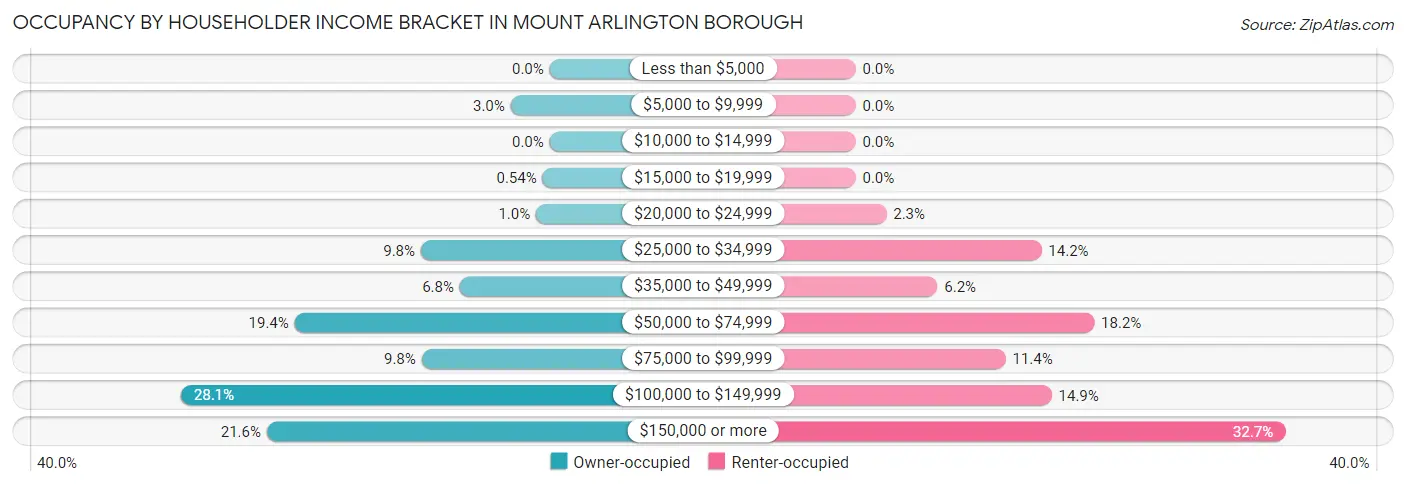
| Income Bracket | Owner-occupied | Renter-occupied |
| Less than $5,000 | 0 (0.0%) | 0 (0.0%) |
| $5,000 to $9,999 | 49 (3.0%) | 0 (0.0%) |
| $10,000 to $14,999 | 0 (0.0%) | 0 (0.0%) |
| $15,000 to $19,999 | 9 (0.5%) | 0 (0.0%) |
| $20,000 to $24,999 | 17 (1.0%) | 18 (2.3%) |
| $25,000 to $34,999 | 162 (9.8%) | 109 (14.2%) |
| $35,000 to $49,999 | 113 (6.8%) | 48 (6.2%) |
| $50,000 to $74,999 | 321 (19.4%) | 140 (18.2%) |
| $75,000 to $99,999 | 161 (9.8%) | 88 (11.4%) |
| $100,000 to $149,999 | 464 (28.1%) | 115 (14.9%) |
| $150,000 or more | 356 (21.5%) | 252 (32.7%) |
| Total | 1,652 (100.0%) | 770 (100.0%) |
Monthly Housing Cost Tiers in Mount Arlington borough
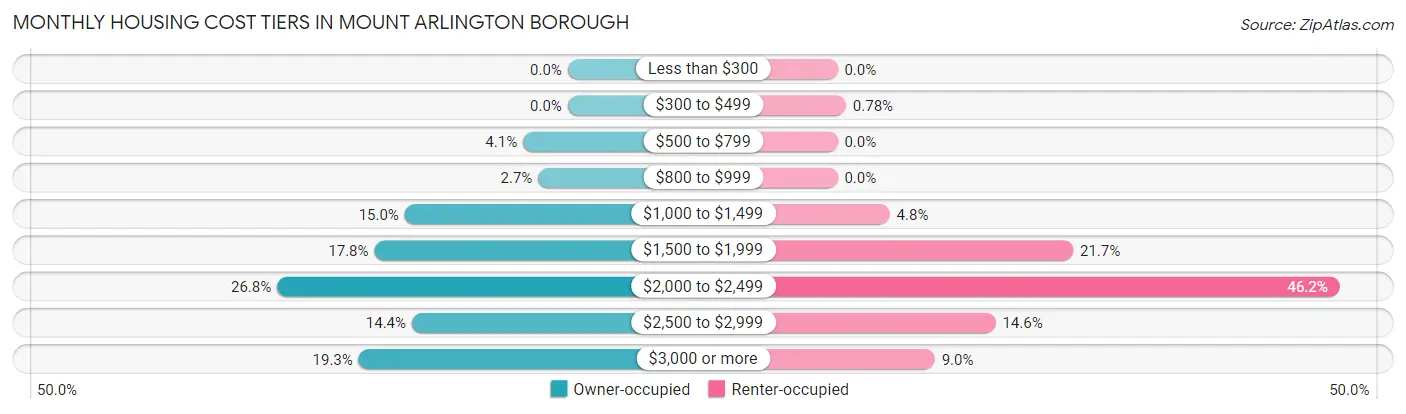
| Monthly Cost | Owner-occupied | Renter-occupied |
| Less than $300 | 0 (0.0%) | 0 (0.0%) |
| $300 to $499 | 0 (0.0%) | 6 (0.8%) |
| $500 to $799 | 68 (4.1%) | 0 (0.0%) |
| $800 to $999 | 45 (2.7%) | 0 (0.0%) |
| $1,000 to $1,499 | 248 (15.0%) | 37 (4.8%) |
| $1,500 to $1,999 | 294 (17.8%) | 167 (21.7%) |
| $2,000 to $2,499 | 442 (26.8%) | 356 (46.2%) |
| $2,500 to $2,999 | 237 (14.3%) | 112 (14.5%) |
| $3,000 or more | 318 (19.3%) | 69 (9.0%) |
| Total | 1,652 (100.0%) | 770 (100.0%) |
Physical Housing Characteristics in Mount Arlington borough
Housing Structures in Mount Arlington borough
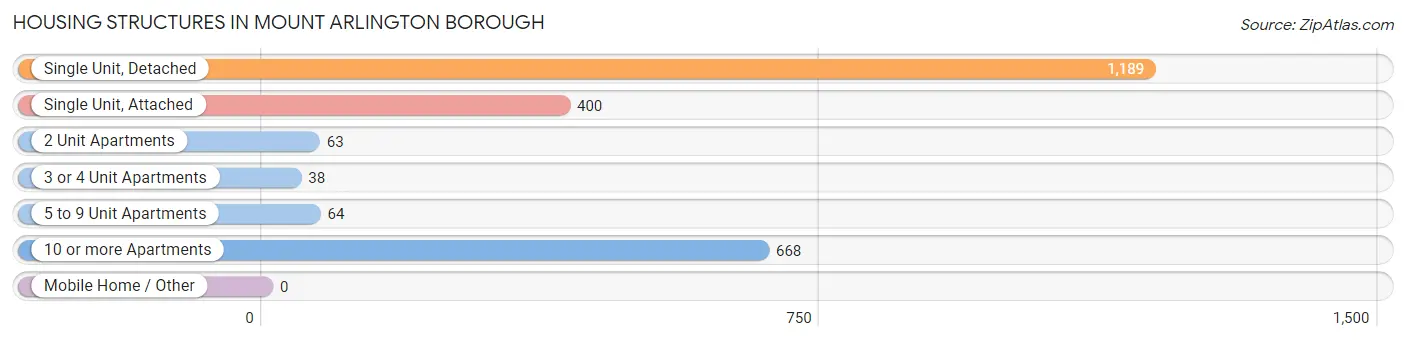
| Structure Type | # Housing Units | % Housing Units |
| Single Unit, Detached | 1,189 | 49.1% |
| Single Unit, Attached | 400 | 16.5% |
| 2 Unit Apartments | 63 | 2.6% |
| 3 or 4 Unit Apartments | 38 | 1.6% |
| 5 to 9 Unit Apartments | 64 | 2.6% |
| 10 or more Apartments | 668 | 27.6% |
| Mobile Home / Other | 0 | 0.0% |
| Total | 2,422 | 100.0% |
Housing Structures by Occupancy in Mount Arlington borough
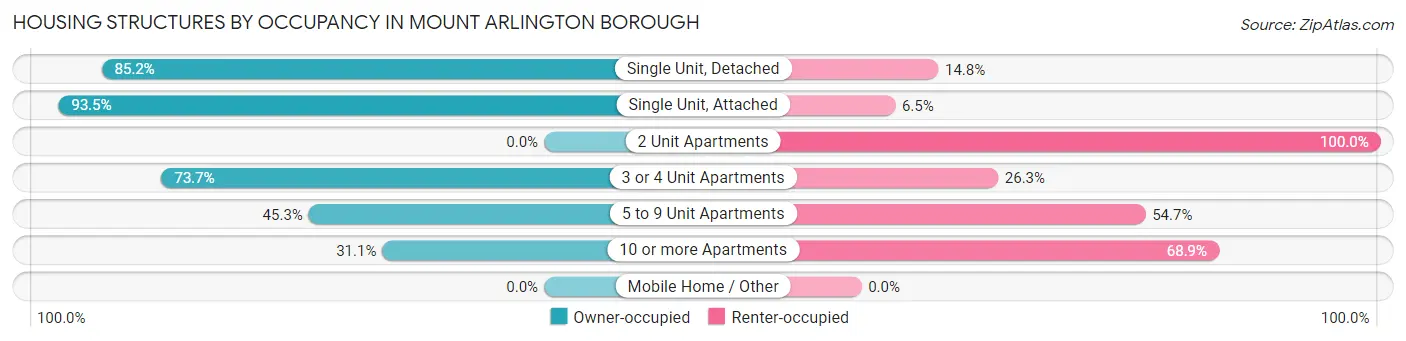
| Structure Type | Owner-occupied | Renter-occupied |
| Single Unit, Detached | 1,013 (85.2%) | 176 (14.8%) |
| Single Unit, Attached | 374 (93.5%) | 26 (6.5%) |
| 2 Unit Apartments | 0 (0.0%) | 63 (100.0%) |
| 3 or 4 Unit Apartments | 28 (73.7%) | 10 (26.3%) |
| 5 to 9 Unit Apartments | 29 (45.3%) | 35 (54.7%) |
| 10 or more Apartments | 208 (31.1%) | 460 (68.9%) |
| Mobile Home / Other | 0 (0.0%) | 0 (0.0%) |
| Total | 1,652 (68.2%) | 770 (31.8%) |
Housing Structures by Number of Rooms in Mount Arlington borough
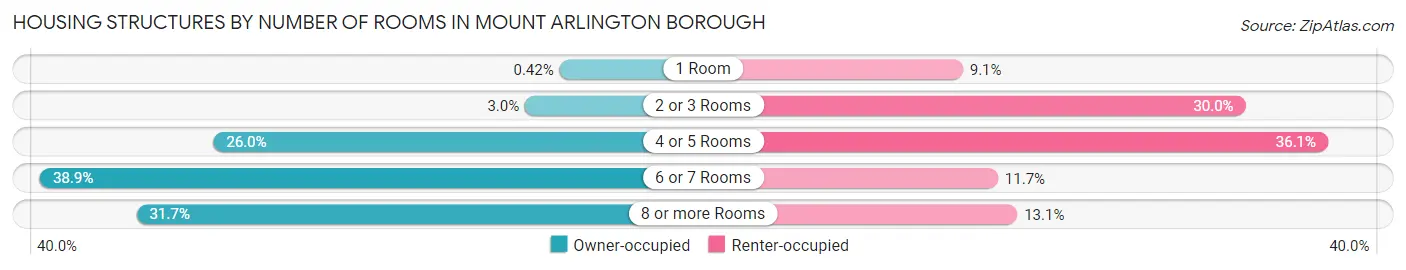
| Number of Rooms | Owner-occupied | Renter-occupied |
| 1 Room | 7 (0.4%) | 70 (9.1%) |
| 2 or 3 Rooms | 49 (3.0%) | 231 (30.0%) |
| 4 or 5 Rooms | 430 (26.0%) | 278 (36.1%) |
| 6 or 7 Rooms | 642 (38.9%) | 90 (11.7%) |
| 8 or more Rooms | 524 (31.7%) | 101 (13.1%) |
| Total | 1,652 (100.0%) | 770 (100.0%) |
Housing Structure by Heating Type in Mount Arlington borough
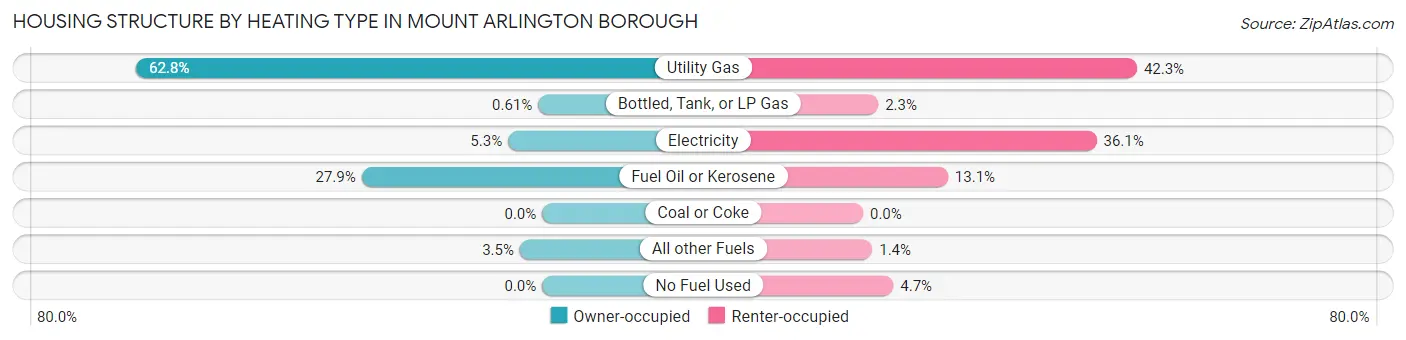
| Heating Type | Owner-occupied | Renter-occupied |
| Utility Gas | 1,037 (62.8%) | 326 (42.3%) |
| Bottled, Tank, or LP Gas | 10 (0.6%) | 18 (2.3%) |
| Electricity | 87 (5.3%) | 278 (36.1%) |
| Fuel Oil or Kerosene | 461 (27.9%) | 101 (13.1%) |
| Coal or Coke | 0 (0.0%) | 0 (0.0%) |
| All other Fuels | 57 (3.5%) | 11 (1.4%) |
| No Fuel Used | 0 (0.0%) | 36 (4.7%) |
| Total | 1,652 (100.0%) | 770 (100.0%) |
Household Vehicle Usage in Mount Arlington borough
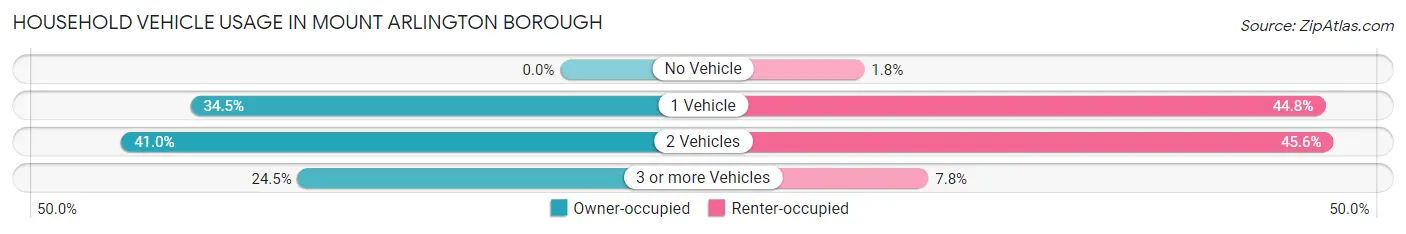
| Vehicles per Household | Owner-occupied | Renter-occupied |
| No Vehicle | 0 (0.0%) | 14 (1.8%) |
| 1 Vehicle | 570 (34.5%) | 345 (44.8%) |
| 2 Vehicles | 677 (41.0%) | 351 (45.6%) |
| 3 or more Vehicles | 405 (24.5%) | 60 (7.8%) |
| Total | 1,652 (100.0%) | 770 (100.0%) |
Real Estate & Mortgages in Mount Arlington borough
Real Estate and Mortgage Overview in Mount Arlington borough
| Characteristic | Without Mortgage | With Mortgage |
| Housing Units | 464 | 1,188 |
| Median Property Value | $346,000 | $389,300 |
| Median Household Income | $71,382 | $326 |
| Monthly Housing Costs | $1,273 | $311 |
| Real Estate Taxes | $7,370 | $0 |
Property Value by Mortgage Status in Mount Arlington borough
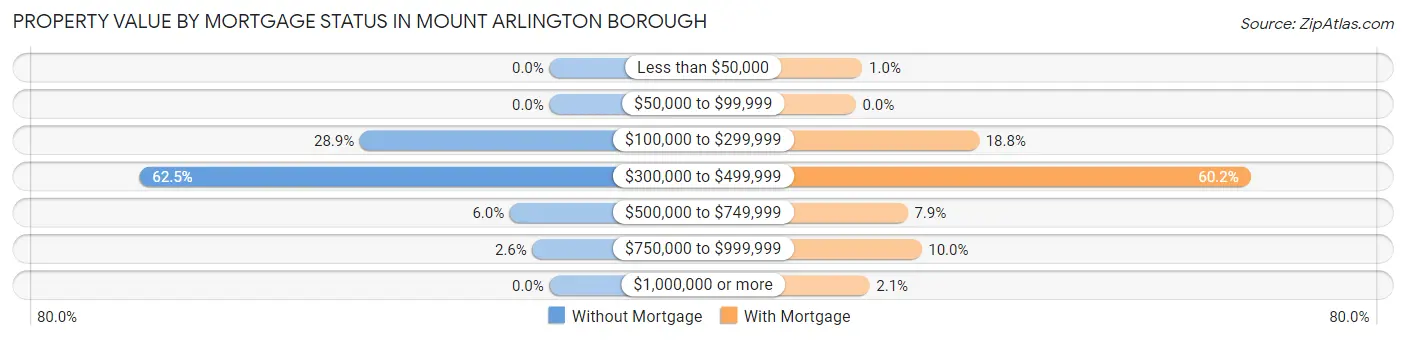
| Property Value | Without Mortgage | With Mortgage |
| Less than $50,000 | 0 (0.0%) | 12 (1.0%) |
| $50,000 to $99,999 | 0 (0.0%) | 0 (0.0%) |
| $100,000 to $299,999 | 134 (28.9%) | 223 (18.8%) |
| $300,000 to $499,999 | 290 (62.5%) | 715 (60.2%) |
| $500,000 to $749,999 | 28 (6.0%) | 94 (7.9%) |
| $750,000 to $999,999 | 12 (2.6%) | 119 (10.0%) |
| $1,000,000 or more | 0 (0.0%) | 25 (2.1%) |
| Total | 464 (100.0%) | 1,188 (100.0%) |
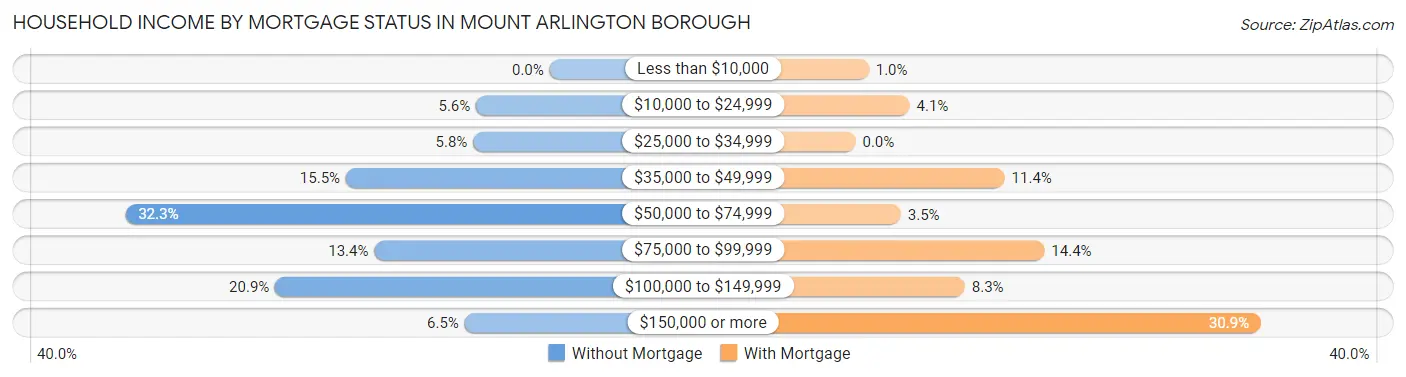
Household Income by Mortgage Status in Mount Arlington borough
| Household Income | Without Mortgage | With Mortgage |
| Less than $10,000 | 0 (0.0%) | 12 (1.0%) |
| $10,000 to $24,999 | 26 (5.6%) | 49 (4.1%) |
| $25,000 to $34,999 | 27 (5.8%) | 0 (0.0%) |
| $35,000 to $49,999 | 72 (15.5%) | 135 (11.4%) |
| $50,000 to $74,999 | 150 (32.3%) | 41 (3.5%) |
| $75,000 to $99,999 | 62 (13.4%) | 171 (14.4%) |
| $100,000 to $149,999 | 97 (20.9%) | 99 (8.3%) |
| $150,000 or more | 30 (6.5%) | 367 (30.9%) |
| Total | 464 (100.0%) | 1,188 (100.0%) |
Property Value to Household Income Ratio in Mount Arlington borough
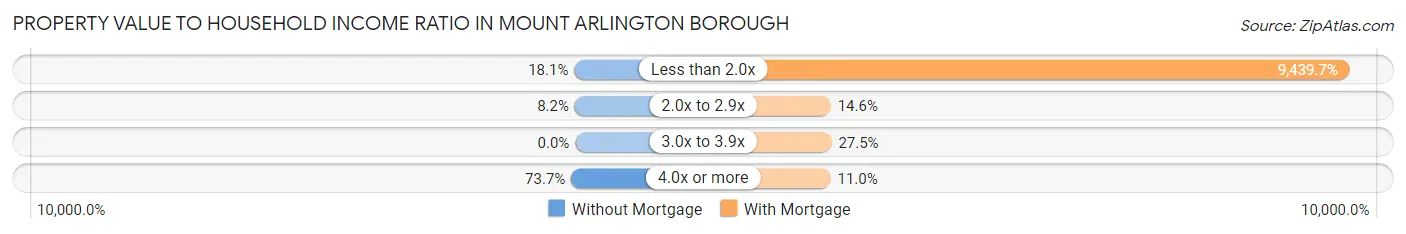
| Value-to-Income Ratio | Without Mortgage | With Mortgage |
| Less than 2.0x | 84 (18.1%) | 112,143 (9,439.7%) |
| 2.0x to 2.9x | 38 (8.2%) | 173 (14.6%) |
| 3.0x to 3.9x | 0 (0.0%) | 327 (27.5%) |
| 4.0x or more | 342 (73.7%) | 131 (11.0%) |
| Total | 464 (100.0%) | 1,188 (100.0%) |
Real Estate Taxes by Mortgage Status in Mount Arlington borough
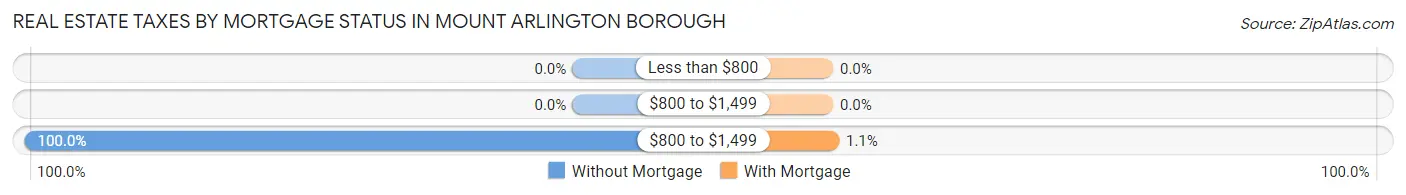
| Property Taxes | Without Mortgage | With Mortgage |
| Less than $800 | 0 (0.0%) | 0 (0.0%) |
| $800 to $1,499 | 0 (0.0%) | 0 (0.0%) |
| $800 to $1,499 | 464 (100.0%) | 13 (1.1%) |
| Total | 464 (100.0%) | 1,188 (100.0%) |
Health & Disability in Mount Arlington borough
Health Insurance Coverage by Age in Mount Arlington borough
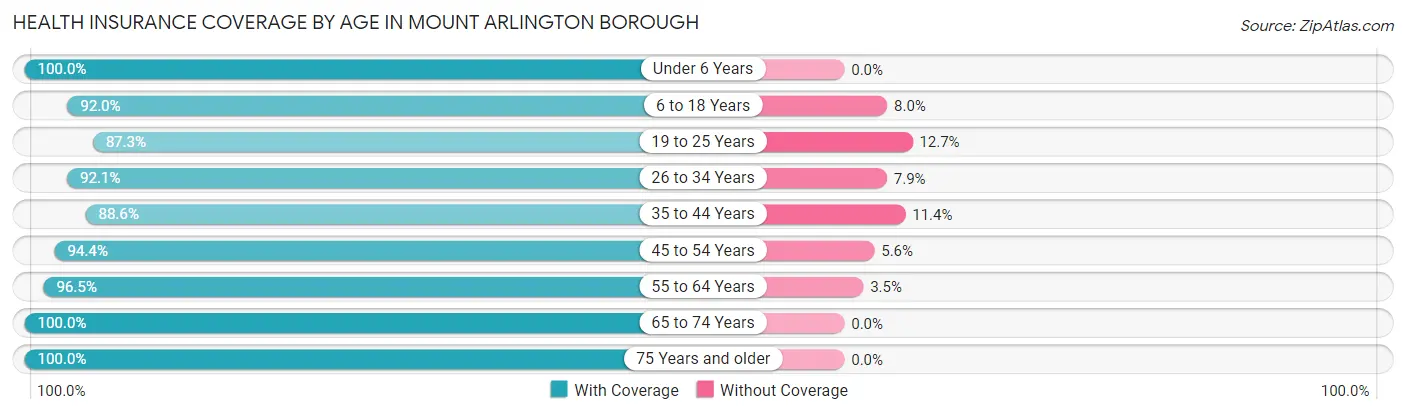
| Age Bracket | With Coverage | Without Coverage |
| Under 6 Years | 381 (100.0%) | 0 (0.0%) |
| 6 to 18 Years | 750 (92.0%) | 65 (8.0%) |
| 19 to 25 Years | 371 (87.3%) | 54 (12.7%) |
| 26 to 34 Years | 685 (92.1%) | 59 (7.9%) |
| 35 to 44 Years | 530 (88.6%) | 68 (11.4%) |
| 45 to 54 Years | 828 (94.4%) | 49 (5.6%) |
| 55 to 64 Years | 793 (96.5%) | 29 (3.5%) |
| 65 to 74 Years | 740 (100.0%) | 0 (0.0%) |
| 75 Years and older | 461 (100.0%) | 0 (0.0%) |
| Total | 5,539 (94.5%) | 324 (5.5%) |
Health Insurance Coverage by Citizenship Status in Mount Arlington borough
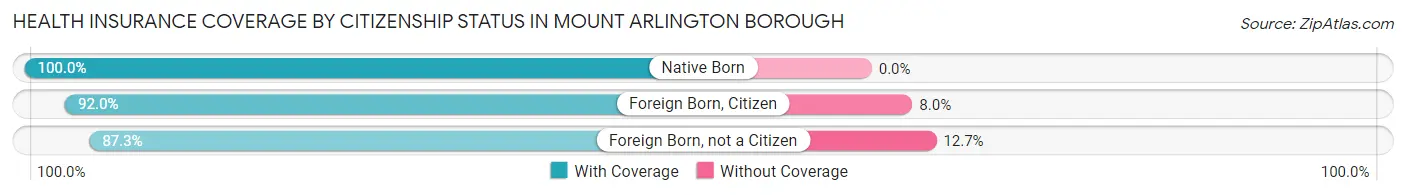
| Citizenship Status | With Coverage | Without Coverage |
| Native Born | 381 (100.0%) | 0 (0.0%) |
| Foreign Born, Citizen | 750 (92.0%) | 65 (8.0%) |
| Foreign Born, not a Citizen | 371 (87.3%) | 54 (12.7%) |
Health Insurance Coverage by Household Income in Mount Arlington borough
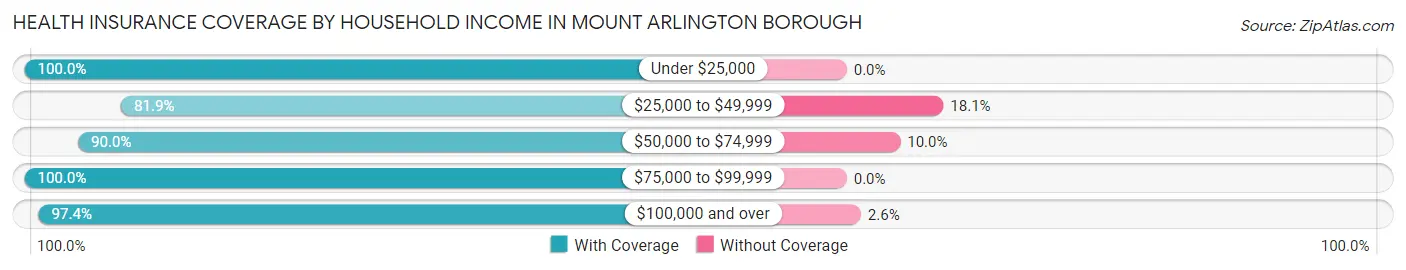
| Household Income | With Coverage | Without Coverage |
| Under $25,000 | 178 (100.0%) | 0 (0.0%) |
| $25,000 to $49,999 | 611 (81.9%) | 135 (18.1%) |
| $50,000 to $74,999 | 897 (90.0%) | 100 (10.0%) |
| $75,000 to $99,999 | 602 (100.0%) | 0 (0.0%) |
| $100,000 and over | 3,247 (97.4%) | 88 (2.6%) |
Public vs Private Health Insurance Coverage by Age in Mount Arlington borough
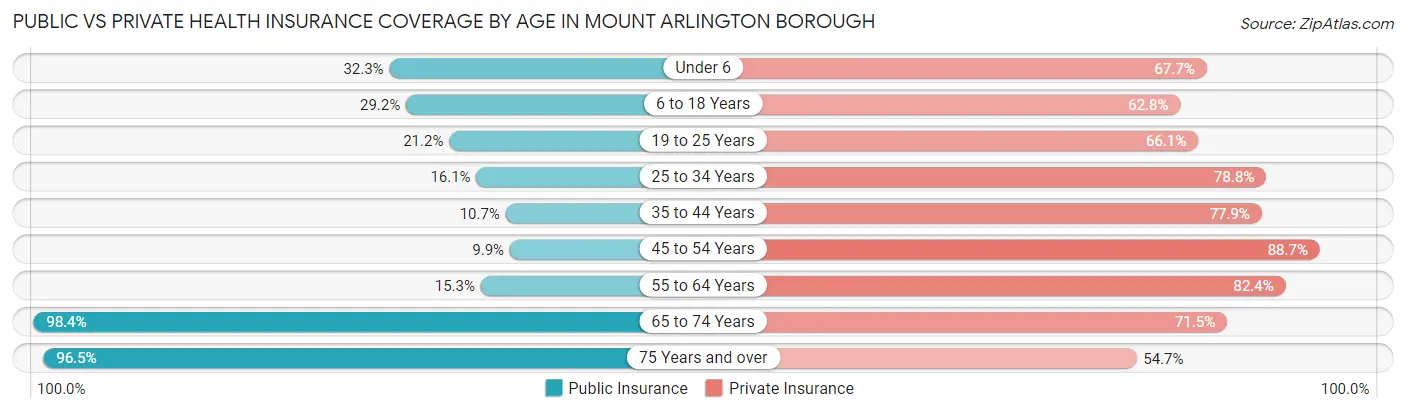
| Age Bracket | Public Insurance | Private Insurance |
| Under 6 | 123 (32.3%) | 258 (67.7%) |
| 6 to 18 Years | 238 (29.2%) | 512 (62.8%) |
| 19 to 25 Years | 90 (21.2%) | 281 (66.1%) |
| 25 to 34 Years | 120 (16.1%) | 586 (78.8%) |
| 35 to 44 Years | 64 (10.7%) | 466 (77.9%) |
| 45 to 54 Years | 87 (9.9%) | 778 (88.7%) |
| 55 to 64 Years | 126 (15.3%) | 677 (82.4%) |
| 65 to 74 Years | 728 (98.4%) | 529 (71.5%) |
| 75 Years and over | 445 (96.5%) | 252 (54.7%) |
| Total | 2,021 (34.5%) | 4,339 (74.0%) |
Disability Status by Sex by Age in Mount Arlington borough
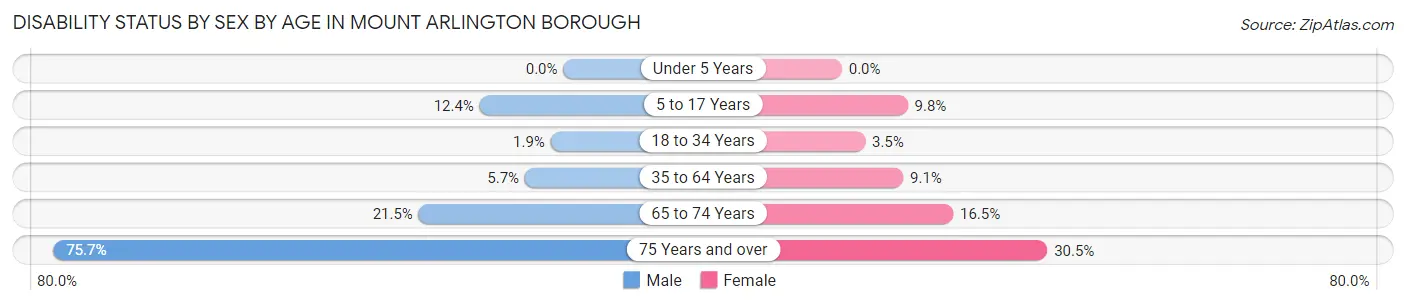
| Age Bracket | Male | Female |
| Under 5 Years | 0 (0.0%) | 0 (0.0%) |
| 5 to 17 Years | 39 (12.4%) | 42 (9.8%) |
| 18 to 34 Years | 11 (1.9%) | 24 (3.5%) |
| 35 to 64 Years | 59 (5.7%) | 115 (9.1%) |
| 65 to 74 Years | 64 (21.5%) | 73 (16.5%) |
| 75 Years and over | 153 (75.7%) | 79 (30.5%) |
Disability Class by Sex by Age in Mount Arlington borough
Disability Class: Hearing Difficulty
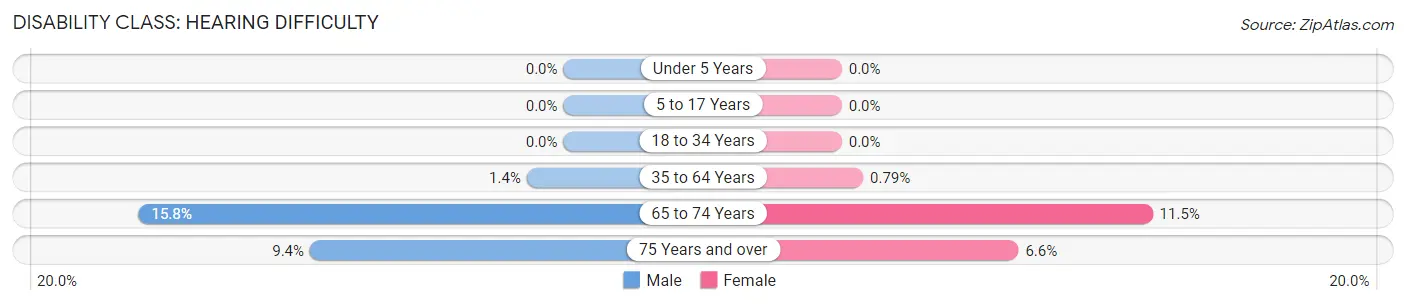
| Age Bracket | Male | Female |
| Under 5 Years | 0 (0.0%) | 0 (0.0%) |
| 5 to 17 Years | 0 (0.0%) | 0 (0.0%) |
| 18 to 34 Years | 0 (0.0%) | 0 (0.0%) |
| 35 to 64 Years | 14 (1.4%) | 10 (0.8%) |
| 65 to 74 Years | 47 (15.8%) | 51 (11.5%) |
| 75 Years and over | 19 (9.4%) | 17 (6.6%) |
Disability Class: Vision Difficulty
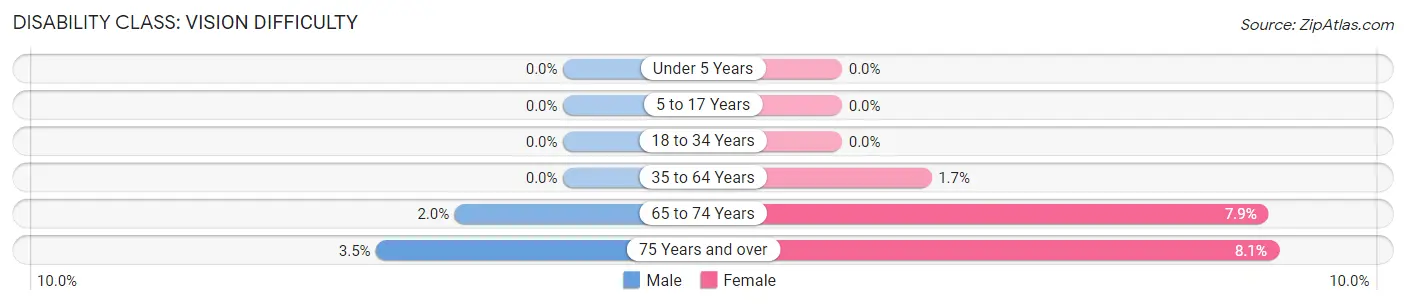
| Age Bracket | Male | Female |
| Under 5 Years | 0 (0.0%) | 0 (0.0%) |
| 5 to 17 Years | 0 (0.0%) | 0 (0.0%) |
| 18 to 34 Years | 0 (0.0%) | 0 (0.0%) |
| 35 to 64 Years | 0 (0.0%) | 21 (1.7%) |
| 65 to 74 Years | 6 (2.0%) | 35 (7.9%) |
| 75 Years and over | 7 (3.5%) | 21 (8.1%) |
Disability Class: Cognitive Difficulty
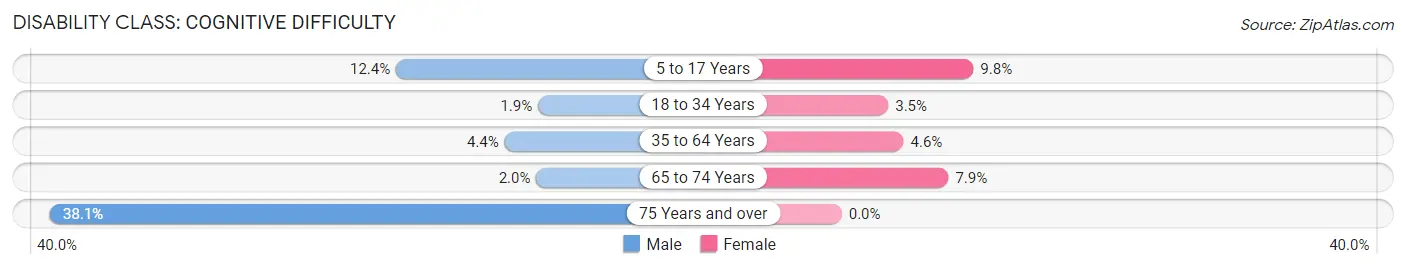
| Age Bracket | Male | Female |
| 5 to 17 Years | 39 (12.4%) | 42 (9.8%) |
| 18 to 34 Years | 11 (1.9%) | 24 (3.5%) |
| 35 to 64 Years | 45 (4.4%) | 58 (4.6%) |
| 65 to 74 Years | 6 (2.0%) | 35 (7.9%) |
| 75 Years and over | 77 (38.1%) | 0 (0.0%) |
Disability Class: Ambulatory Difficulty
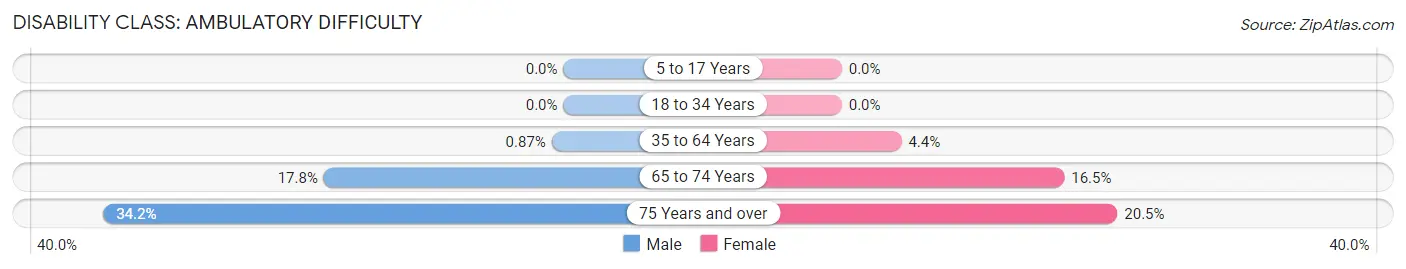
| Age Bracket | Male | Female |
| 5 to 17 Years | 0 (0.0%) | 0 (0.0%) |
| 18 to 34 Years | 0 (0.0%) | 0 (0.0%) |
| 35 to 64 Years | 9 (0.9%) | 56 (4.4%) |
| 65 to 74 Years | 53 (17.8%) | 73 (16.5%) |
| 75 Years and over | 69 (34.2%) | 53 (20.5%) |
Disability Class: Self-Care Difficulty
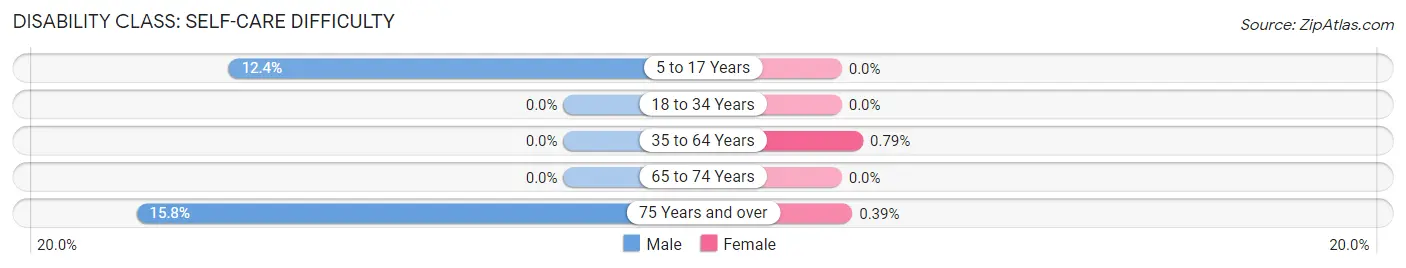
| Age Bracket | Male | Female |
| 5 to 17 Years | 39 (12.4%) | 0 (0.0%) |
| 18 to 34 Years | 0 (0.0%) | 0 (0.0%) |
| 35 to 64 Years | 0 (0.0%) | 10 (0.8%) |
| 65 to 74 Years | 0 (0.0%) | 0 (0.0%) |
| 75 Years and over | 32 (15.8%) | 1 (0.4%) |
Technology Access in Mount Arlington borough
Computing Device Access in Mount Arlington borough
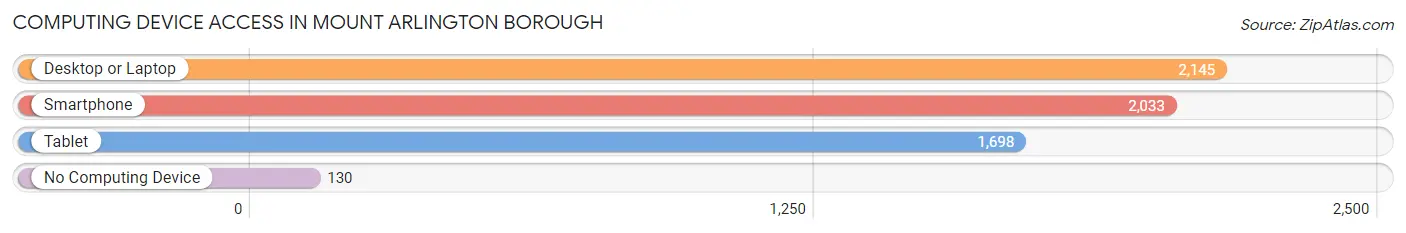
| Device Type | # Households | % Households |
| Desktop or Laptop | 2,145 | 88.6% |
| Smartphone | 2,033 | 83.9% |
| Tablet | 1,698 | 70.1% |
| No Computing Device | 130 | 5.4% |
| Total | 2,422 | 100.0% |
Internet Access in Mount Arlington borough
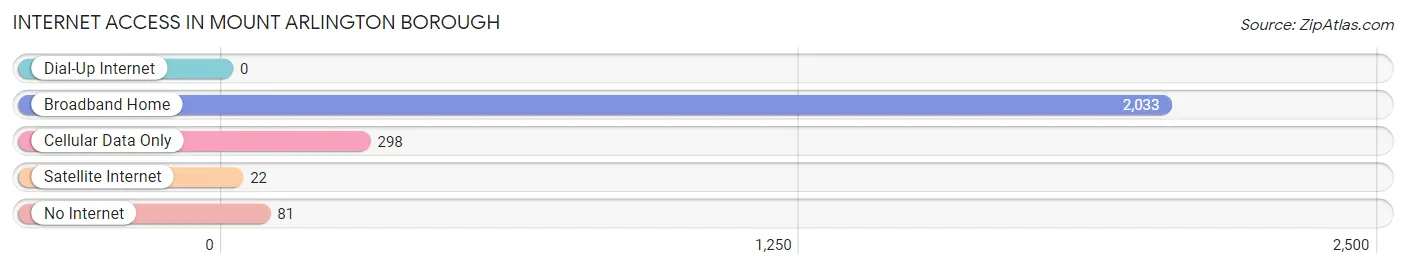
| Internet Type | # Households | % Households |
| Dial-Up Internet | 0 | 0.0% |
| Broadband Home | 2,033 | 83.9% |
| Cellular Data Only | 298 | 12.3% |
| Satellite Internet | 22 | 0.9% |
| No Internet | 81 | 3.3% |
| Total | 2,422 | 100.0% |
Mount Arlington borough Summary
History
The Borough of Mount Arlington, New Jersey is located in Morris County, New Jersey. It was incorporated in 1922 from portions of Roxbury Township. The area was originally inhabited by the Lenape Native Americans, who were later displaced by Dutch and English settlers. The area was known as “Mount Pleasant” until 1891, when it was renamed “Mount Arlington” in honor of the Revolutionary War hero, General Henry Knox.
The area was primarily rural until the 1950s, when the population began to grow rapidly due to the construction of Interstate 80 and the development of nearby Lake Hopatcong. The population of Mount Arlington has grown steadily since then, reaching a peak of 8,845 in 2010.
Geography
Mount Arlington is located in the northern part of Morris County, New Jersey. It is bordered by Roxbury Township to the north, Jefferson Township to the east, and Hopatcong Borough to the south. The borough is situated on the western shore of Lake Hopatcong, the largest lake in New Jersey. The lake is a popular destination for fishing, boating, and other recreational activities.
The borough has a total area of 2.7 square miles, all of which is land. The terrain is mostly flat, with some rolling hills in the northern part of the borough. The highest point in the borough is the summit of Mount Arlington, which rises to an elevation of 545 feet above sea level.
Economy
The economy of Mount Arlington is largely based on tourism and recreation. The borough is home to several marinas, boat clubs, and other recreational facilities that attract visitors from all over the region. The borough also has a number of restaurants, bars, and other businesses that cater to tourists.
The borough is also home to several light industrial and manufacturing businesses. These businesses provide employment for many of the borough’s residents.
Demographics
As of the 2010 census, the population of Mount Arlington was 8,845. The racial makeup of the borough was 87.3% White, 5.2% African American, 0.3% Native American, 2.7% Asian, and 4.5% from other races. Hispanic or Latino of any race were 8.7% of the population.
The median household income in the borough was $76,944, and the median family income was $90,917. The per capita income was $35,945. About 4.3% of families and 5.7% of the population were below the poverty line, including 6.7% of those under age 18 and 4.2% of those age 65 or over.
Mount Arlington is served by the Mount Arlington Public School District, which consists of two elementary schools, one middle school, and one high school. The borough is also home to several private schools, including the Mount Arlington Montessori School and the Mount Arlington Christian Academy.
Common Questions
What is Per Capita Income in Mount Arlington borough?
Per Capita income in Mount Arlington borough is $49,096.
What is the Median Family Income in Mount Arlington borough?
Median Family Income in Mount Arlington borough is $106,779.
What is the Median Household income in Mount Arlington borough?
Median Household Income in Mount Arlington borough is $95,431.
What is Income or Wage Gap in Mount Arlington borough?
Income or Wage Gap in Mount Arlington borough is 26.7%.
Women in Mount Arlington borough earn 73.3 cents for every dollar earned by a man.
What is Inequality or Gini Index in Mount Arlington borough?
Inequality or Gini Index in Mount Arlington borough is 0.40.
What is the Total Population of Mount Arlington borough?
Total Population of Mount Arlington borough is 5,863.
What is the Total Male Population of Mount Arlington borough?
Total Male Population of Mount Arlington borough is 2,605.
What is the Total Female Population of Mount Arlington borough?
Total Female Population of Mount Arlington borough is 3,258.
What is the Ratio of Males per 100 Females in Mount Arlington borough?
There are 79.96 Males per 100 Females in Mount Arlington borough.
What is the Ratio of Females per 100 Males in Mount Arlington borough?
There are 125.07 Females per 100 Males in Mount Arlington borough.
What is the Median Population Age in Mount Arlington borough?
Median Population Age in Mount Arlington borough is 44.8 Years.
What is the Average Family Size in Mount Arlington borough
Average Family Size in Mount Arlington borough is 3.1 People.
What is the Average Household Size in Mount Arlington borough
Average Household Size in Mount Arlington borough is 2.4 People.
How Large is the Labor Force in Mount Arlington borough?
There are 3,436 People in the Labor Forcein in Mount Arlington borough.
What is the Percentage of People in the Labor Force in Mount Arlington borough?
70.0% of People are in the Labor Force in Mount Arlington borough.
What is the Unemployment Rate in Mount Arlington borough?
Unemployment Rate in Mount Arlington borough is 2.5%.