Cities with the Most Immigrants from Southern Europe in Michigan
RELATED REPORTS & OPTIONS
Southern Europe
Michigan
Compare Cities
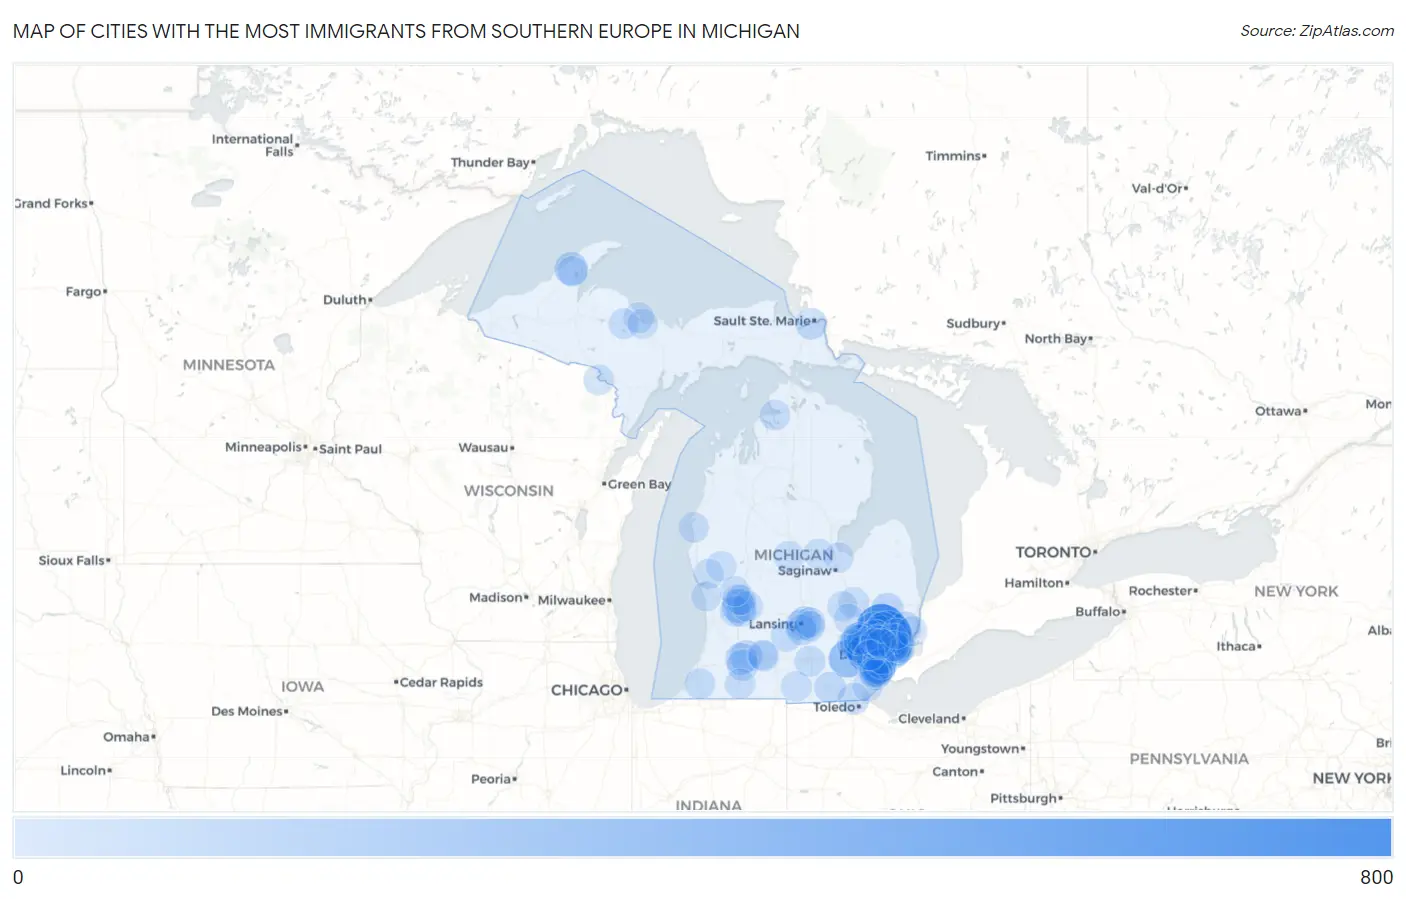
Map of Cities with the Most Immigrants from Southern Europe in Michigan
0
800
Cities with the Most Immigrants from Southern Europe in Michigan
| City | Southern Europe | vs State | vs National | |
| 1. | Rochester Hills | 639 | 13,176(4.85%)#1 | 728,588(0.09%)#115 |
| 2. | Sterling Heights | 594 | 13,176(4.51%)#2 | 728,588(0.08%)#126 |
| 3. | Livonia | 487 | 13,176(3.70%)#3 | 728,588(0.07%)#172 |
| 4. | Novi | 355 | 13,176(2.69%)#4 | 728,588(0.05%)#265 |
| 5. | Warren | 290 | 13,176(2.20%)#5 | 728,588(0.04%)#344 |
| 6. | Southgate | 289 | 13,176(2.19%)#6 | 728,588(0.04%)#346 |
| 7. | Troy | 274 | 13,176(2.08%)#7 | 728,588(0.04%)#369 |
| 8. | Dearborn | 258 | 13,176(1.96%)#8 | 728,588(0.04%)#401 |
| 9. | Dearborn Heights | 255 | 13,176(1.94%)#9 | 728,588(0.03%)#406 |
| 10. | St Clair Shores | 246 | 13,176(1.87%)#10 | 728,588(0.03%)#425 |
| 11. | Ann Arbor | 244 | 13,176(1.85%)#11 | 728,588(0.03%)#428 |
| 12. | Allen Park | 159 | 13,176(1.21%)#12 | 728,588(0.02%)#684 |
| 13. | Northville | 150 | 13,176(1.14%)#13 | 728,588(0.02%)#724 |
| 14. | Birmingham | 146 | 13,176(1.11%)#14 | 728,588(0.02%)#740 |
| 15. | Grosse Pointe Park | 142 | 13,176(1.08%)#15 | 728,588(0.02%)#765 |
| 16. | Detroit | 132 | 13,176(1.00%)#16 | 728,588(0.02%)#812 |
| 17. | Grand Rapids | 126 | 13,176(0.96%)#17 | 728,588(0.02%)#843 |
| 18. | Hancock | 111 | 13,176(0.84%)#18 | 728,588(0.02%)#941 |
| 19. | Grosse Pointe Woods | 108 | 13,176(0.82%)#19 | 728,588(0.01%)#972 |
| 20. | Auburn Hills | 101 | 13,176(0.77%)#20 | 728,588(0.01%)#1,033 |
| 21. | Eastpointe | 99 | 13,176(0.75%)#21 | 728,588(0.01%)#1,048 |
| 22. | Taylor | 95 | 13,176(0.72%)#22 | 728,588(0.01%)#1,088 |
| 23. | Riverview | 83 | 13,176(0.63%)#23 | 728,588(0.01%)#1,216 |
| 24. | Roseville | 76 | 13,176(0.58%)#24 | 728,588(0.01%)#1,294 |
| 25. | East Lansing | 76 | 13,176(0.58%)#25 | 728,588(0.01%)#1,295 |
| 26. | Farmington Hills | 70 | 13,176(0.53%)#26 | 728,588(0.01%)#1,385 |
| 27. | Comstock Northwest | 70 | 13,176(0.53%)#27 | 728,588(0.01%)#1,401 |
| 28. | Woodhaven | 68 | 13,176(0.52%)#28 | 728,588(0.01%)#1,427 |
| 29. | Kalamazoo | 62 | 13,176(0.47%)#29 | 728,588(0.01%)#1,533 |
| 30. | Almont | 62 | 13,176(0.47%)#30 | 728,588(0.01%)#1,549 |
| 31. | New Baltimore | 59 | 13,176(0.45%)#31 | 728,588(0.01%)#1,594 |
| 32. | Trenton | 57 | 13,176(0.43%)#32 | 728,588(0.01%)#1,621 |
| 33. | Lansing | 53 | 13,176(0.40%)#33 | 728,588(0.01%)#1,707 |
| 34. | Sault Ste Marie | 51 | 13,176(0.39%)#34 | 728,588(0.01%)#1,772 |
| 35. | Farmington | 51 | 13,176(0.39%)#35 | 728,588(0.01%)#1,773 |
| 36. | Lambertville | 49 | 13,176(0.37%)#36 | 728,588(0.01%)#1,817 |
| 37. | Portage | 48 | 13,176(0.36%)#37 | 728,588(0.01%)#1,833 |
| 38. | Adrian | 48 | 13,176(0.36%)#38 | 728,588(0.01%)#1,840 |
| 39. | Royal Oak | 45 | 13,176(0.34%)#39 | 728,588(0.01%)#1,923 |
| 40. | Grosse Pointe | 40 | 13,176(0.30%)#40 | 728,588(0.01%)#2,078 |
| 41. | South Lyon | 39 | 13,176(0.30%)#41 | 728,588(0.01%)#2,104 |
| 42. | Lincoln Park | 37 | 13,176(0.28%)#42 | 728,588(0.01%)#2,166 |
| 43. | Jackson | 35 | 13,176(0.27%)#43 | 728,588(0.00%)#2,254 |
| 44. | Plymouth | 35 | 13,176(0.27%)#44 | 728,588(0.00%)#2,272 |
| 45. | Charlotte | 34 | 13,176(0.26%)#45 | 728,588(0.00%)#2,312 |
| 46. | Westland | 33 | 13,176(0.25%)#46 | 728,588(0.00%)#2,326 |
| 47. | Kentwood | 32 | 13,176(0.24%)#47 | 728,588(0.00%)#2,362 |
| 48. | Grosse Pointe Farms | 32 | 13,176(0.24%)#48 | 728,588(0.00%)#2,381 |
| 49. | Clawson | 31 | 13,176(0.24%)#49 | 728,588(0.00%)#2,417 |
| 50. | Holt | 30 | 13,176(0.23%)#50 | 728,588(0.00%)#2,440 |
| 51. | Fraser | 29 | 13,176(0.22%)#51 | 728,588(0.00%)#2,496 |
| 52. | Comstock Park | 29 | 13,176(0.22%)#52 | 728,588(0.00%)#2,502 |
| 53. | Bloomfield Hills | 29 | 13,176(0.22%)#53 | 728,588(0.00%)#2,517 |
| 54. | Berrien Springs | 29 | 13,176(0.22%)#54 | 728,588(0.00%)#2,526 |
| 55. | Ferndale | 28 | 13,176(0.21%)#55 | 728,588(0.00%)#2,539 |
| 56. | River Rouge | 27 | 13,176(0.20%)#56 | 728,588(0.00%)#2,604 |
| 57. | Wyoming | 26 | 13,176(0.20%)#57 | 728,588(0.00%)#2,625 |
| 58. | Mount Pleasant | 25 | 13,176(0.19%)#58 | 728,588(0.00%)#2,677 |
| 59. | Hillsdale | 25 | 13,176(0.19%)#59 | 728,588(0.00%)#2,689 |
| 60. | Walled Lake | 25 | 13,176(0.19%)#60 | 728,588(0.00%)#2,691 |
| 61. | Battle Creek | 24 | 13,176(0.18%)#61 | 728,588(0.00%)#2,721 |
| 62. | Burton | 23 | 13,176(0.17%)#62 | 728,588(0.00%)#2,790 |
| 63. | Wixom | 23 | 13,176(0.17%)#63 | 728,588(0.00%)#2,797 |
| 64. | Melvindale | 23 | 13,176(0.17%)#64 | 728,588(0.00%)#2,803 |
| 65. | Petoskey | 23 | 13,176(0.17%)#65 | 728,588(0.00%)#2,816 |
| 66. | Rockwood | 23 | 13,176(0.17%)#66 | 728,588(0.00%)#2,823 |
| 67. | Marquette | 22 | 13,176(0.17%)#67 | 728,588(0.00%)#2,852 |
| 68. | Berkley | 22 | 13,176(0.17%)#68 | 728,588(0.00%)#2,859 |
| 69. | Village Of Grosse Pointe Shores | 22 | 13,176(0.17%)#69 | 728,588(0.00%)#2,898 |
| 70. | Wyandotte | 21 | 13,176(0.16%)#70 | 728,588(0.00%)#2,929 |
| 71. | Beverly Hills | 21 | 13,176(0.16%)#71 | 728,588(0.00%)#2,939 |
| 72. | Kingsford | 21 | 13,176(0.16%)#72 | 728,588(0.00%)#2,954 |
| 73. | Rochester | 20 | 13,176(0.15%)#73 | 728,588(0.00%)#2,998 |
| 74. | Haslett | 19 | 13,176(0.14%)#74 | 728,588(0.00%)#3,057 |
| 75. | Harper Woods | 19 | 13,176(0.14%)#75 | 728,588(0.00%)#3,062 |
| 76. | Ishpeming | 19 | 13,176(0.14%)#76 | 728,588(0.00%)#3,094 |
| 77. | Okemos | 18 | 13,176(0.14%)#77 | 728,588(0.00%)#3,136 |
| 78. | Forest Hills | 17 | 13,176(0.13%)#78 | 728,588(0.00%)#3,220 |
| 79. | Three Rivers | 17 | 13,176(0.13%)#79 | 728,588(0.00%)#3,250 |
| 80. | Ludington | 17 | 13,176(0.13%)#80 | 728,588(0.00%)#3,251 |
| 81. | Gibraltar | 16 | 13,176(0.12%)#81 | 728,588(0.00%)#3,341 |
| 82. | Southfield | 15 | 13,176(0.11%)#82 | 728,588(0.00%)#3,376 |
| 83. | Monroe | 15 | 13,176(0.11%)#83 | 728,588(0.00%)#3,395 |
| 84. | Houghton | 15 | 13,176(0.11%)#84 | 728,588(0.00%)#3,419 |
| 85. | Harvey | 15 | 13,176(0.11%)#85 | 728,588(0.00%)#3,452 |
| 86. | Garden City | 14 | 13,176(0.11%)#86 | 728,588(0.00%)#3,489 |
| 87. | Mount Clemens | 14 | 13,176(0.11%)#87 | 728,588(0.00%)#3,498 |
| 88. | Midland | 13 | 13,176(0.10%)#88 | 728,588(0.00%)#3,570 |
| 89. | Fremont | 13 | 13,176(0.10%)#89 | 728,588(0.00%)#3,618 |
| 90. | Twin Lake | 13 | 13,176(0.10%)#90 | 728,588(0.00%)#3,653 |
| 91. | Swartz Creek | 12 | 13,176(0.09%)#91 | 728,588(0.00%)#3,712 |
| 92. | Northview | 11 | 13,176(0.08%)#92 | 728,588(0.00%)#3,786 |
| 93. | Fenton | 11 | 13,176(0.08%)#93 | 728,588(0.00%)#3,797 |
| 94. | Flat Rock | 11 | 13,176(0.08%)#94 | 728,588(0.00%)#3,809 |
| 95. | Bay City | 10 | 13,176(0.08%)#95 | 728,588(0.00%)#3,905 |
| 96. | Springfield | 10 | 13,176(0.08%)#96 | 728,588(0.00%)#3,981 |
| 97. | Pearl Beach | 10 | 13,176(0.08%)#97 | 728,588(0.00%)#3,984 |
| 98. | Sparta | 10 | 13,176(0.08%)#98 | 728,588(0.00%)#3,996 |
| 99. | Ferrysburg | 10 | 13,176(0.08%)#99 | 728,588(0.00%)#4,009 |
| 100. | Pleasant Ridge | 10 | 13,176(0.08%)#100 | 728,588(0.00%)#4,017 |
Common Questions
What are the Top 10 Cities with the Most Immigrants from Southern Europe in Michigan?
Top 10 Cities with the Most Immigrants from Southern Europe in Michigan are:
#1
639
#2
594
#3
487
#4
355
#5
290
#6
289
#7
274
#8
258
#9
255
#10
246
What city has the Most Immigrants from Southern Europe in Michigan?
Rochester Hills has the Most Immigrants from Southern Europe in Michigan with 639.
What is the Total Immigrants from Southern Europe in the State of Michigan?
Total Immigrants from Southern Europe in Michigan is 13,176.
What is the Total Immigrants from Southern Europe in the United States?
Total Immigrants from Southern Europe in the United States is 728,588.