Cities with the Most Immigrants from Southern Europe in Pennsylvania
RELATED REPORTS & OPTIONS
Southern Europe
Pennsylvania
Compare Cities
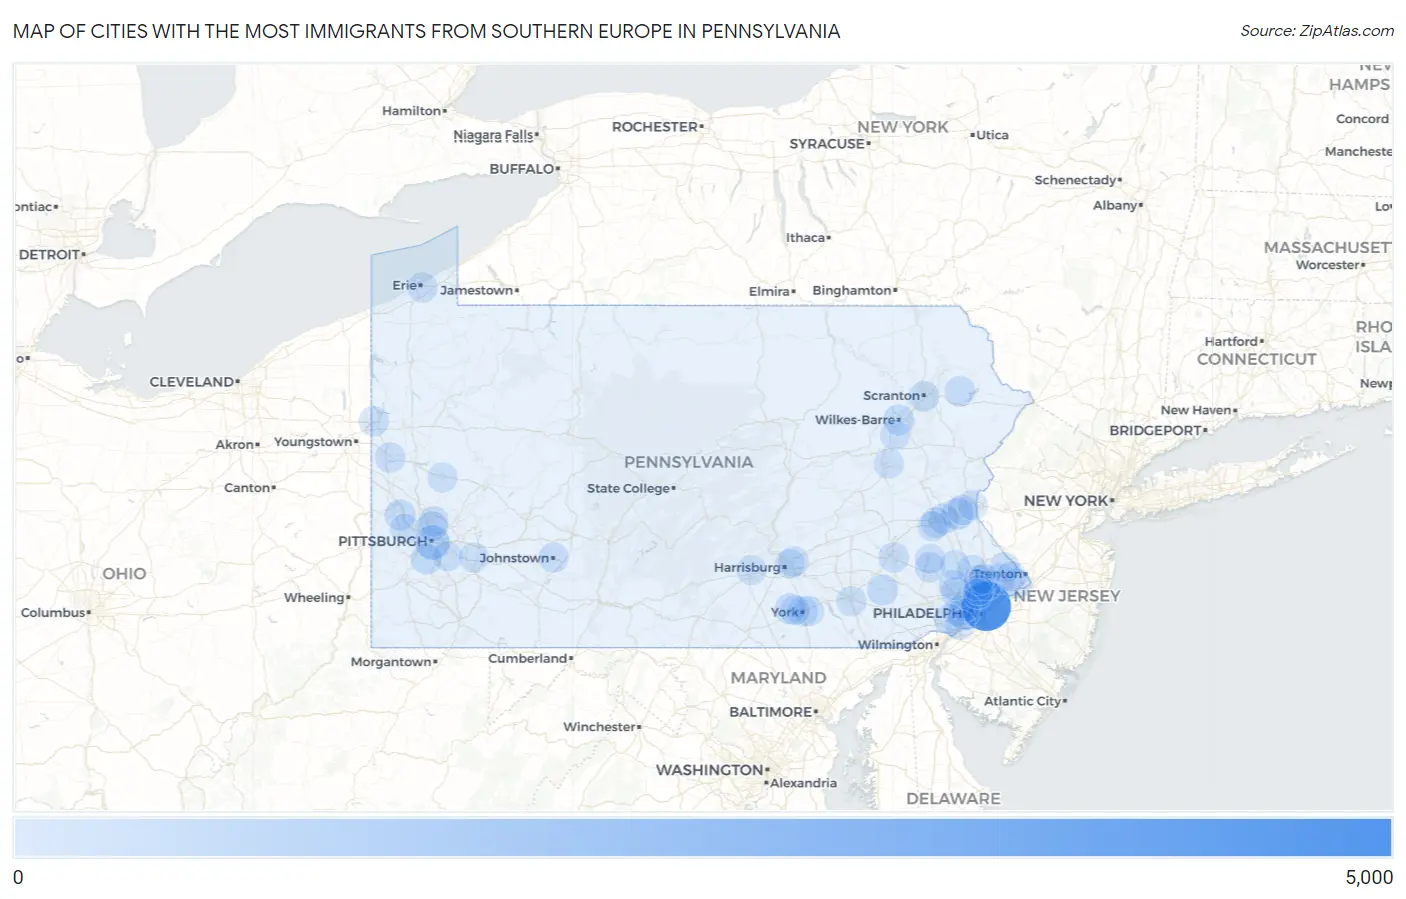
Map of Cities with the Most Immigrants from Southern Europe in Pennsylvania
0
5,000
Cities with the Most Immigrants from Southern Europe in Pennsylvania
| City | Southern Europe | vs State | vs National | |
| 1. | Philadelphia | 4,862 | 28,264(17.20%)#1 | 728,588(0.67%)#7 |
| 2. | Pittsburgh | 1,040 | 28,264(3.68%)#2 | 728,588(0.14%)#59 |
| 3. | Bethlehem | 456 | 28,264(1.61%)#3 | 728,588(0.06%)#191 |
| 4. | Wilkes Barre | 256 | 28,264(0.91%)#4 | 728,588(0.04%)#405 |
| 5. | Bethel Park | 228 | 28,264(0.81%)#5 | 728,588(0.03%)#470 |
| 6. | Aliquippa | 226 | 28,264(0.80%)#6 | 728,588(0.03%)#476 |
| 7. | East Earl | 224 | 28,264(0.79%)#7 | 728,588(0.03%)#484 |
| 8. | King Of Prussia | 219 | 28,264(0.77%)#8 | 728,588(0.03%)#491 |
| 9. | Weigelstown | 191 | 28,264(0.68%)#9 | 728,588(0.03%)#576 |
| 10. | Lansdale Borough | 184 | 28,264(0.65%)#10 | 728,588(0.03%)#593 |
| 11. | Allentown | 179 | 28,264(0.63%)#11 | 728,588(0.02%)#603 |
| 12. | Scranton | 169 | 28,264(0.60%)#12 | 728,588(0.02%)#642 |
| 13. | Wescosville | 161 | 28,264(0.57%)#13 | 728,588(0.02%)#679 |
| 14. | Drexel Hill | 147 | 28,264(0.52%)#14 | 728,588(0.02%)#732 |
| 15. | The Hideout | 142 | 28,264(0.50%)#15 | 728,588(0.02%)#766 |
| 16. | Reading | 113 | 28,264(0.40%)#16 | 728,588(0.02%)#926 |
| 17. | Brookhaven Borough | 113 | 28,264(0.40%)#17 | 728,588(0.02%)#930 |
| 18. | Churchville | 112 | 28,264(0.40%)#18 | 728,588(0.02%)#936 |
| 19. | Pottstown Borough | 105 | 28,264(0.37%)#19 | 728,588(0.01%)#994 |
| 20. | Broomall | 97 | 28,264(0.34%)#20 | 728,588(0.01%)#1,075 |
| 21. | Sharpsville Borough | 90 | 28,264(0.32%)#21 | 728,588(0.01%)#1,147 |
| 22. | Bridgeport Borough | 87 | 28,264(0.31%)#22 | 728,588(0.01%)#1,167 |
| 23. | Fort Washington | 80 | 28,264(0.28%)#23 | 728,588(0.01%)#1,254 |
| 24. | Stroudsburg Borough | 78 | 28,264(0.28%)#24 | 728,588(0.01%)#1,276 |
| 25. | Ardmore | 77 | 28,264(0.27%)#25 | 728,588(0.01%)#1,285 |
| 26. | Ancient Oaks | 77 | 28,264(0.27%)#26 | 728,588(0.01%)#1,289 |
| 27. | New Castle | 76 | 28,264(0.27%)#27 | 728,588(0.01%)#1,302 |
| 28. | Montgomeryville | 76 | 28,264(0.27%)#28 | 728,588(0.01%)#1,309 |
| 29. | Narberth Borough | 72 | 28,264(0.25%)#29 | 728,588(0.01%)#1,372 |
| 30. | Downingtown Borough | 70 | 28,264(0.25%)#30 | 728,588(0.01%)#1,399 |
| 31. | Jefferson Hills Borough | 68 | 28,264(0.24%)#31 | 728,588(0.01%)#1,428 |
| 32. | Middletown | 68 | 28,264(0.24%)#32 | 728,588(0.01%)#1,431 |
| 33. | State College Borough | 67 | 28,264(0.24%)#33 | 728,588(0.01%)#1,438 |
| 34. | Trooper | 66 | 28,264(0.23%)#34 | 728,588(0.01%)#1,475 |
| 35. | Green Tree Borough | 66 | 28,264(0.23%)#35 | 728,588(0.01%)#1,476 |
| 36. | Wyomissing Borough | 63 | 28,264(0.22%)#36 | 728,588(0.01%)#1,522 |
| 37. | Collingdale Borough | 62 | 28,264(0.22%)#37 | 728,588(0.01%)#1,546 |
| 38. | Erie | 58 | 28,264(0.21%)#38 | 728,588(0.01%)#1,602 |
| 39. | Baldwin Borough | 58 | 28,264(0.21%)#39 | 728,588(0.01%)#1,609 |
| 40. | Willow Grove | 56 | 28,264(0.20%)#40 | 728,588(0.01%)#1,644 |
| 41. | Dormont Borough | 56 | 28,264(0.20%)#41 | 728,588(0.01%)#1,648 |
| 42. | Pottsgrove | 55 | 28,264(0.19%)#42 | 728,588(0.01%)#1,678 |
| 43. | Lake City Borough | 55 | 28,264(0.19%)#43 | 728,588(0.01%)#1,679 |
| 44. | Levittown | 53 | 28,264(0.19%)#44 | 728,588(0.01%)#1,712 |
| 45. | York | 53 | 28,264(0.19%)#45 | 728,588(0.01%)#1,713 |
| 46. | Allison Park | 52 | 28,264(0.18%)#46 | 728,588(0.01%)#1,740 |
| 47. | Sharon | 52 | 28,264(0.18%)#47 | 728,588(0.01%)#1,745 |
| 48. | Canonsburg Borough | 52 | 28,264(0.18%)#48 | 728,588(0.01%)#1,749 |
| 49. | Lima | 52 | 28,264(0.18%)#49 | 728,588(0.01%)#1,756 |
| 50. | Carlisle Borough | 51 | 28,264(0.18%)#50 | 728,588(0.01%)#1,765 |
| 51. | Newtown Grant | 51 | 28,264(0.18%)#51 | 728,588(0.01%)#1,776 |
| 52. | Eagleville Cdp Montgomery County | 51 | 28,264(0.18%)#52 | 728,588(0.01%)#1,778 |
| 53. | Glenshaw | 49 | 28,264(0.17%)#53 | 728,588(0.01%)#1,819 |
| 54. | Maple Glen | 49 | 28,264(0.17%)#54 | 728,588(0.01%)#1,821 |
| 55. | Coraopolis Borough | 49 | 28,264(0.17%)#55 | 728,588(0.01%)#1,824 |
| 56. | Emmaus Borough | 48 | 28,264(0.17%)#56 | 728,588(0.01%)#1,845 |
| 57. | Johnstown | 47 | 28,264(0.17%)#57 | 728,588(0.01%)#1,873 |
| 58. | Whitehall Borough | 47 | 28,264(0.17%)#58 | 728,588(0.01%)#1,874 |
| 59. | Horsham | 46 | 28,264(0.16%)#59 | 728,588(0.01%)#1,904 |
| 60. | Woodlyn | 44 | 28,264(0.16%)#60 | 728,588(0.01%)#1,962 |
| 61. | Carnegie Borough | 44 | 28,264(0.16%)#61 | 728,588(0.01%)#1,968 |
| 62. | Hatboro Borough | 43 | 28,264(0.15%)#62 | 728,588(0.01%)#1,991 |
| 63. | Wyndmoor | 42 | 28,264(0.15%)#63 | 728,588(0.01%)#2,024 |
| 64. | Blakely Borough | 41 | 28,264(0.15%)#64 | 728,588(0.01%)#2,048 |
| 65. | Clearfield Borough | 40 | 28,264(0.14%)#65 | 728,588(0.01%)#2,077 |
| 66. | Le Raysville Borough | 40 | 28,264(0.14%)#66 | 728,588(0.01%)#2,086 |
| 67. | Lancaster | 39 | 28,264(0.14%)#67 | 728,588(0.01%)#2,092 |
| 68. | Hazleton | 39 | 28,264(0.14%)#68 | 728,588(0.01%)#2,093 |
| 69. | Woodbourne | 38 | 28,264(0.13%)#69 | 728,588(0.01%)#2,157 |
| 70. | Forest Hills Borough | 37 | 28,264(0.13%)#70 | 728,588(0.01%)#2,192 |
| 71. | New Hope Borough | 37 | 28,264(0.13%)#71 | 728,588(0.01%)#2,199 |
| 72. | East York | 36 | 28,264(0.13%)#72 | 728,588(0.00%)#2,228 |
| 73. | Schlusser | 35 | 28,264(0.12%)#73 | 728,588(0.00%)#2,278 |
| 74. | Mckeesport | 34 | 28,264(0.12%)#74 | 728,588(0.00%)#2,303 |
| 75. | Carnot Moon | 34 | 28,264(0.12%)#75 | 728,588(0.00%)#2,307 |
| 76. | Harleysville | 34 | 28,264(0.12%)#76 | 728,588(0.00%)#2,313 |
| 77. | Mountain Top | 33 | 28,264(0.12%)#77 | 728,588(0.00%)#2,338 |
| 78. | Denver Borough | 33 | 28,264(0.12%)#78 | 728,588(0.00%)#2,352 |
| 79. | Gilbertsville | 32 | 28,264(0.11%)#79 | 728,588(0.00%)#2,386 |
| 80. | Shiloh | 30 | 28,264(0.11%)#80 | 728,588(0.00%)#2,452 |
| 81. | Jeannette | 30 | 28,264(0.11%)#81 | 728,588(0.00%)#2,454 |
| 82. | Throop Borough | 30 | 28,264(0.11%)#82 | 728,588(0.00%)#2,462 |
| 83. | Butler | 29 | 28,264(0.10%)#83 | 728,588(0.00%)#2,498 |
| 84. | Elkins Park | 29 | 28,264(0.10%)#84 | 728,588(0.00%)#2,510 |
| 85. | Monaca Borough | 29 | 28,264(0.10%)#85 | 728,588(0.00%)#2,515 |
| 86. | Sewickley Borough | 29 | 28,264(0.10%)#86 | 728,588(0.00%)#2,522 |
| 87. | Easton | 28 | 28,264(0.10%)#87 | 728,588(0.00%)#2,533 |
| 88. | Oreland | 28 | 28,264(0.10%)#88 | 728,588(0.00%)#2,560 |
| 89. | Conshohocken Borough | 27 | 28,264(0.10%)#89 | 728,588(0.00%)#2,601 |
| 90. | Ambler Borough | 27 | 28,264(0.10%)#90 | 728,588(0.00%)#2,607 |
| 91. | West Chester Borough | 26 | 28,264(0.09%)#91 | 728,588(0.00%)#2,638 |
| 92. | Colonial Park | 26 | 28,264(0.09%)#92 | 728,588(0.00%)#2,641 |
| 93. | Roslyn | 26 | 28,264(0.09%)#93 | 728,588(0.00%)#2,650 |
| 94. | Progress | 25 | 28,264(0.09%)#94 | 728,588(0.00%)#2,682 |
| 95. | Vandergrift Borough | 25 | 28,264(0.09%)#95 | 728,588(0.00%)#2,700 |
| 96. | Luzerne Borough | 25 | 28,264(0.09%)#96 | 728,588(0.00%)#2,707 |
| 97. | Fox Chapel Borough | 24 | 28,264(0.08%)#97 | 728,588(0.00%)#2,755 |
| 98. | Aspinwall Borough | 24 | 28,264(0.08%)#98 | 728,588(0.00%)#2,763 |
| 99. | Verona Borough | 24 | 28,264(0.08%)#99 | 728,588(0.00%)#2,765 |
| 100. | Sinking Spring Borough | 23 | 28,264(0.08%)#100 | 728,588(0.00%)#2,819 |
Common Questions
What are the Top 10 Cities with the Most Immigrants from Southern Europe in Pennsylvania?
Top 10 Cities with the Most Immigrants from Southern Europe in Pennsylvania are:
#1
4,862
#2
1,040
#3
456
#4
256
#5
228
#6
226
#7
224
#8
219
#9
191
#10
179
What city has the Most Immigrants from Southern Europe in Pennsylvania?
Philadelphia has the Most Immigrants from Southern Europe in Pennsylvania with 4,862.
What is the Total Immigrants from Southern Europe in the State of Pennsylvania?
Total Immigrants from Southern Europe in Pennsylvania is 28,264.
What is the Total Immigrants from Southern Europe in the United States?
Total Immigrants from Southern Europe in the United States is 728,588.