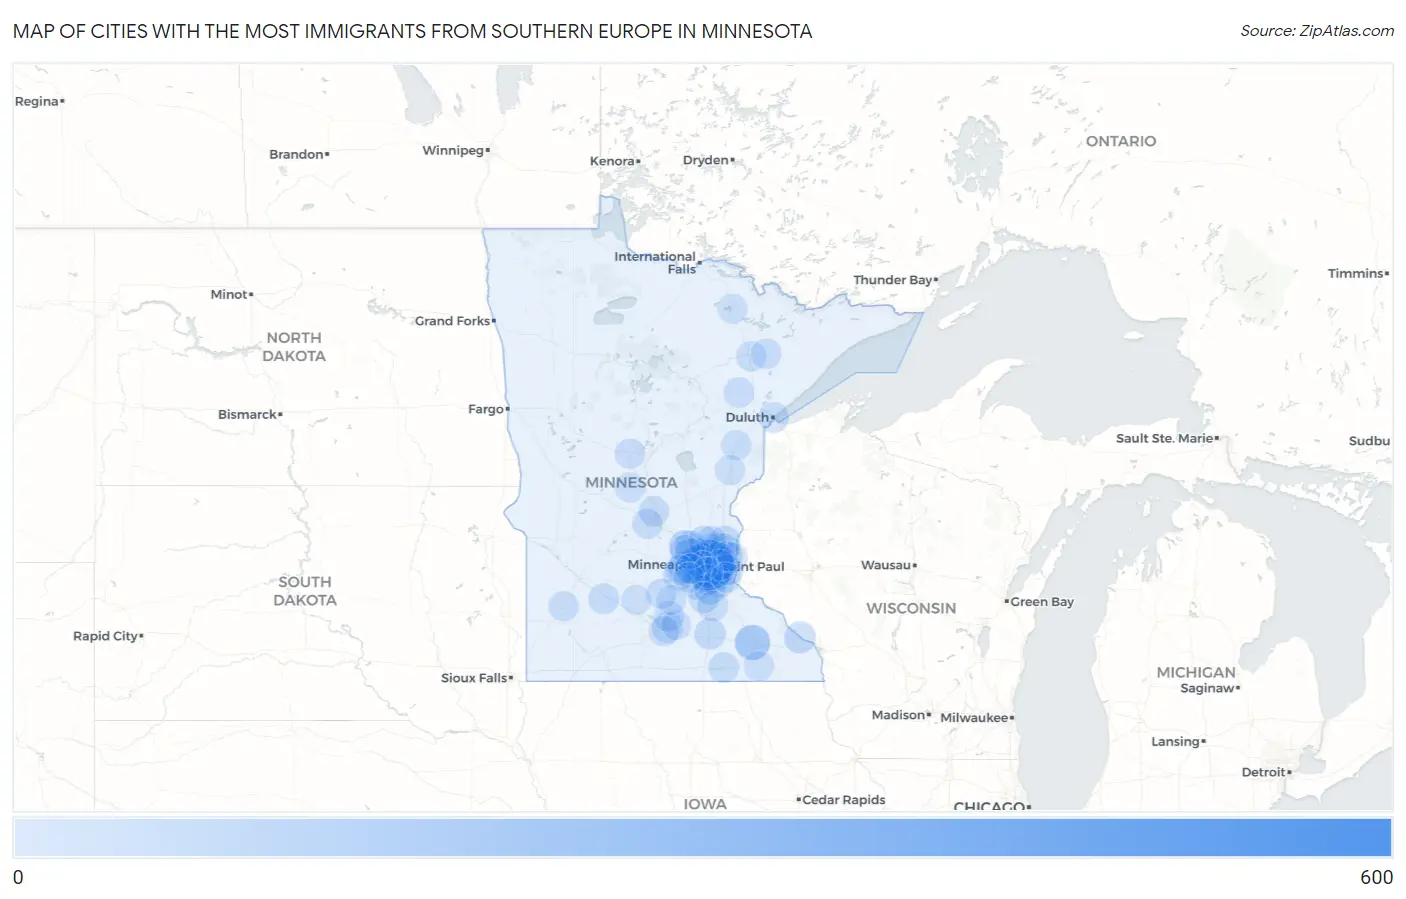
Cities with the Most Immigrants from Southern Europe in Minnesota
RELATED REPORTS & OPTIONS
Southern Europe
Minnesota
Compare Cities
Map of Cities with the Most Immigrants from Southern Europe in Minnesota
0
600
Cities with the Most Immigrants from Southern Europe in Minnesota
| City | Southern Europe | vs State | vs National | |
| 1. | Minneapolis | 589 | 2,564(22.97%)#1 | 728,588(0.08%)#130 |
| 2. | St Paul | 171 | 2,564(6.67%)#2 | 728,588(0.02%)#631 |
| 3. | Rochester | 145 | 2,564(5.66%)#3 | 728,588(0.02%)#746 |
| 4. | Minnetonka | 110 | 2,564(4.29%)#4 | 728,588(0.02%)#945 |
| 5. | Mound | 87 | 2,564(3.39%)#5 | 728,588(0.01%)#1,165 |
| 6. | Fridley | 83 | 2,564(3.24%)#6 | 728,588(0.01%)#1,212 |
| 7. | Eagan | 66 | 2,564(2.57%)#7 | 728,588(0.01%)#1,457 |
| 8. | Edina | 62 | 2,564(2.42%)#8 | 728,588(0.01%)#1,535 |
| 9. | Golden Valley | 62 | 2,564(2.42%)#9 | 728,588(0.01%)#1,541 |
| 10. | Maple Grove | 59 | 2,564(2.30%)#10 | 728,588(0.01%)#1,585 |
| 11. | St Michael | 57 | 2,564(2.22%)#11 | 728,588(0.01%)#1,620 |
| 12. | Prior Lake | 53 | 2,564(2.07%)#12 | 728,588(0.01%)#1,716 |
| 13. | Lakeville | 48 | 2,564(1.87%)#13 | 728,588(0.01%)#1,828 |
| 14. | Winona | 47 | 2,564(1.83%)#14 | 728,588(0.01%)#1,870 |
| 15. | Bloomington | 46 | 2,564(1.79%)#15 | 728,588(0.01%)#1,893 |
| 16. | Owatonna | 37 | 2,564(1.44%)#16 | 728,588(0.01%)#2,173 |
| 17. | Lino Lakes | 32 | 2,564(1.25%)#17 | 728,588(0.00%)#2,373 |
| 18. | Brooklyn Center | 31 | 2,564(1.21%)#18 | 728,588(0.00%)#2,407 |
| 19. | Crystal | 30 | 2,564(1.17%)#19 | 728,588(0.00%)#2,442 |
| 20. | Rosemount | 29 | 2,564(1.13%)#20 | 728,588(0.00%)#2,483 |
| 21. | Blaine | 28 | 2,564(1.09%)#21 | 728,588(0.00%)#2,528 |
| 22. | Forest Lake | 26 | 2,564(1.01%)#22 | 728,588(0.00%)#2,637 |
| 23. | Rogers | 26 | 2,564(1.01%)#23 | 728,588(0.00%)#2,648 |
| 24. | Hugo | 24 | 2,564(0.94%)#24 | 728,588(0.00%)#2,735 |
| 25. | Vadnais Heights | 24 | 2,564(0.94%)#25 | 728,588(0.00%)#2,739 |
| 26. | Plymouth | 23 | 2,564(0.90%)#26 | 728,588(0.00%)#2,775 |
| 27. | Burnsville | 23 | 2,564(0.90%)#27 | 728,588(0.00%)#2,777 |
| 28. | Andover | 23 | 2,564(0.90%)#28 | 728,588(0.00%)#2,785 |
| 29. | Waconia | 22 | 2,564(0.86%)#29 | 728,588(0.00%)#2,862 |
| 30. | Mankato | 21 | 2,564(0.82%)#30 | 728,588(0.00%)#2,916 |
| 31. | Redwood Falls | 21 | 2,564(0.82%)#31 | 728,588(0.00%)#2,955 |
| 32. | Austin | 20 | 2,564(0.78%)#32 | 728,588(0.00%)#2,982 |
| 33. | Elko New Market | 19 | 2,564(0.74%)#33 | 728,588(0.00%)#3,098 |
| 34. | Corcoran | 17 | 2,564(0.66%)#34 | 728,588(0.00%)#3,254 |
| 35. | Northfield | 16 | 2,564(0.62%)#35 | 728,588(0.00%)#3,303 |
| 36. | Duluth | 15 | 2,564(0.59%)#36 | 728,588(0.00%)#3,375 |
| 37. | Woodbury | 15 | 2,564(0.59%)#37 | 728,588(0.00%)#3,377 |
| 38. | Sartell | 15 | 2,564(0.59%)#38 | 728,588(0.00%)#3,396 |
| 39. | Maplewood | 14 | 2,564(0.55%)#39 | 728,588(0.00%)#3,485 |
| 40. | Stillwater | 13 | 2,564(0.51%)#40 | 728,588(0.00%)#3,586 |
| 41. | Virginia | 13 | 2,564(0.51%)#41 | 728,588(0.00%)#3,606 |
| 42. | Rockville | 13 | 2,564(0.51%)#42 | 728,588(0.00%)#3,646 |
| 43. | Grant | 11 | 2,564(0.43%)#43 | 728,588(0.00%)#3,844 |
| 44. | Richfield | 10 | 2,564(0.39%)#44 | 728,588(0.00%)#3,902 |
| 45. | Ham Lake | 10 | 2,564(0.39%)#45 | 728,588(0.00%)#3,931 |
| 46. | St Peter | 9 | 2,564(0.35%)#46 | 728,588(0.00%)#4,070 |
| 47. | Meadowlands | 9 | 2,564(0.35%)#47 | 728,588(0.00%)#4,197 |
| 48. | Marshall | 8 | 2,564(0.31%)#48 | 728,588(0.00%)#4,235 |
| 49. | Aurora | 8 | 2,564(0.31%)#49 | 728,588(0.00%)#4,316 |
| 50. | Arlington | 6 | 2,564(0.23%)#50 | 728,588(0.00%)#4,562 |
| 51. | Motley | 6 | 2,564(0.23%)#51 | 728,588(0.00%)#4,610 |
| 52. | Skyline | 6 | 2,564(0.23%)#52 | 728,588(0.00%)#4,620 |
| 53. | Hanover | 5 | 2,564(0.20%)#53 | 728,588(0.00%)#4,672 |
| 54. | Moose Lake | 5 | 2,564(0.20%)#54 | 728,588(0.00%)#4,673 |
| 55. | St Louis Park | 4 | 2,564(0.16%)#55 | 728,588(0.00%)#4,768 |
| 56. | Cottage Grove | 4 | 2,564(0.16%)#56 | 728,588(0.00%)#4,770 |
| 57. | Spring Valley | 4 | 2,564(0.16%)#57 | 728,588(0.00%)#4,823 |
| 58. | St Bonifacius | 4 | 2,564(0.16%)#58 | 728,588(0.00%)#4,836 |
| 59. | Gibbon | 4 | 2,564(0.16%)#59 | 728,588(0.00%)#4,889 |
| 60. | Tonka Bay | 3 | 2,564(0.12%)#60 | 728,588(0.00%)#4,975 |
| 61. | Madison Lake | 3 | 2,564(0.12%)#61 | 728,588(0.00%)#4,991 |
| 62. | Chaska | 2 | 2,564(0.08%)#62 | 728,588(0.00%)#5,046 |
| 63. | Sandstone | 2 | 2,564(0.08%)#63 | 728,588(0.00%)#5,083 |
| 64. | Henderson | 2 | 2,564(0.08%)#64 | 728,588(0.00%)#5,131 |
| 65. | Orr | 1 | 2,564(0.04%)#65 | 728,588(0.00%)#5,274 |
| 66. | Dresbach | 1 | 2,564(0.04%)#66 | 728,588(0.00%)#5,290 |
| 67. | Swanville | 1 | 2,564(0.04%)#67 | 728,588(0.00%)#5,294 |
Common Questions
What are the Top 10 Cities with the Most Immigrants from Southern Europe in Minnesota?
Top 10 Cities with the Most Immigrants from Southern Europe in Minnesota are:
#1
589
#2
171
#3
145
#4
110
#5
87
#6
83
#7
66
#8
62
#9
62
#10
59
What city has the Most Immigrants from Southern Europe in Minnesota?
Minneapolis has the Most Immigrants from Southern Europe in Minnesota with 589.
What is the Total Immigrants from Southern Europe in the State of Minnesota?
Total Immigrants from Southern Europe in Minnesota is 2,564.
What is the Total Immigrants from Southern Europe in the United States?
Total Immigrants from Southern Europe in the United States is 728,588.