Cities with the Most Immigrants from Southern Europe in Colorado
RELATED REPORTS & OPTIONS
Southern Europe
Colorado
Compare Cities
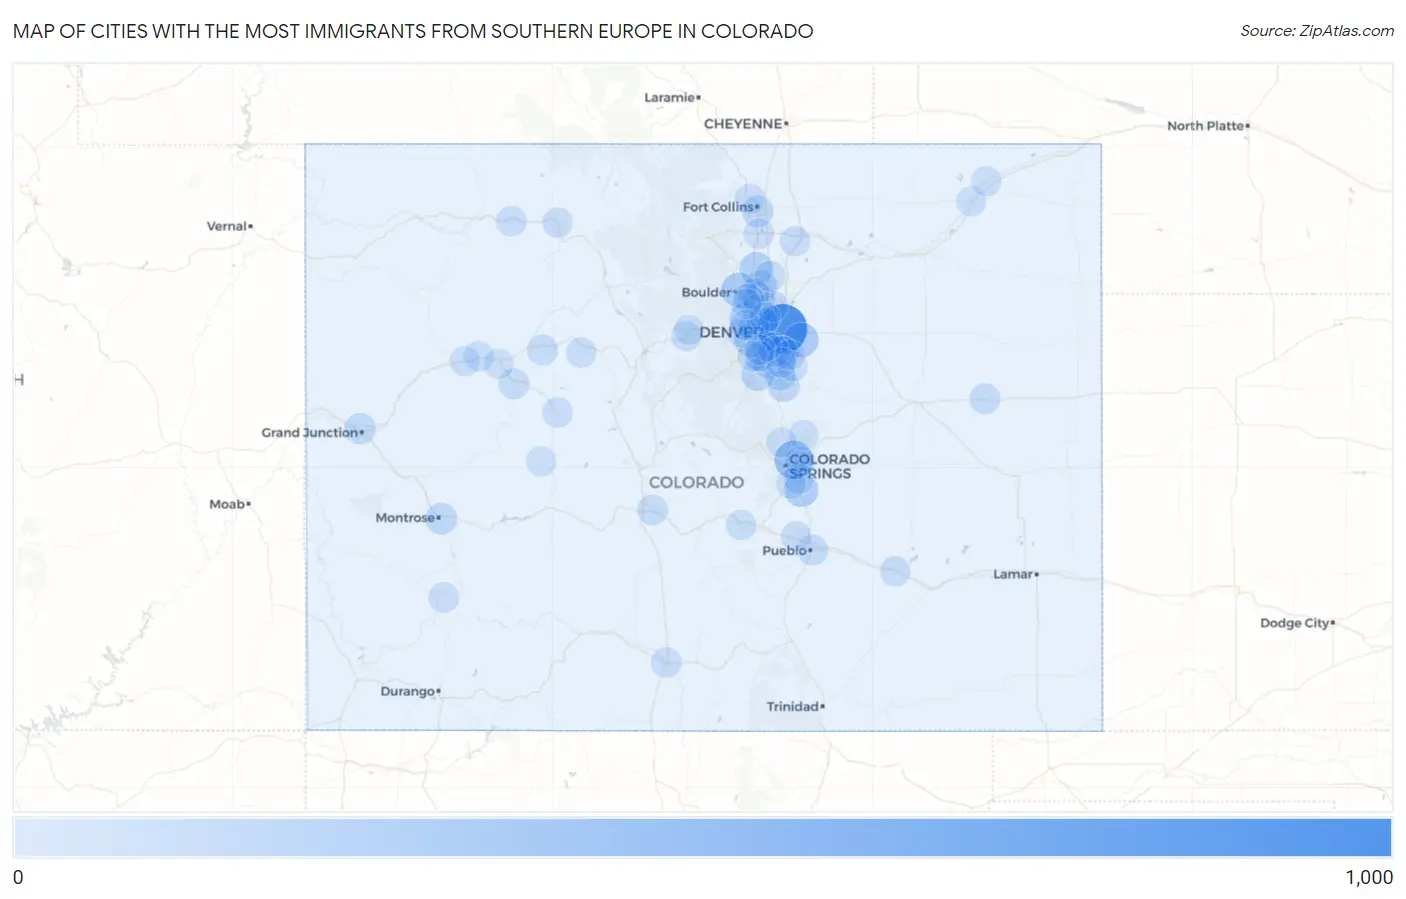
Map of Cities with the Most Immigrants from Southern Europe in Colorado
0
1,000
Cities with the Most Immigrants from Southern Europe in Colorado
| City | Southern Europe | vs State | vs National | |
| 1. | Denver | 990 | 4,746(20.86%)#1 | 728,588(0.14%)#64 |
| 2. | Colorado Springs | 403 | 4,746(8.49%)#2 | 728,588(0.06%)#227 |
| 3. | Boulder | 230 | 4,746(4.85%)#3 | 728,588(0.03%)#467 |
| 4. | Aurora | 225 | 4,746(4.74%)#4 | 728,588(0.03%)#477 |
| 5. | Fountain | 191 | 4,746(4.02%)#5 | 728,588(0.03%)#573 |
| 6. | Arvada | 182 | 4,746(3.83%)#6 | 728,588(0.02%)#597 |
| 7. | Lakewood | 176 | 4,746(3.71%)#7 | 728,588(0.02%)#615 |
| 8. | Longmont | 170 | 4,746(3.58%)#8 | 728,588(0.02%)#639 |
| 9. | Centennial | 130 | 4,746(2.74%)#9 | 728,588(0.02%)#825 |
| 10. | Broomfield | 109 | 4,746(2.30%)#10 | 728,588(0.01%)#958 |
| 11. | Roxborough Park | 91 | 4,746(1.92%)#11 | 728,588(0.01%)#1,140 |
| 12. | Montrose | 86 | 4,746(1.81%)#12 | 728,588(0.01%)#1,176 |
| 13. | Highlands Ranch | 85 | 4,746(1.79%)#13 | 728,588(0.01%)#1,181 |
| 14. | Fort Collins | 84 | 4,746(1.77%)#14 | 728,588(0.01%)#1,195 |
| 15. | Castle Rock | 78 | 4,746(1.64%)#15 | 728,588(0.01%)#1,264 |
| 16. | Erie | 75 | 4,746(1.58%)#16 | 728,588(0.01%)#1,319 |
| 17. | Grand Junction | 69 | 4,746(1.45%)#17 | 728,588(0.01%)#1,406 |
| 18. | Castle Pines | 66 | 4,746(1.39%)#18 | 728,588(0.01%)#1,469 |
| 19. | Wheat Ridge | 54 | 4,746(1.14%)#19 | 728,588(0.01%)#1,687 |
| 20. | Westminster | 53 | 4,746(1.12%)#20 | 728,588(0.01%)#1,706 |
| 21. | Thornton | 46 | 4,746(0.97%)#21 | 728,588(0.01%)#1,892 |
| 22. | Berkley | 46 | 4,746(0.97%)#22 | 728,588(0.01%)#1,907 |
| 23. | Pueblo | 44 | 4,746(0.93%)#23 | 728,588(0.01%)#1,953 |
| 24. | Gypsum | 37 | 4,746(0.78%)#24 | 728,588(0.01%)#2,191 |
| 25. | Lafayette | 36 | 4,746(0.76%)#25 | 728,588(0.00%)#2,207 |
| 26. | Littleton | 35 | 4,746(0.74%)#26 | 728,588(0.00%)#2,252 |
| 27. | Salida | 32 | 4,746(0.67%)#27 | 728,588(0.00%)#2,388 |
| 28. | Flagler | 31 | 4,746(0.65%)#28 | 728,588(0.00%)#2,431 |
| 29. | Golden | 29 | 4,746(0.61%)#29 | 728,588(0.00%)#2,490 |
| 30. | Cherry Creek | 29 | 4,746(0.61%)#30 | 728,588(0.00%)#2,500 |
| 31. | Carbondale | 29 | 4,746(0.61%)#31 | 728,588(0.00%)#2,511 |
| 32. | Frederick | 27 | 4,746(0.57%)#32 | 728,588(0.00%)#2,591 |
| 33. | Alamosa | 24 | 4,746(0.51%)#33 | 728,588(0.00%)#2,747 |
| 34. | Telluride | 23 | 4,746(0.48%)#34 | 728,588(0.00%)#2,830 |
| 35. | Hayden | 23 | 4,746(0.48%)#35 | 728,588(0.00%)#2,832 |
| 36. | Edwards | 22 | 4,746(0.46%)#36 | 728,588(0.00%)#2,867 |
| 37. | Loveland | 21 | 4,746(0.44%)#37 | 728,588(0.00%)#2,911 |
| 38. | Security Widefield | 21 | 4,746(0.44%)#38 | 728,588(0.00%)#2,919 |
| 39. | Evans | 21 | 4,746(0.44%)#39 | 728,588(0.00%)#2,933 |
| 40. | Sherrelwood | 20 | 4,746(0.42%)#40 | 728,588(0.00%)#2,987 |
| 41. | Cherry Hills Village | 17 | 4,746(0.36%)#41 | 728,588(0.00%)#3,255 |
| 42. | Pueblo West | 16 | 4,746(0.34%)#42 | 728,588(0.00%)#3,294 |
| 43. | Louisville | 15 | 4,746(0.32%)#43 | 728,588(0.00%)#3,392 |
| 44. | Greenwood Village | 15 | 4,746(0.32%)#44 | 728,588(0.00%)#3,402 |
| 45. | Aspen | 15 | 4,746(0.32%)#45 | 728,588(0.00%)#3,429 |
| 46. | Canon City | 14 | 4,746(0.29%)#46 | 728,588(0.00%)#3,496 |
| 47. | Parker | 13 | 4,746(0.27%)#47 | 728,588(0.00%)#3,566 |
| 48. | Steamboat Springs | 13 | 4,746(0.27%)#48 | 728,588(0.00%)#3,599 |
| 49. | Foxfield | 13 | 4,746(0.27%)#49 | 728,588(0.00%)#3,660 |
| 50. | Columbine | 12 | 4,746(0.25%)#50 | 728,588(0.00%)#3,674 |
| 51. | New Castle | 11 | 4,746(0.23%)#51 | 728,588(0.00%)#3,837 |
| 52. | Lone Tree | 10 | 4,746(0.21%)#52 | 728,588(0.00%)#3,943 |
| 53. | Manzanola | 10 | 4,746(0.21%)#53 | 728,588(0.00%)#4,039 |
| 54. | Lincoln Park | 9 | 4,746(0.19%)#54 | 728,588(0.00%)#4,124 |
| 55. | Laporte | 9 | 4,746(0.19%)#55 | 728,588(0.00%)#4,155 |
| 56. | Englewood | 8 | 4,746(0.17%)#56 | 728,588(0.00%)#4,214 |
| 57. | Ken Caryl | 8 | 4,746(0.17%)#57 | 728,588(0.00%)#4,215 |
| 58. | Fairmount | 8 | 4,746(0.17%)#58 | 728,588(0.00%)#4,243 |
| 59. | Glenwood Springs | 8 | 4,746(0.17%)#59 | 728,588(0.00%)#4,245 |
| 60. | Air Force Academy | 8 | 4,746(0.17%)#60 | 728,588(0.00%)#4,255 |
| 61. | Crested Butte | 8 | 4,746(0.17%)#61 | 728,588(0.00%)#4,321 |
| 62. | Cimarron Hills | 7 | 4,746(0.15%)#62 | 728,588(0.00%)#4,363 |
| 63. | Bow Mar | 7 | 4,746(0.15%)#63 | 728,588(0.00%)#4,465 |
| 64. | Fort Carson | 6 | 4,746(0.13%)#64 | 728,588(0.00%)#4,503 |
| 65. | Superior | 6 | 4,746(0.13%)#65 | 728,588(0.00%)#4,509 |
| 66. | Silt | 6 | 4,746(0.13%)#66 | 728,588(0.00%)#4,547 |
| 67. | Black Forest | 5 | 4,746(0.11%)#67 | 728,588(0.00%)#4,645 |
| 68. | Georgetown | 5 | 4,746(0.11%)#68 | 728,588(0.00%)#4,739 |
| 69. | Sterling | 2 | 4,746(0.04%)#69 | 728,588(0.00%)#5,059 |
| 70. | Empire | 2 | 4,746(0.04%)#70 | 728,588(0.00%)#5,164 |
| 71. | Iliff | 1 | 4,746(0.02%)#71 | 728,588(0.00%)#5,281 |
Common Questions
What are the Top 10 Cities with the Most Immigrants from Southern Europe in Colorado?
Top 10 Cities with the Most Immigrants from Southern Europe in Colorado are:
#1
990
#2
403
#3
230
#4
225
#5
191
#6
182
#7
176
#8
170
#9
130
#10
109
What city has the Most Immigrants from Southern Europe in Colorado?
Denver has the Most Immigrants from Southern Europe in Colorado with 990.
What is the Total Immigrants from Southern Europe in the State of Colorado?
Total Immigrants from Southern Europe in Colorado is 4,746.
What is the Total Immigrants from Southern Europe in the United States?
Total Immigrants from Southern Europe in the United States is 728,588.