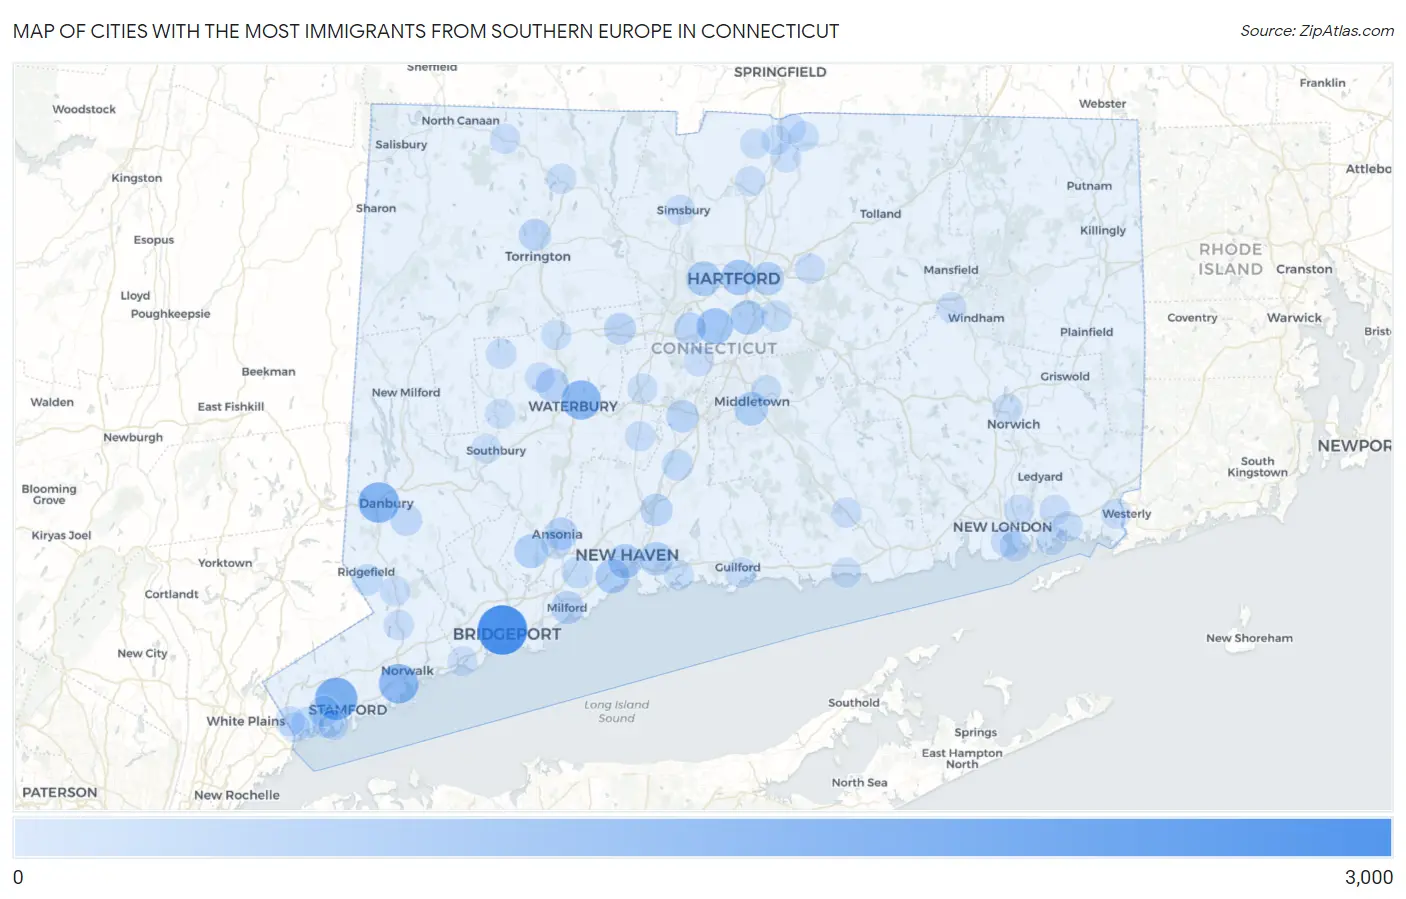
Cities with the Most Immigrants from Southern Europe in Connecticut
RELATED REPORTS & OPTIONS
Southern Europe
Connecticut
Compare Cities
Map of Cities with the Most Immigrants from Southern Europe in Connecticut
0
3,000
Cities with the Most Immigrants from Southern Europe in Connecticut
| City | Southern Europe | vs State | vs National | |
| 1. | Bridgeport | 2,561 | 30,627(8.36%)#1 | 728,588(0.35%)#20 |
| 2. | Stamford | 1,580 | 30,627(5.16%)#2 | 728,588(0.22%)#35 |
| 3. | Danbury | 1,365 | 30,627(4.46%)#3 | 728,588(0.19%)#40 |
| 4. | Norwalk | 1,212 | 30,627(3.96%)#4 | 728,588(0.17%)#45 |
| 5. | Waterbury | 1,187 | 30,627(3.88%)#5 | 728,588(0.16%)#47 |
| 6. | Naugatuck Borough | 977 | 30,627(3.19%)#6 | 728,588(0.13%)#67 |
| 7. | Newington | 776 | 30,627(2.53%)#7 | 728,588(0.11%)#89 |
| 8. | Hartford | 686 | 30,627(2.24%)#8 | 728,588(0.09%)#104 |
| 9. | West Hartford | 588 | 30,627(1.92%)#9 | 728,588(0.08%)#131 |
| 10. | Wethersfield | 553 | 30,627(1.81%)#10 | 728,588(0.08%)#140 |
| 11. | West Haven | 549 | 30,627(1.79%)#11 | 728,588(0.08%)#141 |
| 12. | New Haven | 524 | 30,627(1.71%)#12 | 728,588(0.07%)#158 |
| 13. | Shelton | 471 | 30,627(1.54%)#13 | 728,588(0.06%)#179 |
| 14. | Middletown | 465 | 30,627(1.52%)#14 | 728,588(0.06%)#186 |
| 15. | East Haven | 450 | 30,627(1.47%)#15 | 728,588(0.06%)#197 |
| 16. | East Hartford | 411 | 30,627(1.34%)#16 | 728,588(0.06%)#219 |
| 17. | Oakville | 373 | 30,627(1.22%)#17 | 728,588(0.05%)#253 |
| 18. | Milford City Balance | 356 | 30,627(1.16%)#18 | 728,588(0.05%)#264 |
| 19. | Ansonia | 339 | 30,627(1.11%)#19 | 728,588(0.05%)#284 |
| 20. | North Haven | 319 | 30,627(1.04%)#20 | 728,588(0.04%)#307 |
| 21. | Meriden | 317 | 30,627(1.04%)#21 | 728,588(0.04%)#308 |
| 22. | New Britain | 291 | 30,627(0.95%)#22 | 728,588(0.04%)#343 |
| 23. | Torrington | 285 | 30,627(0.93%)#23 | 728,588(0.04%)#356 |
| 24. | Bristol | 246 | 30,627(0.80%)#24 | 728,588(0.03%)#424 |
| 25. | Trumbull Center | 235 | 30,627(0.77%)#25 | 728,588(0.03%)#451 |
| 26. | Bethel | 212 | 30,627(0.69%)#26 | 728,588(0.03%)#507 |
| 27. | Orange | 189 | 30,627(0.62%)#27 | 728,588(0.03%)#580 |
| 28. | Greenwich | 188 | 30,627(0.61%)#28 | 728,588(0.03%)#583 |
| 29. | Wallingford Center | 170 | 30,627(0.56%)#29 | 728,588(0.02%)#640 |
| 30. | Northford | 160 | 30,627(0.52%)#30 | 728,588(0.02%)#682 |
| 31. | Ridgefield | 155 | 30,627(0.51%)#31 | 728,588(0.02%)#704 |
| 32. | Riverside | 153 | 30,627(0.50%)#32 | 728,588(0.02%)#711 |
| 33. | Staples | 153 | 30,627(0.50%)#33 | 728,588(0.02%)#712 |
| 34. | Glastonbury Center | 140 | 30,627(0.46%)#34 | 728,588(0.02%)#778 |
| 35. | Cos Cob | 140 | 30,627(0.46%)#35 | 728,588(0.02%)#779 |
| 36. | Tashua | 126 | 30,627(0.41%)#36 | 728,588(0.02%)#850 |
| 37. | Sandy Hook | 108 | 30,627(0.35%)#37 | 728,588(0.01%)#975 |
| 38. | Ridgebury | 105 | 30,627(0.34%)#38 | 728,588(0.01%)#998 |
| 39. | Daniels Farm | 100 | 30,627(0.33%)#39 | 728,588(0.01%)#1,045 |
| 40. | Saugatuck | 98 | 30,627(0.32%)#40 | 728,588(0.01%)#1,062 |
| 41. | Lordship | 97 | 30,627(0.32%)#41 | 728,588(0.01%)#1,078 |
| 42. | New London | 93 | 30,627(0.30%)#42 | 728,588(0.01%)#1,114 |
| 43. | Groton | 85 | 30,627(0.28%)#43 | 728,588(0.01%)#1,189 |
| 44. | Derby | 75 | 30,627(0.24%)#44 | 728,588(0.01%)#1,324 |
| 45. | Bethlehem Village | 74 | 30,627(0.24%)#45 | 728,588(0.01%)#1,338 |
| 46. | Greens Farms | 69 | 30,627(0.23%)#46 | 728,588(0.01%)#1,418 |
| 47. | Bantam Borough | 66 | 30,627(0.22%)#47 | 728,588(0.01%)#1,479 |
| 48. | New Canaan | 58 | 30,627(0.19%)#48 | 728,588(0.01%)#1,614 |
| 49. | Wilton Center | 57 | 30,627(0.19%)#49 | 728,588(0.01%)#1,633 |
| 50. | Kensington | 56 | 30,627(0.18%)#50 | 728,588(0.01%)#1,647 |
| 51. | East | 53 | 30,627(0.17%)#51 | 728,588(0.01%)#1,726 |
| 52. | Guilford Center | 50 | 30,627(0.16%)#52 | 728,588(0.01%)#1,807 |
| 53. | Norwich | 48 | 30,627(0.16%)#53 | 728,588(0.01%)#1,835 |
| 54. | Oronoque | 46 | 30,627(0.15%)#54 | 728,588(0.01%)#1,916 |
| 55. | Noank | 46 | 30,627(0.15%)#55 | 728,588(0.01%)#1,918 |
| 56. | Pawcatuck | 45 | 30,627(0.15%)#56 | 728,588(0.01%)#1,947 |
| 57. | Watertown | 44 | 30,627(0.14%)#57 | 728,588(0.01%)#1,976 |
| 58. | Manchester | 43 | 30,627(0.14%)#58 | 728,588(0.01%)#1,979 |
| 59. | Pemberwick | 42 | 30,627(0.14%)#59 | 728,588(0.01%)#2,028 |
| 60. | Conning Towers Nautilus Park | 36 | 30,627(0.12%)#60 | 728,588(0.00%)#2,230 |
| 61. | Cheshire Village | 36 | 30,627(0.12%)#61 | 728,588(0.00%)#2,234 |
| 62. | Taylor Corners | 33 | 30,627(0.11%)#62 | 728,588(0.00%)#2,358 |
| 63. | Deep River Center | 32 | 30,627(0.10%)#63 | 728,588(0.00%)#2,392 |
| 64. | Georgetown | 32 | 30,627(0.10%)#64 | 728,588(0.00%)#2,394 |
| 65. | Winsted | 31 | 30,627(0.10%)#65 | 728,588(0.00%)#2,423 |
| 66. | Simsbury Center | 30 | 30,627(0.10%)#66 | 728,588(0.00%)#2,458 |
| 67. | Windsor Locks | 28 | 30,627(0.09%)#67 | 728,588(0.00%)#2,548 |
| 68. | Old Greenwich | 28 | 30,627(0.09%)#68 | 728,588(0.00%)#2,557 |
| 69. | Thomaston | 28 | 30,627(0.09%)#69 | 728,588(0.00%)#2,569 |
| 70. | Old Mystic | 26 | 30,627(0.08%)#70 | 728,588(0.00%)#2,662 |
| 71. | Coleytown | 25 | 30,627(0.08%)#71 | 728,588(0.00%)#2,706 |
| 72. | Plantsville | 25 | 30,627(0.08%)#72 | 728,588(0.00%)#2,710 |
| 73. | Branford Center | 24 | 30,627(0.08%)#73 | 728,588(0.00%)#2,752 |
| 74. | Glenville | 24 | 30,627(0.08%)#74 | 728,588(0.00%)#2,761 |
| 75. | Southwood Acres | 22 | 30,627(0.07%)#75 | 728,588(0.00%)#2,876 |
| 76. | Portland | 22 | 30,627(0.07%)#76 | 728,588(0.00%)#2,881 |
| 77. | Hazardville | 22 | 30,627(0.07%)#77 | 728,588(0.00%)#2,883 |
| 78. | Mystic | 22 | 30,627(0.07%)#78 | 728,588(0.00%)#2,889 |
| 79. | Norfolk | 22 | 30,627(0.07%)#79 | 728,588(0.00%)#2,907 |
| 80. | Rock Ridge | 20 | 30,627(0.07%)#80 | 728,588(0.00%)#3,040 |
| 81. | Tokeneke | 19 | 30,627(0.06%)#81 | 728,588(0.00%)#3,116 |
| 82. | Stratford Downtown | 19 | 30,627(0.06%)#82 | 728,588(0.00%)#3,120 |
| 83. | Stepney | 18 | 30,627(0.06%)#83 | 728,588(0.00%)#3,184 |
| 84. | Compo | 18 | 30,627(0.06%)#84 | 728,588(0.00%)#3,185 |
| 85. | Westbrook Center | 18 | 30,627(0.06%)#85 | 728,588(0.00%)#3,190 |
| 86. | Mill Plain | 18 | 30,627(0.06%)#86 | 728,588(0.00%)#3,193 |
| 87. | Southport | 18 | 30,627(0.06%)#87 | 728,588(0.00%)#3,198 |
| 88. | Thompsonville | 17 | 30,627(0.06%)#88 | 728,588(0.00%)#3,249 |
| 89. | Suffield Depot | 17 | 30,627(0.06%)#89 | 728,588(0.00%)#3,281 |
| 90. | Newtown Borough | 16 | 30,627(0.05%)#90 | 728,588(0.00%)#3,366 |
| 91. | Darien Downtown | 16 | 30,627(0.05%)#91 | 728,588(0.00%)#3,371 |
| 92. | Sail Harbor | 16 | 30,627(0.05%)#92 | 728,588(0.00%)#3,374 |
| 93. | Heritage Village | 13 | 30,627(0.04%)#93 | 728,588(0.00%)#3,619 |
| 94. | Sherwood Manor | 12 | 30,627(0.04%)#94 | 728,588(0.00%)#3,714 |
| 95. | Woodmont Borough | 12 | 30,627(0.04%)#95 | 728,588(0.00%)#3,748 |
| 96. | Plattsville | 12 | 30,627(0.04%)#96 | 728,588(0.00%)#3,756 |
| 97. | Willimantic | 11 | 30,627(0.04%)#97 | 728,588(0.00%)#3,780 |
| 98. | Woodbury Center | 10 | 30,627(0.03%)#98 | 728,588(0.00%)#4,028 |
| 99. | Westport | 9 | 30,627(0.03%)#99 | 728,588(0.00%)#4,145 |
| 100. | Lakes West | 9 | 30,627(0.03%)#100 | 728,588(0.00%)#4,169 |
1
2Common Questions
What are the Top 10 Cities with the Most Immigrants from Southern Europe in Connecticut?
Top 10 Cities with the Most Immigrants from Southern Europe in Connecticut are:
#1
2,561
#2
1,580
#3
1,365
#4
1,212
#5
1,187
#6
776
#7
686
#8
588
#9
553
#10
549
What city has the Most Immigrants from Southern Europe in Connecticut?
Bridgeport has the Most Immigrants from Southern Europe in Connecticut with 2,561.
What is the Total Immigrants from Southern Europe in the State of Connecticut?
Total Immigrants from Southern Europe in Connecticut is 30,627.
What is the Total Immigrants from Southern Europe in the United States?
Total Immigrants from Southern Europe in the United States is 728,588.