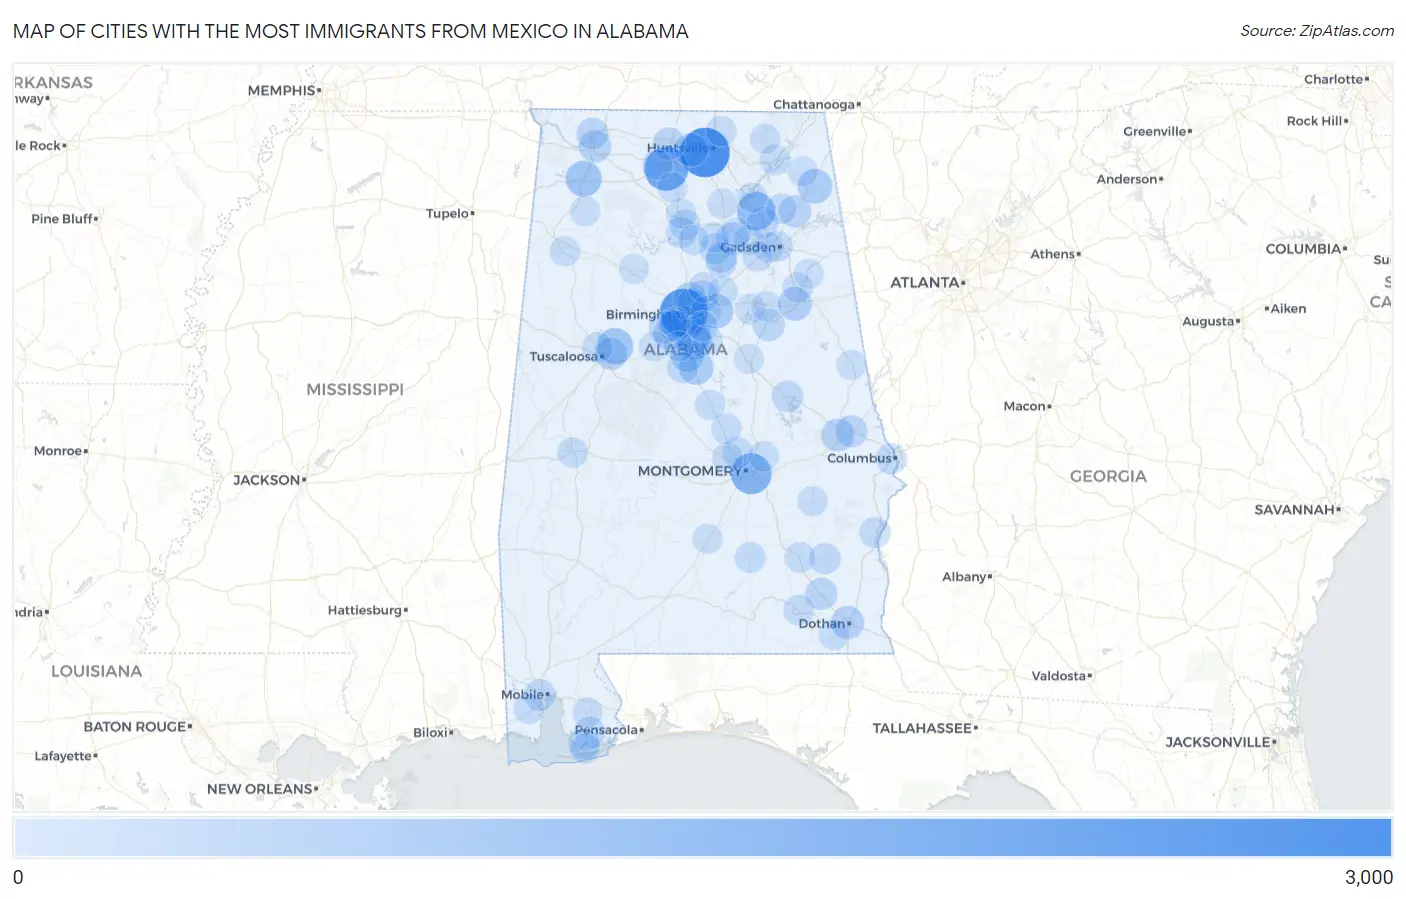
Cities with the Most Immigrants from Mexico in Alabama
RELATED REPORTS & OPTIONS
Mexico
Alabama
Compare Cities
Map of Cities with the Most Immigrants from Mexico in Alabama
0
3,000
Cities with the Most Immigrants from Mexico in Alabama
| City | Mexico | vs State | vs National | |
| 1. | Huntsville | 2,697 | 46,832(5.76%)#1 | 10,767,104(0.03%)#549 |
| 2. | Birmingham | 2,449 | 46,832(5.23%)#2 | 10,767,104(0.02%)#603 |
| 3. | Decatur | 1,928 | 46,832(4.12%)#3 | 10,767,104(0.02%)#734 |
| 4. | Montgomery | 1,466 | 46,832(3.13%)#4 | 10,767,104(0.01%)#889 |
| 5. | Albertville | 1,152 | 46,832(2.46%)#5 | 10,767,104(0.01%)#1,055 |
| 6. | Tuscaloosa | 872 | 46,832(1.86%)#6 | 10,767,104(0.01%)#1,297 |
| 7. | Hoover | 857 | 46,832(1.83%)#7 | 10,767,104(0.01%)#1,309 |
| 8. | Russellville | 837 | 46,832(1.79%)#8 | 10,767,104(0.01%)#1,332 |
| 9. | Fort Payne | 646 | 46,832(1.38%)#9 | 10,767,104(0.01%)#1,617 |
| 10. | Leeds | 623 | 46,832(1.33%)#10 | 10,767,104(0.01%)#1,661 |
| 11. | Calera | 616 | 46,832(1.32%)#11 | 10,767,104(0.01%)#1,672 |
| 12. | Pelham | 609 | 46,832(1.30%)#12 | 10,767,104(0.01%)#1,682 |
| 13. | Homewood | 541 | 46,832(1.16%)#13 | 10,767,104(0.01%)#1,822 |
| 14. | Oxford | 541 | 46,832(1.16%)#14 | 10,767,104(0.01%)#1,823 |
| 15. | Alabaster | 534 | 46,832(1.14%)#15 | 10,767,104(0.00%)#1,849 |
| 16. | Madison | 483 | 46,832(1.03%)#16 | 10,767,104(0.00%)#1,965 |
| 17. | Dothan | 462 | 46,832(0.99%)#17 | 10,767,104(0.00%)#2,019 |
| 18. | Fultondale | 429 | 46,832(0.92%)#18 | 10,767,104(0.00%)#2,128 |
| 19. | Susan Moore | 409 | 46,832(0.87%)#19 | 10,767,104(0.00%)#2,189 |
| 20. | Auburn | 401 | 46,832(0.86%)#20 | 10,767,104(0.00%)#2,218 |
| 21. | Athens | 381 | 46,832(0.81%)#21 | 10,767,104(0.00%)#2,298 |
| 22. | Muscle Shoals | 356 | 46,832(0.76%)#22 | 10,767,104(0.00%)#2,389 |
| 23. | Holt | 355 | 46,832(0.76%)#23 | 10,767,104(0.00%)#2,395 |
| 24. | Collinsville | 352 | 46,832(0.75%)#24 | 10,767,104(0.00%)#2,412 |
| 25. | Bessemer | 351 | 46,832(0.75%)#25 | 10,767,104(0.00%)#2,415 |
| 26. | Opelika | 326 | 46,832(0.70%)#26 | 10,767,104(0.00%)#2,531 |
| 27. | Talladega | 324 | 46,832(0.69%)#27 | 10,767,104(0.00%)#2,541 |
| 28. | Hueytown | 320 | 46,832(0.68%)#28 | 10,767,104(0.00%)#2,561 |
| 29. | Ozark | 318 | 46,832(0.68%)#29 | 10,767,104(0.00%)#2,573 |
| 30. | Lipscomb | 290 | 46,832(0.62%)#30 | 10,767,104(0.00%)#2,735 |
| 31. | Florence | 289 | 46,832(0.62%)#31 | 10,767,104(0.00%)#2,738 |
| 32. | Allgood | 287 | 46,832(0.61%)#32 | 10,767,104(0.00%)#2,759 |
| 33. | Boaz | 251 | 46,832(0.54%)#33 | 10,767,104(0.00%)#2,964 |
| 34. | Mobile | 236 | 46,832(0.50%)#34 | 10,767,104(0.00%)#3,048 |
| 35. | Center Point | 236 | 46,832(0.50%)#35 | 10,767,104(0.00%)#3,051 |
| 36. | Foley | 214 | 46,832(0.46%)#36 | 10,767,104(0.00%)#3,198 |
| 37. | Alexander City | 212 | 46,832(0.45%)#37 | 10,767,104(0.00%)#3,223 |
| 38. | Clio | 211 | 46,832(0.45%)#38 | 10,767,104(0.00%)#3,236 |
| 39. | Eufaula | 198 | 46,832(0.42%)#39 | 10,767,104(0.00%)#3,351 |
| 40. | Bon Secour | 185 | 46,832(0.40%)#40 | 10,767,104(0.00%)#3,495 |
| 41. | Montevallo | 182 | 46,832(0.39%)#41 | 10,767,104(0.00%)#3,528 |
| 42. | Phenix City | 170 | 46,832(0.36%)#42 | 10,767,104(0.00%)#3,671 |
| 43. | Cleveland | 168 | 46,832(0.36%)#43 | 10,767,104(0.00%)#3,706 |
| 44. | Good Hope | 166 | 46,832(0.35%)#44 | 10,767,104(0.00%)#3,736 |
| 45. | Tarrant | 160 | 46,832(0.34%)#45 | 10,767,104(0.00%)#3,805 |
| 46. | Oneonta | 156 | 46,832(0.33%)#46 | 10,767,104(0.00%)#3,844 |
| 47. | Gadsden | 154 | 46,832(0.33%)#47 | 10,767,104(0.00%)#3,873 |
| 48. | Cullman | 154 | 46,832(0.33%)#48 | 10,767,104(0.00%)#3,875 |
| 49. | Luverne | 153 | 46,832(0.33%)#49 | 10,767,104(0.00%)#3,896 |
| 50. | Millbrook | 151 | 46,832(0.32%)#50 | 10,767,104(0.00%)#3,912 |
| 51. | Prattville | 144 | 46,832(0.31%)#51 | 10,767,104(0.00%)#4,011 |
| 52. | Brighton | 144 | 46,832(0.31%)#52 | 10,767,104(0.00%)#4,025 |
| 53. | Enterprise | 143 | 46,832(0.31%)#53 | 10,767,104(0.00%)#4,031 |
| 54. | Scottsboro | 134 | 46,832(0.29%)#54 | 10,767,104(0.00%)#4,137 |
| 55. | Northport | 131 | 46,832(0.28%)#55 | 10,767,104(0.00%)#4,185 |
| 56. | Brundidge | 130 | 46,832(0.28%)#56 | 10,767,104(0.00%)#4,207 |
| 57. | Irondale | 128 | 46,832(0.27%)#57 | 10,767,104(0.00%)#4,227 |
| 58. | Demopolis | 120 | 46,832(0.26%)#58 | 10,767,104(0.00%)#4,377 |
| 59. | Crossville | 117 | 46,832(0.25%)#59 | 10,767,104(0.00%)#4,433 |
| 60. | Attalla | 111 | 46,832(0.24%)#60 | 10,767,104(0.00%)#4,539 |
| 61. | Pinson | 109 | 46,832(0.23%)#61 | 10,767,104(0.00%)#4,565 |
| 62. | Argo | 102 | 46,832(0.22%)#62 | 10,767,104(0.00%)#4,705 |
| 63. | Redland | 100 | 46,832(0.21%)#63 | 10,767,104(0.00%)#4,743 |
| 64. | Arab | 99 | 46,832(0.21%)#64 | 10,767,104(0.00%)#4,759 |
| 65. | Blountsville | 96 | 46,832(0.20%)#65 | 10,767,104(0.00%)#4,839 |
| 66. | Walnut Grove | 96 | 46,832(0.20%)#66 | 10,767,104(0.00%)#4,842 |
| 67. | Tillmans Corner | 91 | 46,832(0.19%)#67 | 10,767,104(0.00%)#4,928 |
| 68. | Moores Mill | 90 | 46,832(0.19%)#68 | 10,767,104(0.00%)#4,962 |
| 69. | Brook Highland | 88 | 46,832(0.19%)#69 | 10,767,104(0.00%)#5,012 |
| 70. | South Vinemont | 86 | 46,832(0.18%)#70 | 10,767,104(0.00%)#5,071 |
| 71. | Midfield | 84 | 46,832(0.18%)#71 | 10,767,104(0.00%)#5,118 |
| 72. | Steele | 84 | 46,832(0.18%)#72 | 10,767,104(0.00%)#5,127 |
| 73. | Hanceville | 83 | 46,832(0.18%)#73 | 10,767,104(0.00%)#5,144 |
| 74. | Trinity | 82 | 46,832(0.18%)#74 | 10,767,104(0.00%)#5,170 |
| 75. | Marbury | 80 | 46,832(0.17%)#75 | 10,767,104(0.00%)#5,220 |
| 76. | Union Springs | 78 | 46,832(0.17%)#76 | 10,767,104(0.00%)#5,271 |
| 77. | Malvern | 76 | 46,832(0.16%)#77 | 10,767,104(0.00%)#5,327 |
| 78. | Robertsdale | 73 | 46,832(0.16%)#78 | 10,767,104(0.00%)#5,400 |
| 79. | Hartselle | 70 | 46,832(0.15%)#79 | 10,767,104(0.00%)#5,494 |
| 80. | Saks | 70 | 46,832(0.15%)#80 | 10,767,104(0.00%)#5,499 |
| 81. | Guin | 70 | 46,832(0.15%)#81 | 10,767,104(0.00%)#5,512 |
| 82. | Clanton | 68 | 46,832(0.15%)#82 | 10,767,104(0.00%)#5,561 |
| 83. | Skyline | 68 | 46,832(0.15%)#83 | 10,767,104(0.00%)#5,578 |
| 84. | Mccalla | 67 | 46,832(0.14%)#84 | 10,767,104(0.00%)#5,588 |
| 85. | Jasper | 67 | 46,832(0.14%)#85 | 10,767,104(0.00%)#5,589 |
| 86. | Chelsea | 66 | 46,832(0.14%)#86 | 10,767,104(0.00%)#5,624 |
| 87. | Lake View | 66 | 46,832(0.14%)#87 | 10,767,104(0.00%)#5,634 |
| 88. | Pell City | 65 | 46,832(0.14%)#88 | 10,767,104(0.00%)#5,664 |
| 89. | Helena | 64 | 46,832(0.14%)#89 | 10,767,104(0.00%)#5,697 |
| 90. | Greenville | 62 | 46,832(0.13%)#90 | 10,767,104(0.00%)#5,774 |
| 91. | Sylvania | 62 | 46,832(0.13%)#91 | 10,767,104(0.00%)#5,789 |
| 92. | Sylacauga | 61 | 46,832(0.13%)#92 | 10,767,104(0.00%)#5,808 |
| 93. | Roanoke | 61 | 46,832(0.13%)#93 | 10,767,104(0.00%)#5,820 |
| 94. | Mount Olive Cdp Jefferson County | 59 | 46,832(0.13%)#94 | 10,767,104(0.00%)#5,894 |
| 95. | Gulf Shores | 58 | 46,832(0.12%)#95 | 10,767,104(0.00%)#5,924 |
| 96. | Snead | 58 | 46,832(0.12%)#96 | 10,767,104(0.00%)#5,940 |
| 97. | Bear Creek | 57 | 46,832(0.12%)#97 | 10,767,104(0.00%)#5,976 |
| 98. | Jacksonville | 56 | 46,832(0.12%)#98 | 10,767,104(0.00%)#5,996 |
| 99. | Lincoln | 55 | 46,832(0.12%)#99 | 10,767,104(0.00%)#6,044 |
| 100. | Guntersville | 54 | 46,832(0.12%)#100 | 10,767,104(0.00%)#6,092 |
Common Questions
What are the Top 10 Cities with the Most Immigrants from Mexico in Alabama?
Top 10 Cities with the Most Immigrants from Mexico in Alabama are:
#1
2,697
#2
2,449
#3
1,928
#4
1,466
#5
1,152
#6
872
#7
857
#8
837
#9
646
#10
623
What city has the Most Immigrants from Mexico in Alabama?
Huntsville has the Most Immigrants from Mexico in Alabama with 2,697.
What is the Total Immigrants from Mexico in the State of Alabama?
Total Immigrants from Mexico in Alabama is 46,832.
What is the Total Immigrants from Mexico in the United States?
Total Immigrants from Mexico in the United States is 10,767,104.