Cities with the Most Immigrants from Mexico in Mississippi
RELATED REPORTS & OPTIONS
Mexico
Mississippi
Compare Cities
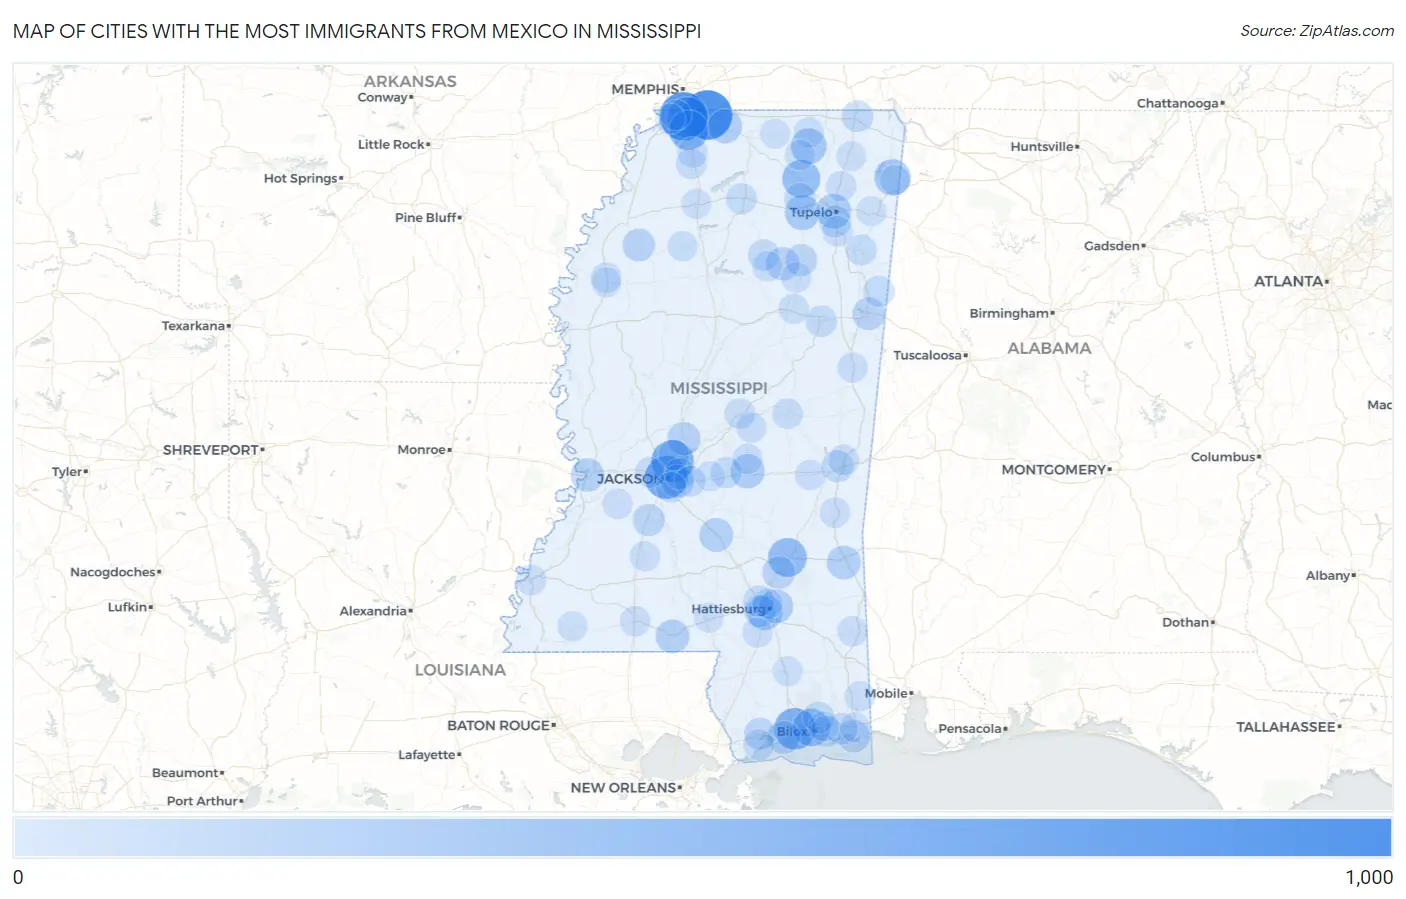
Map of Cities with the Most Immigrants from Mexico in Mississippi
0
1,000
Cities with the Most Immigrants from Mexico in Mississippi
| City | Mexico | vs State | vs National | |
| 1. | Olive Branch | 967 | 17,354(5.57%)#1 | 10,767,104(0.01%)#1,198 |
| 2. | Horn Lake | 893 | 17,354(5.15%)#2 | 10,767,104(0.01%)#1,272 |
| 3. | Jackson | 630 | 17,354(3.63%)#3 | 10,767,104(0.01%)#1,648 |
| 4. | Ridgeland | 607 | 17,354(3.50%)#4 | 10,767,104(0.01%)#1,688 |
| 5. | Gulfport | 566 | 17,354(3.26%)#5 | 10,767,104(0.01%)#1,765 |
| 6. | Southaven | 542 | 17,354(3.12%)#6 | 10,767,104(0.01%)#1,816 |
| 7. | Hernando | 467 | 17,354(2.69%)#7 | 10,767,104(0.00%)#2,010 |
| 8. | Laurel | 416 | 17,354(2.40%)#8 | 10,767,104(0.00%)#2,167 |
| 9. | New Albany | 384 | 17,354(2.21%)#9 | 10,767,104(0.00%)#2,285 |
| 10. | Biloxi | 367 | 17,354(2.11%)#10 | 10,767,104(0.00%)#2,354 |
| 11. | Belmont | 296 | 17,354(1.71%)#11 | 10,767,104(0.00%)#2,694 |
| 12. | Ripley | 272 | 17,354(1.57%)#12 | 10,767,104(0.00%)#2,840 |
| 13. | Hattiesburg | 240 | 17,354(1.38%)#13 | 10,767,104(0.00%)#3,026 |
| 14. | Pontotoc | 240 | 17,354(1.38%)#14 | 10,767,104(0.00%)#3,029 |
| 15. | Tupelo | 223 | 17,354(1.29%)#15 | 10,767,104(0.00%)#3,136 |
| 16. | Forest | 202 | 17,354(1.16%)#16 | 10,767,104(0.00%)#3,315 |
| 17. | Byhalia | 189 | 17,354(1.09%)#17 | 10,767,104(0.00%)#3,443 |
| 18. | Petal | 186 | 17,354(1.07%)#18 | 10,767,104(0.00%)#3,482 |
| 19. | Waynesboro | 179 | 17,354(1.03%)#19 | 10,767,104(0.00%)#3,571 |
| 20. | Magee | 178 | 17,354(1.03%)#20 | 10,767,104(0.00%)#3,585 |
| 21. | Tylertown | 174 | 17,354(1.00%)#21 | 10,767,104(0.00%)#3,628 |
| 22. | Vicksburg | 155 | 17,354(0.89%)#22 | 10,767,104(0.00%)#3,856 |
| 23. | Canton | 149 | 17,354(0.86%)#23 | 10,767,104(0.00%)#3,938 |
| 24. | Vardaman | 145 | 17,354(0.84%)#24 | 10,767,104(0.00%)#4,010 |
| 25. | Pearl | 144 | 17,354(0.83%)#25 | 10,767,104(0.00%)#4,013 |
| 26. | Long Beach | 139 | 17,354(0.80%)#26 | 10,767,104(0.00%)#4,086 |
| 27. | Columbus | 132 | 17,354(0.76%)#27 | 10,767,104(0.00%)#4,165 |
| 28. | Tutwiler | 126 | 17,354(0.73%)#28 | 10,767,104(0.00%)#4,269 |
| 29. | Ellisville | 125 | 17,354(0.72%)#29 | 10,767,104(0.00%)#4,287 |
| 30. | Pascagoula | 110 | 17,354(0.63%)#30 | 10,767,104(0.00%)#4,550 |
| 31. | Crystal Springs | 105 | 17,354(0.61%)#31 | 10,767,104(0.00%)#4,651 |
| 32. | Diamondhead | 92 | 17,354(0.53%)#32 | 10,767,104(0.00%)#4,911 |
| 33. | Houston | 92 | 17,354(0.53%)#33 | 10,767,104(0.00%)#4,914 |
| 34. | Meridian | 87 | 17,354(0.50%)#34 | 10,767,104(0.00%)#5,026 |
| 35. | Gautier | 85 | 17,354(0.49%)#35 | 10,767,104(0.00%)#5,080 |
| 36. | Verona | 83 | 17,354(0.48%)#36 | 10,767,104(0.00%)#5,146 |
| 37. | Corinth | 76 | 17,354(0.44%)#37 | 10,767,104(0.00%)#5,313 |
| 38. | West Hattiesburg | 76 | 17,354(0.44%)#38 | 10,767,104(0.00%)#5,315 |
| 39. | Latimer | 68 | 17,354(0.39%)#39 | 10,767,104(0.00%)#5,563 |
| 40. | Ecru | 67 | 17,354(0.39%)#40 | 10,767,104(0.00%)#5,609 |
| 41. | Pittsboro | 67 | 17,354(0.39%)#41 | 10,767,104(0.00%)#5,619 |
| 42. | Starkville | 66 | 17,354(0.38%)#42 | 10,767,104(0.00%)#5,622 |
| 43. | Rawls Springs | 64 | 17,354(0.37%)#43 | 10,767,104(0.00%)#5,719 |
| 44. | Ocean Springs | 63 | 17,354(0.36%)#44 | 10,767,104(0.00%)#5,734 |
| 45. | Morton | 56 | 17,354(0.32%)#45 | 10,767,104(0.00%)#6,017 |
| 46. | Oxford | 53 | 17,354(0.31%)#46 | 10,767,104(0.00%)#6,129 |
| 47. | Flowood | 53 | 17,354(0.31%)#47 | 10,767,104(0.00%)#6,136 |
| 48. | Caledonia | 50 | 17,354(0.29%)#48 | 10,767,104(0.00%)#6,313 |
| 49. | Waveland | 44 | 17,354(0.25%)#49 | 10,767,104(0.00%)#6,598 |
| 50. | Lakeview | 43 | 17,354(0.25%)#50 | 10,767,104(0.00%)#6,696 |
| 51. | Brandon | 42 | 17,354(0.24%)#51 | 10,767,104(0.00%)#6,704 |
| 52. | Amory | 42 | 17,354(0.24%)#52 | 10,767,104(0.00%)#6,722 |
| 53. | Marion | 36 | 17,354(0.21%)#53 | 10,767,104(0.00%)#7,067 |
| 54. | Eastabuchie | 36 | 17,354(0.21%)#54 | 10,767,104(0.00%)#7,095 |
| 55. | Madison | 30 | 17,354(0.17%)#55 | 10,767,104(0.00%)#7,439 |
| 56. | Clinton | 29 | 17,354(0.17%)#56 | 10,767,104(0.00%)#7,507 |
| 57. | Senatobia | 28 | 17,354(0.16%)#57 | 10,767,104(0.00%)#7,596 |
| 58. | Philadelphia | 26 | 17,354(0.15%)#58 | 10,767,104(0.00%)#7,748 |
| 59. | Redwater | 26 | 17,354(0.15%)#59 | 10,767,104(0.00%)#7,793 |
| 60. | Shannon | 24 | 17,354(0.14%)#60 | 10,767,104(0.00%)#7,954 |
| 61. | Coldwater | 24 | 17,354(0.14%)#61 | 10,767,104(0.00%)#7,966 |
| 62. | Utica | 24 | 17,354(0.14%)#62 | 10,767,104(0.00%)#7,974 |
| 63. | Natchez | 22 | 17,354(0.13%)#63 | 10,767,104(0.00%)#8,115 |
| 64. | Richland | 22 | 17,354(0.13%)#64 | 10,767,104(0.00%)#8,127 |
| 65. | Victoria | 22 | 17,354(0.13%)#65 | 10,767,104(0.00%)#8,170 |
| 66. | Glendale | 21 | 17,354(0.12%)#66 | 10,767,104(0.00%)#8,271 |
| 67. | Mccomb | 20 | 17,354(0.12%)#67 | 10,767,104(0.00%)#8,334 |
| 68. | Quitman | 20 | 17,354(0.12%)#68 | 10,767,104(0.00%)#8,392 |
| 69. | Hillsboro | 20 | 17,354(0.12%)#69 | 10,767,104(0.00%)#8,420 |
| 70. | Calhoun City | 19 | 17,354(0.11%)#70 | 10,767,104(0.00%)#8,519 |
| 71. | Leakesville | 18 | 17,354(0.10%)#71 | 10,767,104(0.00%)#8,592 |
| 72. | Macon | 17 | 17,354(0.10%)#72 | 10,767,104(0.00%)#8,737 |
| 73. | Falkner | 17 | 17,354(0.10%)#73 | 10,767,104(0.00%)#8,787 |
| 74. | Guntown | 16 | 17,354(0.09%)#74 | 10,767,104(0.00%)#8,886 |
| 75. | Renova | 16 | 17,354(0.09%)#75 | 10,767,104(0.00%)#8,919 |
| 76. | Beauregard | 13 | 17,354(0.07%)#76 | 10,767,104(0.00%)#9,372 |
| 77. | Woodland | 13 | 17,354(0.07%)#77 | 10,767,104(0.00%)#9,396 |
| 78. | Moss Point | 12 | 17,354(0.07%)#78 | 10,767,104(0.00%)#9,419 |
| 79. | Purvis | 11 | 17,354(0.06%)#79 | 10,767,104(0.00%)#9,654 |
| 80. | Hurley | 11 | 17,354(0.06%)#80 | 10,767,104(0.00%)#9,670 |
| 81. | Charleston | 10 | 17,354(0.06%)#81 | 10,767,104(0.00%)#9,808 |
| 82. | Blue Mountain | 10 | 17,354(0.06%)#82 | 10,767,104(0.00%)#9,866 |
| 83. | Maben | 10 | 17,354(0.06%)#83 | 10,767,104(0.00%)#9,869 |
| 84. | Standing Pine | 10 | 17,354(0.06%)#84 | 10,767,104(0.00%)#9,895 |
| 85. | Lynchburg | 9 | 17,354(0.05%)#85 | 10,767,104(0.00%)#10,017 |
| 86. | Chunky | 9 | 17,354(0.05%)#86 | 10,767,104(0.00%)#10,121 |
| 87. | Golden | 9 | 17,354(0.05%)#87 | 10,767,104(0.00%)#10,128 |
| 88. | Booneville | 8 | 17,354(0.05%)#88 | 10,767,104(0.00%)#10,164 |
| 89. | Batesville | 8 | 17,354(0.05%)#89 | 10,767,104(0.00%)#10,169 |
| 90. | Fulton | 8 | 17,354(0.05%)#90 | 10,767,104(0.00%)#10,187 |
| 91. | Columbia | 7 | 17,354(0.04%)#91 | 10,767,104(0.00%)#10,412 |
| 92. | Walls | 7 | 17,354(0.04%)#92 | 10,767,104(0.00%)#10,502 |
| 93. | Gloster | 7 | 17,354(0.04%)#93 | 10,767,104(0.00%)#10,507 |
| 94. | Pelahatchie | 6 | 17,354(0.03%)#94 | 10,767,104(0.00%)#10,741 |
| 95. | Cleveland | 5 | 17,354(0.03%)#95 | 10,767,104(0.00%)#10,909 |
| 96. | Wiggins | 5 | 17,354(0.03%)#96 | 10,767,104(0.00%)#10,938 |
| 97. | Kirkville | 5 | 17,354(0.03%)#97 | 10,767,104(0.00%)#11,130 |
| 98. | Winterville | 5 | 17,354(0.03%)#98 | 10,767,104(0.00%)#11,186 |
| 99. | Snow Lake Shores | 4 | 17,354(0.02%)#99 | 10,767,104(0.00%)#11,423 |
| 100. | Gulf Hills | 3 | 17,354(0.02%)#100 | 10,767,104(0.00%)#11,494 |
Common Questions
What are the Top 10 Cities with the Most Immigrants from Mexico in Mississippi?
Top 10 Cities with the Most Immigrants from Mexico in Mississippi are:
#1
967
#2
893
#3
630
#4
607
#5
566
#6
542
#7
467
#8
416
#9
384
#10
367
What city has the Most Immigrants from Mexico in Mississippi?
Olive Branch has the Most Immigrants from Mexico in Mississippi with 967.
What is the Total Immigrants from Mexico in the State of Mississippi?
Total Immigrants from Mexico in Mississippi is 17,354.
What is the Total Immigrants from Mexico in the United States?
Total Immigrants from Mexico in the United States is 10,767,104.