Cities with the Most Immigrants from Mexico in West Virginia
RELATED REPORTS & OPTIONS
Mexico
West Virginia
Compare Cities
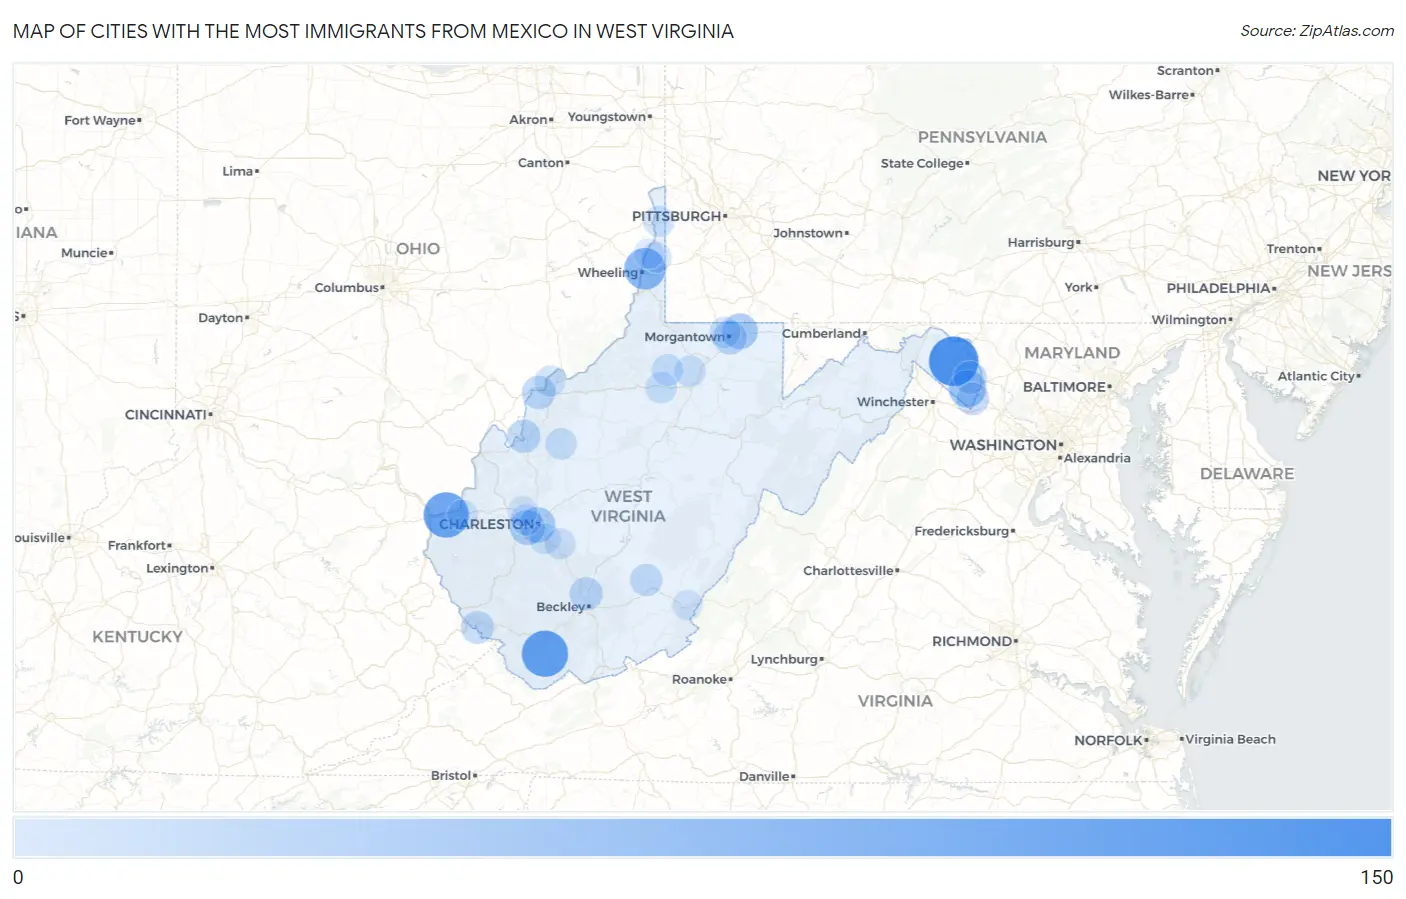
Map of Cities with the Most Immigrants from Mexico in West Virginia
0
150
Cities with the Most Immigrants from Mexico in West Virginia
| City | Mexico | vs State | vs National | |
| 1. | Martinsburg | 141 | 2,143(6.58%)#1 | 10,767,104(0.00%)#4,059 |
| 2. | Welch | 117 | 2,143(5.46%)#2 | 10,767,104(0.00%)#4,431 |
| 3. | Huntington | 110 | 2,143(5.13%)#3 | 10,767,104(0.00%)#4,546 |
| 4. | Wheeling | 80 | 2,143(3.73%)#4 | 10,767,104(0.00%)#5,205 |
| 5. | Charles Town | 51 | 2,143(2.38%)#5 | 10,767,104(0.00%)#6,254 |
| 6. | Charleston | 40 | 2,143(1.87%)#6 | 10,767,104(0.00%)#6,818 |
| 7. | Cheat Lake | 39 | 2,143(1.82%)#7 | 10,767,104(0.00%)#6,884 |
| 8. | South Charleston | 36 | 2,143(1.68%)#8 | 10,767,104(0.00%)#7,043 |
| 9. | Ranson Corporation | 28 | 2,143(1.31%)#9 | 10,767,104(0.00%)#7,605 |
| 10. | Morgantown | 27 | 2,143(1.26%)#10 | 10,767,104(0.00%)#7,659 |
| 11. | Ravenswood | 23 | 2,143(1.07%)#11 | 10,767,104(0.00%)#8,037 |
| 12. | Blennerhassett | 23 | 2,143(1.07%)#12 | 10,767,104(0.00%)#8,040 |
| 13. | Institute | 23 | 2,143(1.07%)#13 | 10,767,104(0.00%)#8,088 |
| 14. | Bradley | 21 | 2,143(0.98%)#14 | 10,767,104(0.00%)#8,268 |
| 15. | Shenandoah Junction | 20 | 2,143(0.93%)#15 | 10,767,104(0.00%)#8,409 |
| 16. | Matewan | 19 | 2,143(0.89%)#16 | 10,767,104(0.00%)#8,549 |
| 17. | Shannondale | 18 | 2,143(0.84%)#17 | 10,767,104(0.00%)#8,605 |
| 18. | Rupert | 15 | 2,143(0.70%)#18 | 10,767,104(0.00%)#9,043 |
| 19. | Shinnston | 10 | 2,143(0.47%)#19 | 10,767,104(0.00%)#9,816 |
| 20. | Salem | 10 | 2,143(0.47%)#20 | 10,767,104(0.00%)#9,830 |
| 21. | Wallace | 10 | 2,143(0.47%)#21 | 10,767,104(0.00%)#9,916 |
| 22. | Star City | 9 | 2,143(0.42%)#22 | 10,767,104(0.00%)#10,011 |
| 23. | Reedy | 9 | 2,143(0.42%)#23 | 10,767,104(0.00%)#10,132 |
| 24. | Weirton | 7 | 2,143(0.33%)#24 | 10,767,104(0.00%)#10,380 |
| 25. | Dunbar | 7 | 2,143(0.33%)#25 | 10,767,104(0.00%)#10,406 |
| 26. | Vienna | 6 | 2,143(0.28%)#26 | 10,767,104(0.00%)#10,662 |
| 27. | Marmet | 5 | 2,143(0.23%)#27 | 10,767,104(0.00%)#10,990 |
| 28. | East Bank | 5 | 2,143(0.23%)#28 | 10,767,104(0.00%)#11,063 |
| 29. | Barboursville | 4 | 2,143(0.19%)#29 | 10,767,104(0.00%)#11,218 |
| 30. | West Liberty | 3 | 2,143(0.14%)#30 | 10,767,104(0.00%)#11,549 |
| 31. | Cross Lanes | 1 | 2,143(0.05%)#31 | 10,767,104(0.00%)#12,201 |
| 32. | White Sulphur Springs | 1 | 2,143(0.05%)#32 | 10,767,104(0.00%)#12,242 |
| 33. | Windsor Heights | 1 | 2,143(0.05%)#33 | 10,767,104(0.00%)#12,339 |
1
2Common Questions
What are the Top 10 Cities with the Most Immigrants from Mexico in West Virginia?
Top 10 Cities with the Most Immigrants from Mexico in West Virginia are:
#1
141
#2
117
#3
110
#4
80
#5
51
#6
40
#7
39
#8
36
#9
27
#10
23
What city has the Most Immigrants from Mexico in West Virginia?
Martinsburg has the Most Immigrants from Mexico in West Virginia with 141.
What is the Total Immigrants from Mexico in the State of West Virginia?
Total Immigrants from Mexico in West Virginia is 2,143.
What is the Total Immigrants from Mexico in the United States?
Total Immigrants from Mexico in the United States is 10,767,104.