Ceres, CA Map & Demographics
Ceres Map
Ceres Overview
$24,176
PER CAPITA INCOME
$76,871
AVG FAMILY INCOME
$70,191
AVG HOUSEHOLD INCOME
32.9%
WAGE / INCOME GAP [ % ]
67.1¢/ $1
WAGE / INCOME GAP [ $ ]
$13,104
FAMILY INCOME DEFICIT
0.41
INEQUALITY / GINI INDEX
49,183
TOTAL POPULATION
25,810
MALE POPULATION
23,373
FEMALE POPULATION
110.43
MALES / 100 FEMALES
90.56
FEMALES / 100 MALES
32.3
MEDIAN AGE
4.0
AVG FAMILY SIZE
3.6
AVG HOUSEHOLD SIZE
21,785
LABOR FORCE [ PEOPLE ]
59.5%
PERCENT IN LABOR FORCE
10.5%
UNEMPLOYMENT RATE
Ceres Zip Codes
Ceres Area Codes
Income in Ceres
Income Overview in Ceres
Per Capita Income in Ceres is $24,176, while median incomes of families and households are $76,871 and $70,191 respectively.
| Characteristic | Number | Measure |
| Per Capita Income | 49,183 | $24,176 |
| Median Family Income | 10,779 | $76,871 |
| Mean Family Income | 10,779 | $87,502 |
| Median Household Income | 13,549 | $70,191 |
| Mean Household Income | 13,549 | $83,627 |
| Income Deficit | 10,779 | $13,104 |
| Wage / Income Gap (%) | 49,183 | 32.90% |
| Wage / Income Gap ($) | 49,183 | 67.10¢ per $1 |
| Gini / Inequality Index | 49,183 | 0.41 |
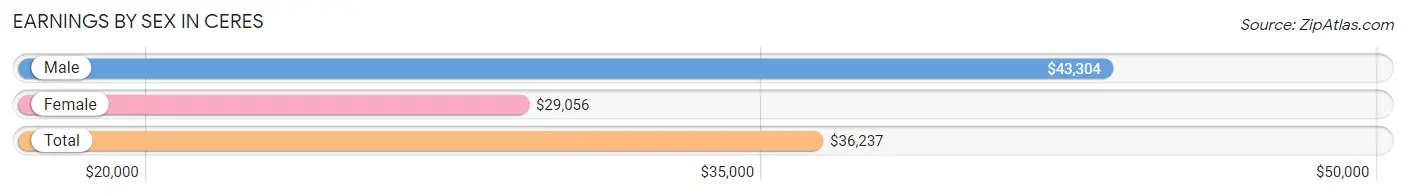
Earnings by Sex in Ceres
Average Earnings in Ceres are $36,237, $43,304 for men and $29,056 for women, a difference of 32.9%.
| Sex | Number | Average Earnings |
| Male | 12,604 (57.4%) | $43,304 |
| Female | 9,337 (42.6%) | $29,056 |
| Total | 21,941 (100.0%) | $36,237 |
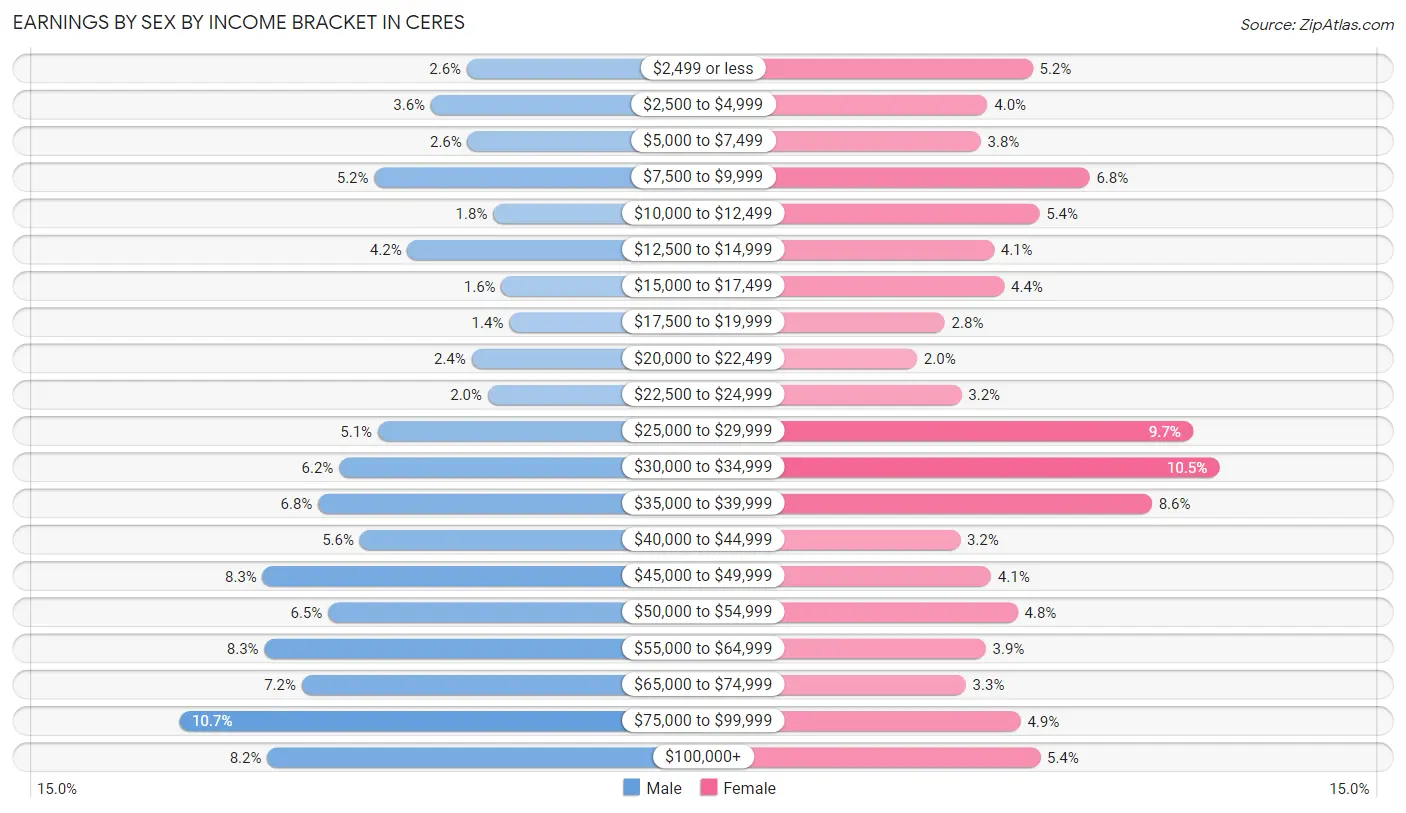
Earnings by Sex by Income Bracket in Ceres
The most common earnings brackets in Ceres are $75,000 to $99,999 for men (1,344 | 10.7%) and $30,000 to $34,999 for women (977 | 10.5%).
| Income | Male | Female |
| $2,499 or less | 324 (2.6%) | 487 (5.2%) |
| $2,500 to $4,999 | 451 (3.6%) | 369 (4.0%) |
| $5,000 to $7,499 | 322 (2.5%) | 351 (3.8%) |
| $7,500 to $9,999 | 651 (5.2%) | 637 (6.8%) |
| $10,000 to $12,499 | 231 (1.8%) | 505 (5.4%) |
| $12,500 to $14,999 | 534 (4.2%) | 386 (4.1%) |
| $15,000 to $17,499 | 202 (1.6%) | 413 (4.4%) |
| $17,500 to $19,999 | 174 (1.4%) | 257 (2.8%) |
| $20,000 to $22,499 | 307 (2.4%) | 184 (2.0%) |
| $22,500 to $24,999 | 250 (2.0%) | 301 (3.2%) |
| $25,000 to $29,999 | 639 (5.1%) | 908 (9.7%) |
| $30,000 to $34,999 | 777 (6.2%) | 977 (10.5%) |
| $35,000 to $39,999 | 851 (6.8%) | 800 (8.6%) |
| $40,000 to $44,999 | 703 (5.6%) | 297 (3.2%) |
| $45,000 to $49,999 | 1,048 (8.3%) | 378 (4.1%) |
| $50,000 to $54,999 | 815 (6.5%) | 448 (4.8%) |
| $55,000 to $64,999 | 1,041 (8.3%) | 364 (3.9%) |
| $65,000 to $74,999 | 909 (7.2%) | 312 (3.3%) |
| $75,000 to $99,999 | 1,344 (10.7%) | 456 (4.9%) |
| $100,000+ | 1,031 (8.2%) | 507 (5.4%) |
| Total | 12,604 (100.0%) | 9,337 (100.0%) |
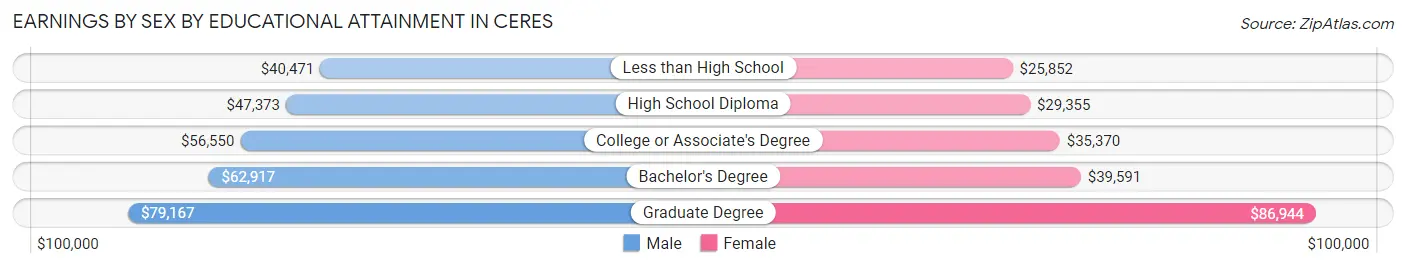
Earnings by Sex by Educational Attainment in Ceres
Average earnings in Ceres are $48,013 for men and $31,570 for women, a difference of 34.3%. Men with an educational attainment of graduate degree enjoy the highest average annual earnings of $79,167, while those with less than high school education earn the least with $40,471. Women with an educational attainment of graduate degree earn the most with the average annual earnings of $86,944, while those with less than high school education have the smallest earnings of $25,852.
| Educational Attainment | Male Income | Female Income |
| Less than High School | $40,471 | $25,852 |
| High School Diploma | $47,373 | $29,355 |
| College or Associate's Degree | $56,550 | $35,370 |
| Bachelor's Degree | $62,917 | $39,591 |
| Graduate Degree | $79,167 | $86,944 |
| Total | $48,013 | $31,570 |
Family Income in Ceres
Family Income Brackets in Ceres
According to the Ceres family income data, there are 2,156 families falling into the $100,000 to $149,999 income range, which is the most common income bracket and makes up 20.0% of all families. Conversely, the $10,000 to $14,999 income bracket is the least frequent group with only 172 families (1.6%) belonging to this category.
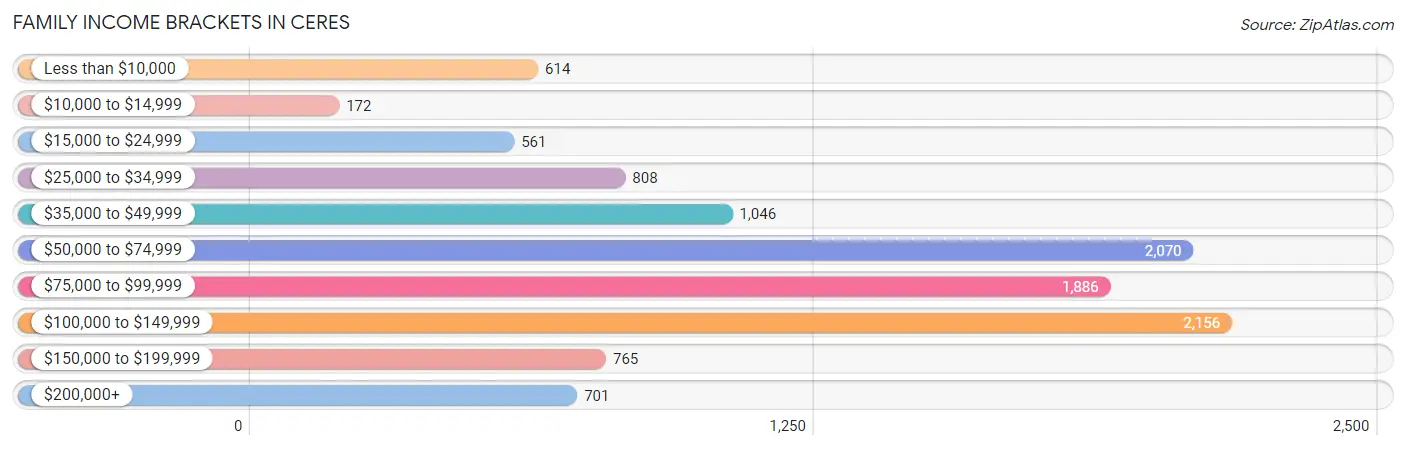
| Income Bracket | # Families | % Families |
| Less than $10,000 | 614 | 5.7% |
| $10,000 to $14,999 | 172 | 1.6% |
| $15,000 to $24,999 | 561 | 5.2% |
| $25,000 to $34,999 | 808 | 7.5% |
| $35,000 to $49,999 | 1,046 | 9.7% |
| $50,000 to $74,999 | 2,070 | 19.2% |
| $75,000 to $99,999 | 1,886 | 17.5% |
| $100,000 to $149,999 | 2,156 | 20.0% |
| $150,000 to $199,999 | 765 | 7.1% |
| $200,000+ | 701 | 6.5% |
Family Income by Famaliy Size in Ceres
6-person families (798 | 7.4%) account for the highest median family income in Ceres with $102,800 per family, while 2-person families (3,202 | 29.7%) have the highest median income of $33,059 per family member.
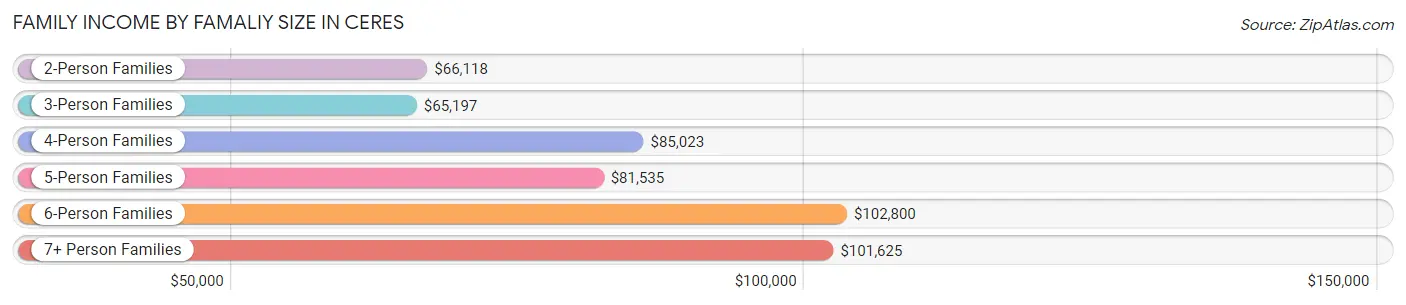
| Income Bracket | # Families | Median Income |
| 2-Person Families | 3,202 (29.7%) | $66,118 |
| 3-Person Families | 2,279 (21.1%) | $65,197 |
| 4-Person Families | 2,198 (20.4%) | $85,023 |
| 5-Person Families | 1,481 (13.7%) | $81,535 |
| 6-Person Families | 798 (7.4%) | $102,800 |
| 7+ Person Families | 821 (7.6%) | $101,625 |
| Total | 10,779 (100.0%) | $76,871 |
Family Income by Number of Earners in Ceres
The median family income in Ceres is $76,871, with families comprising 3+ earners (1,889) having the highest median family income of $118,925, while families with no earners (1,384) have the lowest median family income of $29,044, accounting for 17.5% and 12.8% of families, respectively.
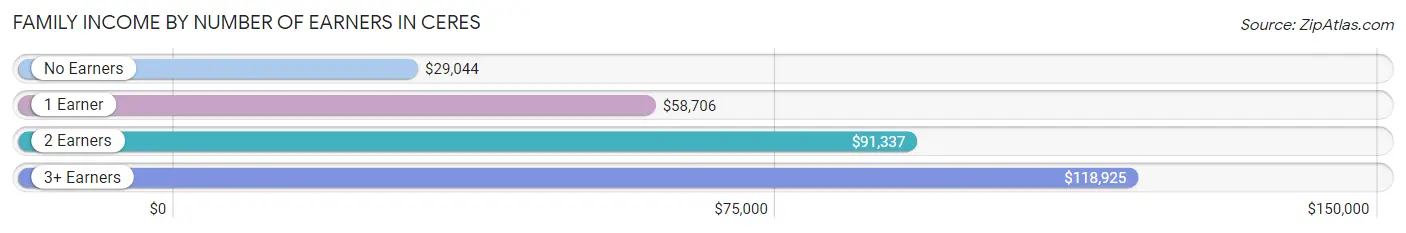
| Number of Earners | # Families | Median Income |
| No Earners | 1,384 (12.8%) | $29,044 |
| 1 Earner | 3,854 (35.7%) | $58,706 |
| 2 Earners | 3,652 (33.9%) | $91,337 |
| 3+ Earners | 1,889 (17.5%) | $118,925 |
| Total | 10,779 (100.0%) | $76,871 |
Household Income in Ceres
Household Income Brackets in Ceres
With 2,574 households falling in the category, the $50,000 to $74,999 income range is the most frequent in Ceres, accounting for 19.0% of all households. In contrast, only 623 households (4.6%) fall into the less than $10,000 income bracket, making it the least populous group.
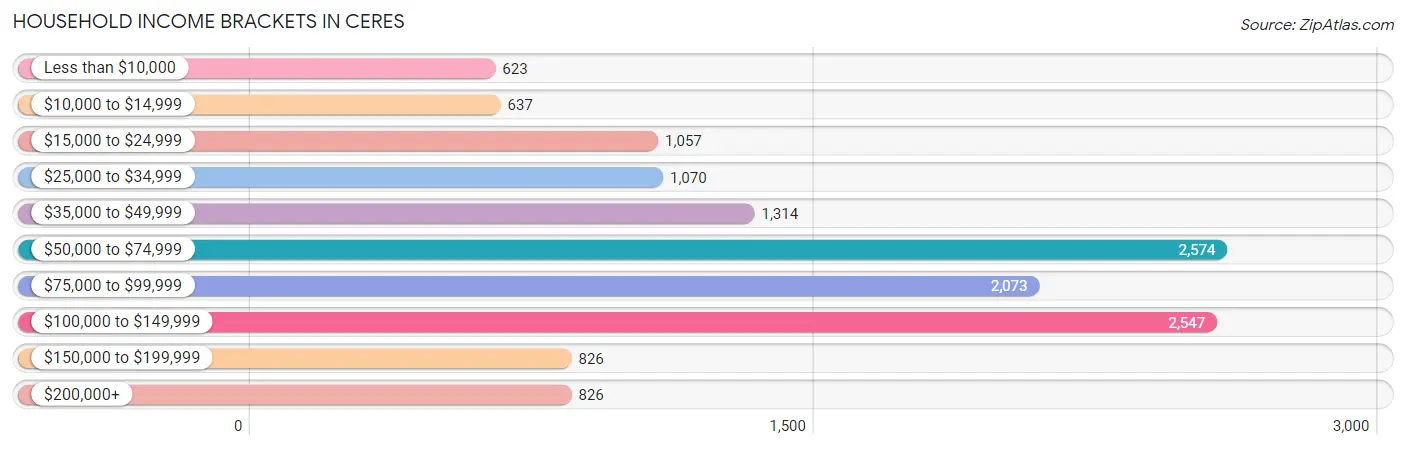
| Income Bracket | # Households | % Households |
| Less than $10,000 | 623 | 4.6% |
| $10,000 to $14,999 | 637 | 4.7% |
| $15,000 to $24,999 | 1,057 | 7.8% |
| $25,000 to $34,999 | 1,070 | 7.9% |
| $35,000 to $49,999 | 1,314 | 9.7% |
| $50,000 to $74,999 | 2,574 | 19.0% |
| $75,000 to $99,999 | 2,073 | 15.3% |
| $100,000 to $149,999 | 2,547 | 18.8% |
| $150,000 to $199,999 | 826 | 6.1% |
| $200,000+ | 826 | 6.1% |
Household Income by Householder Age in Ceres
The median household income in Ceres is $70,191, with the highest median household income of $87,407 found in the 45 to 64 years age bracket for the primary householder. A total of 4,624 households (34.1%) fall into this category. Meanwhile, the 15 to 24 years age bracket for the primary householder has the lowest median household income of $0, with 288 households (2.1%) in this group.
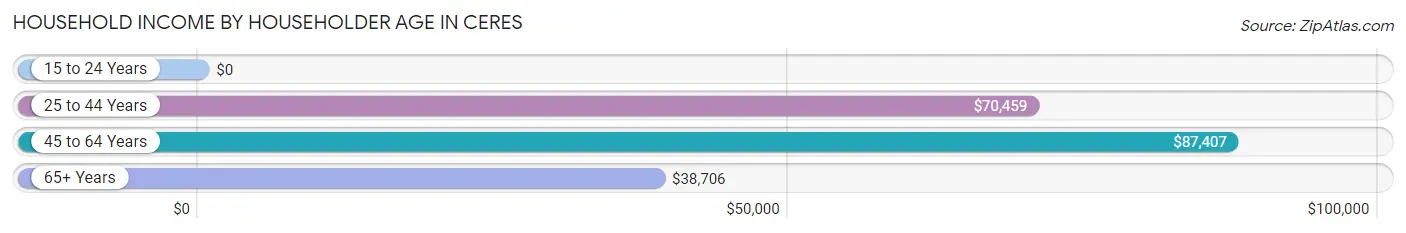
| Income Bracket | # Households | Median Income |
| 15 to 24 Years | 288 (2.1%) | $0 |
| 25 to 44 Years | 5,395 (39.8%) | $70,459 |
| 45 to 64 Years | 4,624 (34.1%) | $87,407 |
| 65+ Years | 3,242 (23.9%) | $38,706 |
| Total | 13,549 (100.0%) | $70,191 |
Poverty in Ceres
Income Below Poverty by Sex and Age in Ceres
With 15.2% poverty level for males and 15.4% for females among the residents of Ceres, 15 year old males and 18 to 24 year old females are the most vulnerable to poverty, with 59 males (36.4%) and 453 females (23.9%) in their respective age groups living below the poverty level.
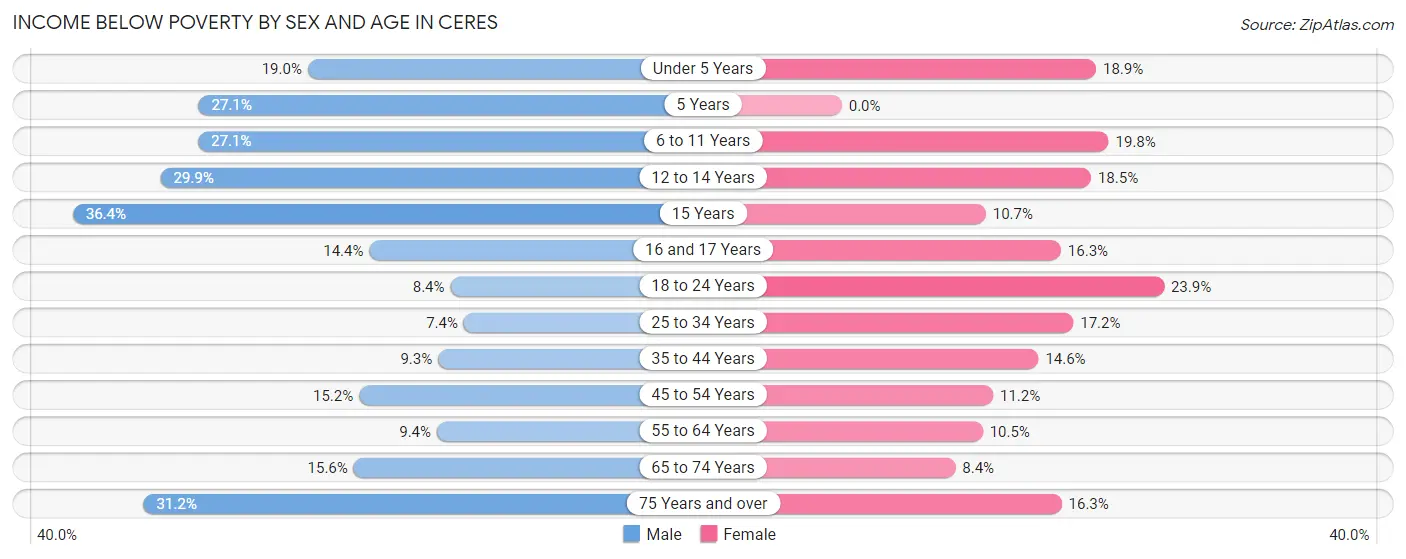
| Age Bracket | Male | Female |
| Under 5 Years | 295 (19.0%) | 316 (18.9%) |
| 5 Years | 130 (27.1%) | 0 (0.0%) |
| 6 to 11 Years | 714 (27.1%) | 478 (19.8%) |
| 12 to 14 Years | 422 (29.9%) | 234 (18.5%) |
| 15 Years | 59 (36.4%) | 54 (10.7%) |
| 16 and 17 Years | 115 (14.4%) | 110 (16.3%) |
| 18 to 24 Years | 253 (8.4%) | 453 (23.9%) |
| 25 to 34 Years | 300 (7.4%) | 576 (17.2%) |
| 35 to 44 Years | 330 (9.3%) | 478 (14.6%) |
| 45 to 54 Years | 321 (15.2%) | 301 (11.2%) |
| 55 to 64 Years | 242 (9.4%) | 256 (10.5%) |
| 65 to 74 Years | 264 (15.6%) | 138 (8.4%) |
| 75 Years and over | 409 (31.2%) | 181 (16.3%) |
| Total | 3,854 (15.2%) | 3,575 (15.4%) |
Income Above Poverty by Sex and Age in Ceres
According to the poverty statistics in Ceres, males aged 25 to 34 years and females aged 5 years are the age groups that are most secure financially, with 92.6% of males and 100.0% of females in these age groups living above the poverty line.
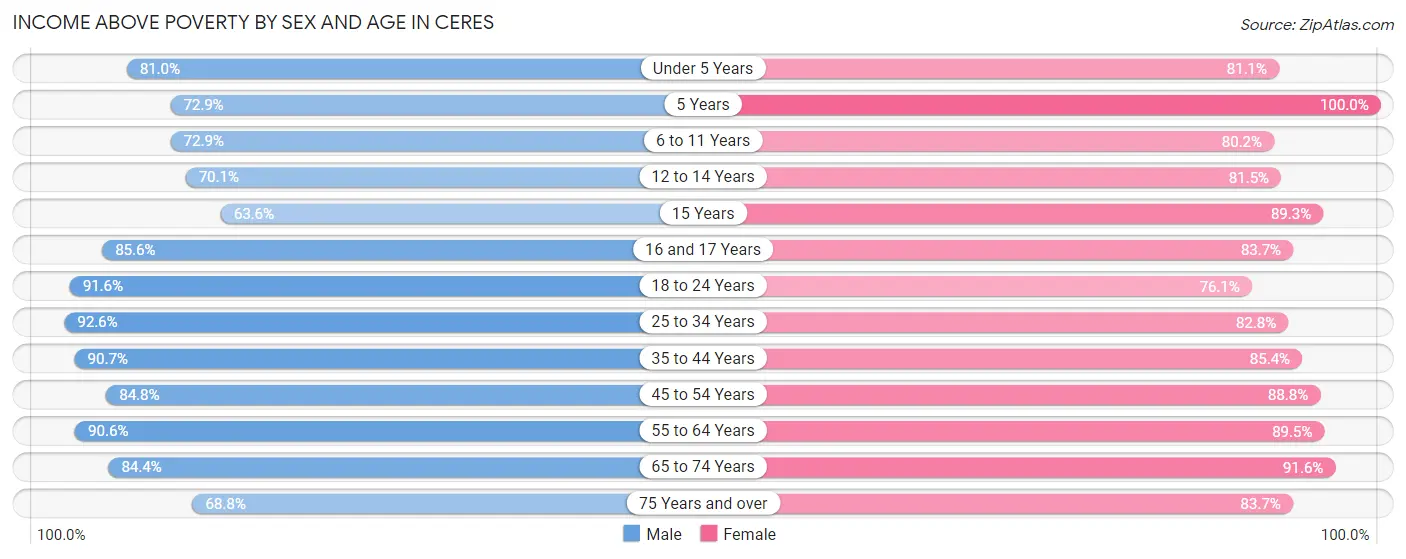
| Age Bracket | Male | Female |
| Under 5 Years | 1,259 (81.0%) | 1,358 (81.1%) |
| 5 Years | 350 (72.9%) | 236 (100.0%) |
| 6 to 11 Years | 1,919 (72.9%) | 1,935 (80.2%) |
| 12 to 14 Years | 989 (70.1%) | 1,031 (81.5%) |
| 15 Years | 103 (63.6%) | 451 (89.3%) |
| 16 and 17 Years | 683 (85.6%) | 566 (83.7%) |
| 18 to 24 Years | 2,764 (91.6%) | 1,441 (76.1%) |
| 25 to 34 Years | 3,757 (92.6%) | 2,775 (82.8%) |
| 35 to 44 Years | 3,220 (90.7%) | 2,795 (85.4%) |
| 45 to 54 Years | 1,795 (84.8%) | 2,380 (88.8%) |
| 55 to 64 Years | 2,334 (90.6%) | 2,192 (89.5%) |
| 65 to 74 Years | 1,432 (84.4%) | 1,499 (91.6%) |
| 75 Years and over | 903 (68.8%) | 928 (83.7%) |
| Total | 21,508 (84.8%) | 19,587 (84.6%) |
Income Below Poverty Among Married-Couple Families in Ceres
The poverty statistics for married-couple families in Ceres show that 7.8% or 540 of the total 6,935 families live below the poverty line. Families with 3 or 4 children have the highest poverty rate of 13.7%, comprising of 170 families. On the other hand, families with no children have the lowest poverty rate of 5.8%, which includes 188 families.
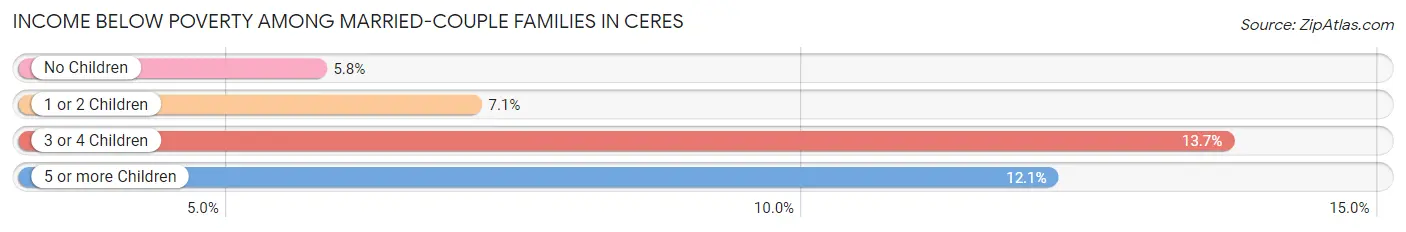
| Children | Above Poverty | Below Poverty |
| No Children | 3,069 (94.2%) | 188 (5.8%) |
| 1 or 2 Children | 2,100 (92.9%) | 161 (7.1%) |
| 3 or 4 Children | 1,074 (86.3%) | 170 (13.7%) |
| 5 or more Children | 152 (87.9%) | 21 (12.1%) |
| Total | 6,395 (92.2%) | 540 (7.8%) |
Income Below Poverty Among Single-Parent Households in Ceres
According to the poverty data in Ceres, 11.9% or 146 single-father households and 27.2% or 711 single-mother households are living below the poverty line. Among single-father households, those with 3 or 4 children have the highest poverty rate, with 23 households (15.8%) experiencing poverty. Likewise, among single-mother households, those with 5 or more children have the highest poverty rate, with 84 households (100.0%) falling below the poverty line.
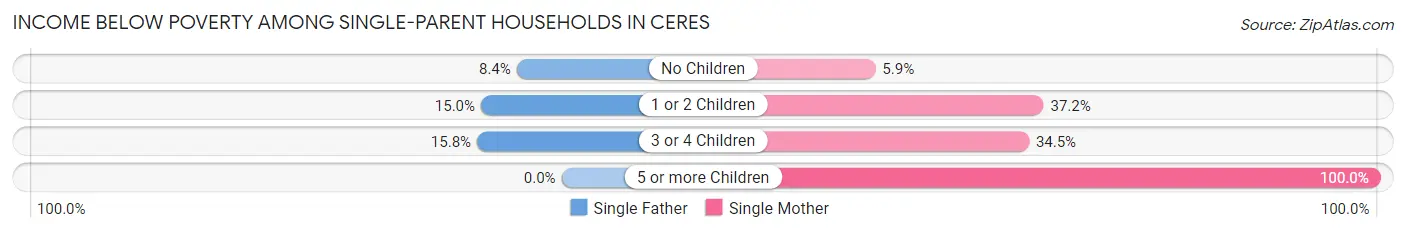
| Children | Single Father | Single Mother |
| No Children | 50 (8.4%) | 58 (5.9%) |
| 1 or 2 Children | 73 (15.0%) | 481 (37.2%) |
| 3 or 4 Children | 23 (15.8%) | 88 (34.5%) |
| 5 or more Children | 0 (0.0%) | 84 (100.0%) |
| Total | 146 (11.9%) | 711 (27.2%) |
Income Below Poverty Among Married-Couple vs Single-Parent Households in Ceres
The poverty data for Ceres shows that 540 of the married-couple family households (7.8%) and 857 of the single-parent households (22.3%) are living below the poverty level. Within the married-couple family households, those with 3 or 4 children have the highest poverty rate, with 170 households (13.7%) falling below the poverty line. Among the single-parent households, those with 5 or more children have the highest poverty rate, with 84 household (100.0%) living below poverty.
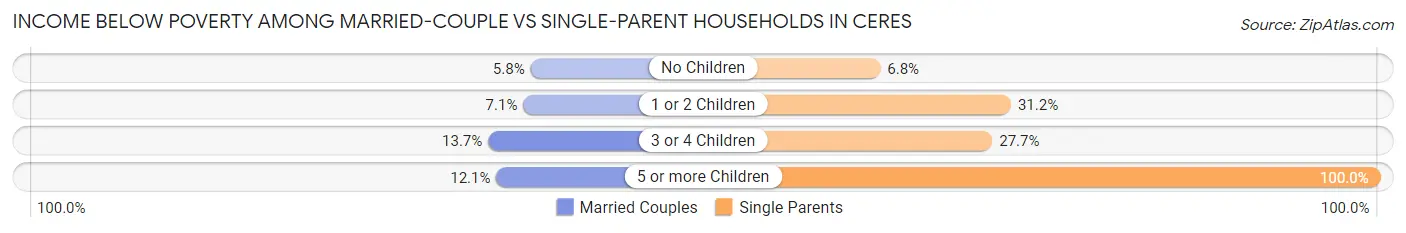
| Children | Married-Couple Families | Single-Parent Households |
| No Children | 188 (5.8%) | 108 (6.8%) |
| 1 or 2 Children | 161 (7.1%) | 554 (31.2%) |
| 3 or 4 Children | 170 (13.7%) | 111 (27.7%) |
| 5 or more Children | 21 (12.1%) | 84 (100.0%) |
| Total | 540 (7.8%) | 857 (22.3%) |
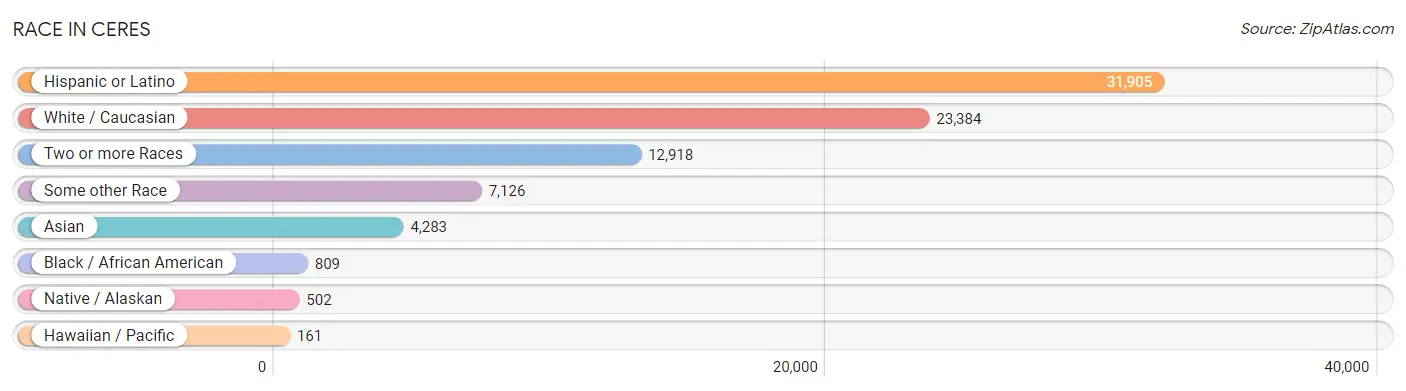
Race in Ceres
The most populous races in Ceres are Hispanic or Latino (31,905 | 64.9%), White / Caucasian (23,384 | 47.5%), and Two or more Races (12,918 | 26.3%).
| Race | # Population | % Population |
| Asian | 4,283 | 8.7% |
| Black / African American | 809 | 1.6% |
| Hawaiian / Pacific | 161 | 0.3% |
| Hispanic or Latino | 31,905 | 64.9% |
| Native / Alaskan | 502 | 1.0% |
| White / Caucasian | 23,384 | 47.5% |
| Two or more Races | 12,918 | 26.3% |
| Some other Race | 7,126 | 14.5% |
| Total | 49,183 | 100.0% |
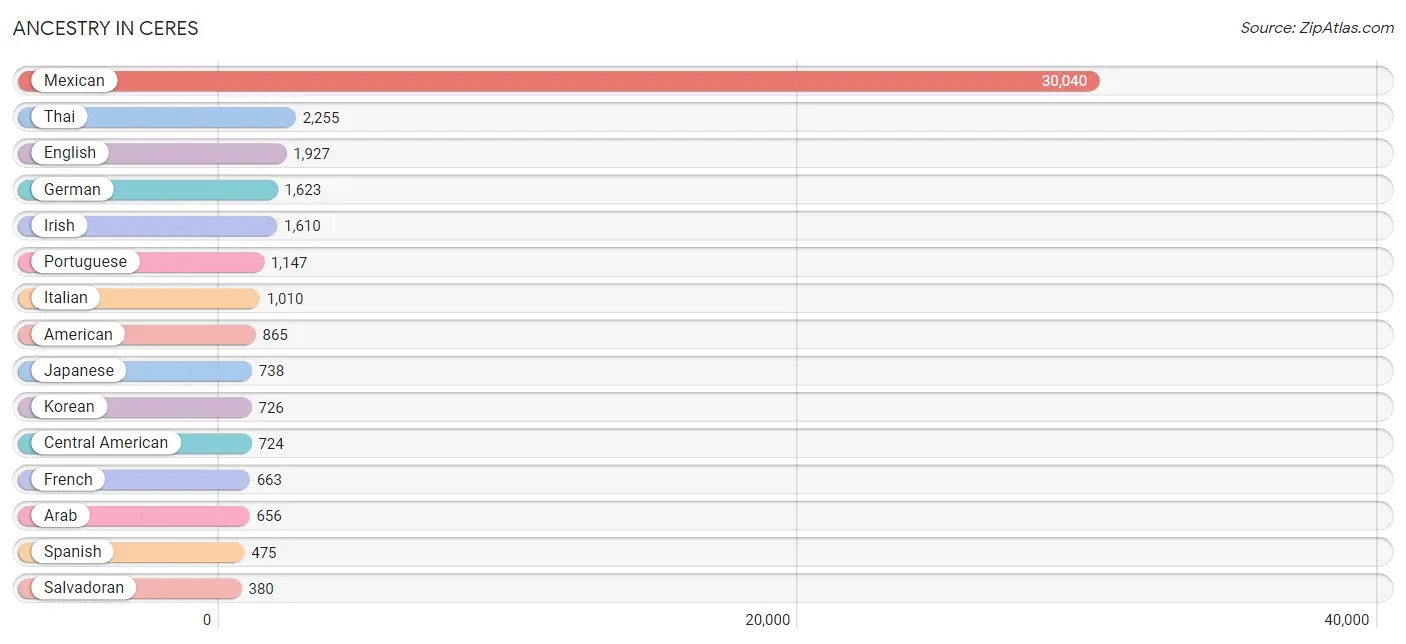
Ancestry in Ceres
The most populous ancestries reported in Ceres are Mexican (30,040 | 61.1%), Thai (2,255 | 4.6%), English (1,927 | 3.9%), German (1,623 | 3.3%), and Irish (1,610 | 3.3%), together accounting for 76.1% of all Ceres residents.
| Ancestry | # Population | % Population |
| African | 232 | 0.5% |
| American | 865 | 1.8% |
| Apache | 32 | 0.1% |
| Arab | 656 | 1.3% |
| Assyrian / Chaldean / Syriac | 92 | 0.2% |
| Australian | 31 | 0.1% |
| Bangladeshi | 117 | 0.2% |
| Basque | 7 | 0.0% |
| Bhutanese | 98 | 0.2% |
| Blackfeet | 4 | 0.0% |
| British | 54 | 0.1% |
| Burmese | 154 | 0.3% |
| Canadian | 15 | 0.0% |
| Celtic | 7 | 0.0% |
| Central American | 724 | 1.5% |
| Central American Indian | 3 | 0.0% |
| Cherokee | 74 | 0.2% |
| Choctaw | 91 | 0.2% |
| Colombian | 18 | 0.0% |
| Danish | 263 | 0.5% |
| Dominican | 21 | 0.0% |
| Dutch | 292 | 0.6% |
| Dutch West Indian | 17 | 0.0% |
| Eastern European | 25 | 0.1% |
| Ecuadorian | 8 | 0.0% |
| English | 1,927 | 3.9% |
| European | 284 | 0.6% |
| Finnish | 6 | 0.0% |
| French | 663 | 1.3% |
| French Canadian | 150 | 0.3% |
| German | 1,623 | 3.3% |
| Ghanaian | 41 | 0.1% |
| Greek | 70 | 0.1% |
| Guatemalan | 129 | 0.3% |
| Hopi | 8 | 0.0% |
| Indian (Asian) | 374 | 0.8% |
| Iranian | 11 | 0.0% |
| Irish | 1,610 | 3.3% |
| Italian | 1,010 | 2.1% |
| Jamaican | 28 | 0.1% |
| Japanese | 738 | 1.5% |
| Korean | 726 | 1.5% |
| Malaysian | 179 | 0.4% |
| Mexican | 30,040 | 61.1% |
| Mexican American Indian | 330 | 0.7% |
| Native Hawaiian | 72 | 0.2% |
| Navajo | 23 | 0.1% |
| Nepalese | 121 | 0.3% |
| Nicaraguan | 212 | 0.4% |
| Northern European | 172 | 0.4% |
| Norwegian | 147 | 0.3% |
| Osage | 11 | 0.0% |
| Ottawa | 6 | 0.0% |
| Panamanian | 3 | 0.0% |
| Pennsylvania German | 18 | 0.0% |
| Peruvian | 69 | 0.1% |
| Polish | 66 | 0.1% |
| Portuguese | 1,147 | 2.3% |
| Potawatomi | 2 | 0.0% |
| Pueblo | 16 | 0.0% |
| Puerto Rican | 124 | 0.3% |
| Russian | 86 | 0.2% |
| Salvadoran | 380 | 0.8% |
| Samoan | 21 | 0.0% |
| Scandinavian | 92 | 0.2% |
| Scotch-Irish | 104 | 0.2% |
| Scottish | 167 | 0.3% |
| Seminole | 5 | 0.0% |
| Sioux | 92 | 0.2% |
| South American | 95 | 0.2% |
| Spaniard | 113 | 0.2% |
| Spanish | 475 | 1.0% |
| Sri Lankan | 33 | 0.1% |
| Subsaharan African | 273 | 0.6% |
| Swedish | 162 | 0.3% |
| Swiss | 11 | 0.0% |
| Thai | 2,255 | 4.6% |
| Turkish | 35 | 0.1% |
| Ukrainian | 9 | 0.0% |
| Welsh | 128 | 0.3% |
| Yaqui | 36 | 0.1% | View All 81 Rows |
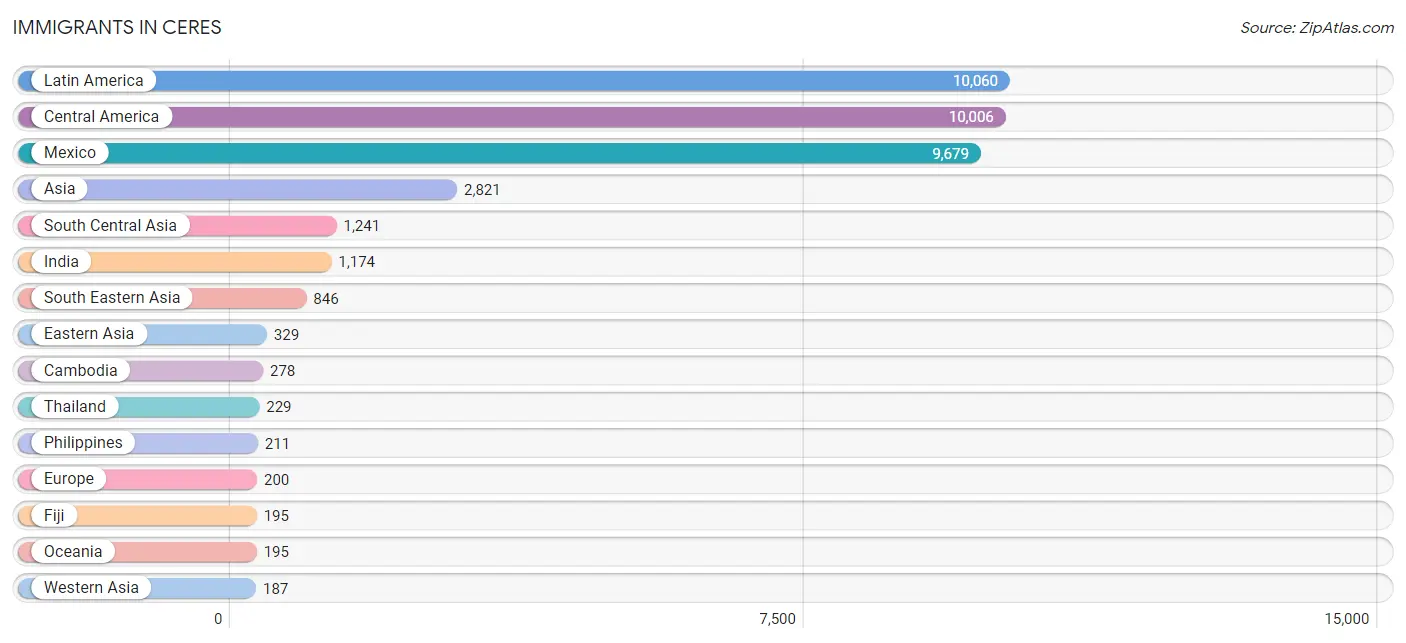
Immigrants in Ceres
The most numerous immigrant groups reported in Ceres came from Latin America (10,060 | 20.4%), Central America (10,006 | 20.3%), Mexico (9,679 | 19.7%), Asia (2,821 | 5.7%), and South Central Asia (1,241 | 2.5%), together accounting for 68.7% of all Ceres residents.
| Immigration Origin | # Population | % Population |
| Africa | 128 | 0.3% |
| Asia | 2,821 | 5.7% |
| Azores | 36 | 0.1% |
| Cambodia | 278 | 0.6% |
| Canada | 11 | 0.0% |
| Caribbean | 10 | 0.0% |
| Central America | 10,006 | 20.3% |
| China | 177 | 0.4% |
| Colombia | 5 | 0.0% |
| Dominican Republic | 10 | 0.0% |
| Eastern Africa | 71 | 0.1% |
| Eastern Asia | 329 | 0.7% |
| Eastern Europe | 40 | 0.1% |
| El Salvador | 171 | 0.4% |
| England | 22 | 0.0% |
| Europe | 200 | 0.4% |
| Fiji | 195 | 0.4% |
| France | 24 | 0.1% |
| Germany | 11 | 0.0% |
| Ghana | 41 | 0.1% |
| Greece | 5 | 0.0% |
| Guatemala | 52 | 0.1% |
| Hong Kong | 36 | 0.1% |
| India | 1,174 | 2.4% |
| Iraq | 54 | 0.1% |
| Italy | 43 | 0.1% |
| Kazakhstan | 43 | 0.1% |
| Korea | 152 | 0.3% |
| Kuwait | 12 | 0.0% |
| Laos | 81 | 0.2% |
| Latin America | 10,060 | 20.4% |
| Mexico | 9,679 | 19.7% |
| Middle Africa | 16 | 0.0% |
| Nicaragua | 104 | 0.2% |
| Northern Europe | 22 | 0.0% |
| Oceania | 195 | 0.4% |
| Pakistan | 13 | 0.0% |
| Peru | 39 | 0.1% |
| Philippines | 211 | 0.4% |
| Poland | 11 | 0.0% |
| Portugal | 55 | 0.1% |
| Russia | 20 | 0.0% |
| South America | 44 | 0.1% |
| South Central Asia | 1,241 | 2.5% |
| South Eastern Asia | 846 | 1.7% |
| Southern Europe | 103 | 0.2% |
| Sri Lanka | 11 | 0.0% |
| Taiwan | 42 | 0.1% |
| Thailand | 229 | 0.5% |
| Ukraine | 9 | 0.0% |
| Vietnam | 47 | 0.1% |
| Western Africa | 41 | 0.1% |
| Western Asia | 187 | 0.4% |
| Western Europe | 35 | 0.1% |
| Yemen | 121 | 0.3% | View All 55 Rows |
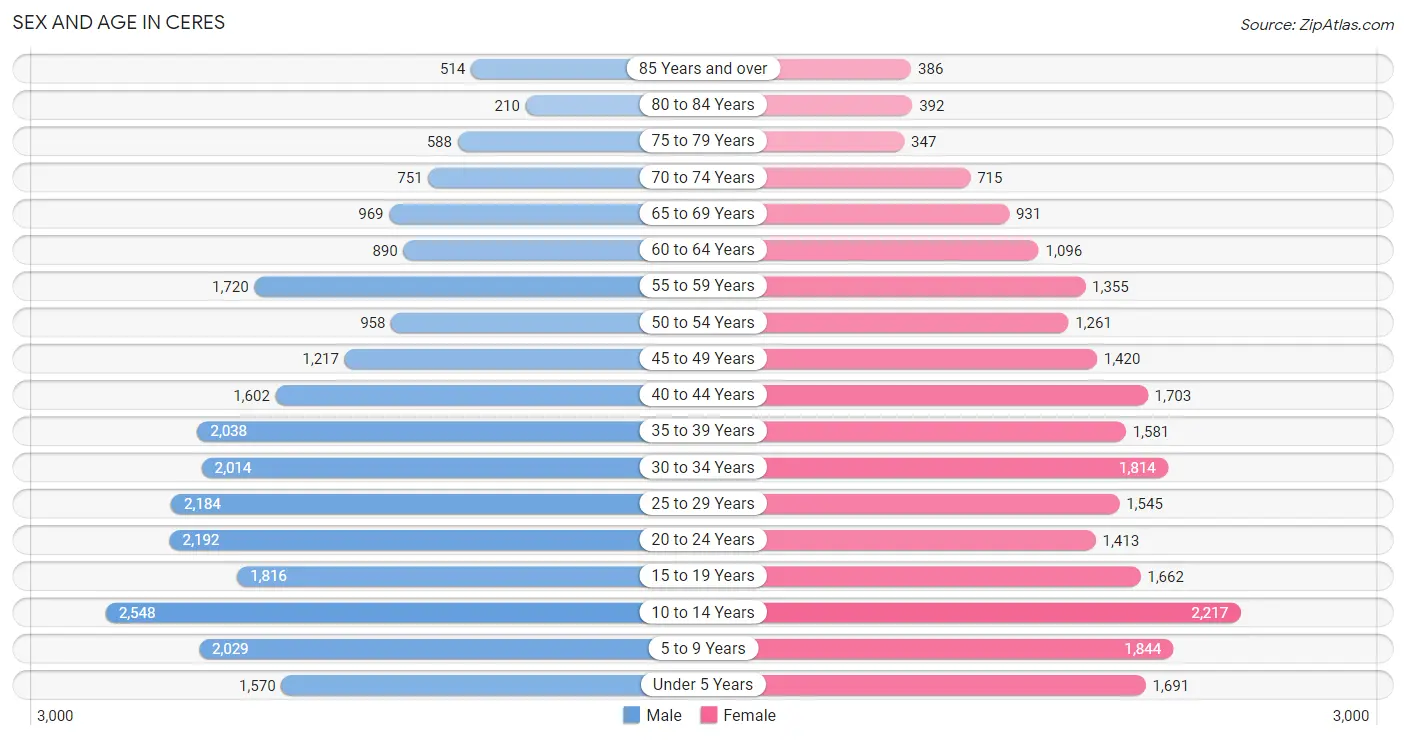
Sex and Age in Ceres
Sex and Age in Ceres
The most populous age groups in Ceres are 10 to 14 Years (2,548 | 9.9%) for men and 10 to 14 Years (2,217 | 9.5%) for women.
| Age Bracket | Male | Female |
| Under 5 Years | 1,570 (6.1%) | 1,691 (7.2%) |
| 5 to 9 Years | 2,029 (7.9%) | 1,844 (7.9%) |
| 10 to 14 Years | 2,548 (9.9%) | 2,217 (9.5%) |
| 15 to 19 Years | 1,816 (7.0%) | 1,662 (7.1%) |
| 20 to 24 Years | 2,192 (8.5%) | 1,413 (6.0%) |
| 25 to 29 Years | 2,184 (8.5%) | 1,545 (6.6%) |
| 30 to 34 Years | 2,014 (7.8%) | 1,814 (7.8%) |
| 35 to 39 Years | 2,038 (7.9%) | 1,581 (6.8%) |
| 40 to 44 Years | 1,602 (6.2%) | 1,703 (7.3%) |
| 45 to 49 Years | 1,217 (4.7%) | 1,420 (6.1%) |
| 50 to 54 Years | 958 (3.7%) | 1,261 (5.4%) |
| 55 to 59 Years | 1,720 (6.7%) | 1,355 (5.8%) |
| 60 to 64 Years | 890 (3.5%) | 1,096 (4.7%) |
| 65 to 69 Years | 969 (3.7%) | 931 (4.0%) |
| 70 to 74 Years | 751 (2.9%) | 715 (3.1%) |
| 75 to 79 Years | 588 (2.3%) | 347 (1.5%) |
| 80 to 84 Years | 210 (0.8%) | 392 (1.7%) |
| 85 Years and over | 514 (2.0%) | 386 (1.7%) |
| Total | 25,810 (100.0%) | 23,373 (100.0%) |
Families and Households in Ceres
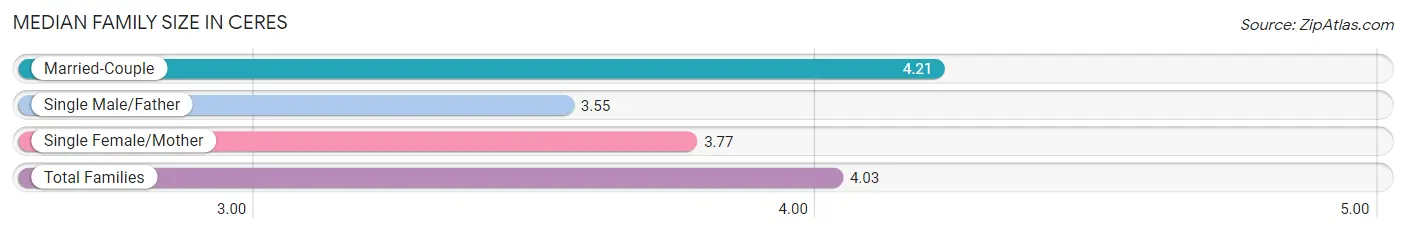
Median Family Size in Ceres
The median family size in Ceres is 4.03 persons per family, with married-couple families (6,935 | 64.3%) accounting for the largest median family size of 4.21 persons per family. On the other hand, single male/father families (1,231 | 11.4%) represent the smallest median family size with 3.55 persons per family.
| Family Type | # Families | Family Size |
| Married-Couple | 6,935 (64.3%) | 4.21 |
| Single Male/Father | 1,231 (11.4%) | 3.55 |
| Single Female/Mother | 2,613 (24.2%) | 3.77 |
| Total Families | 10,779 (100.0%) | 4.03 |
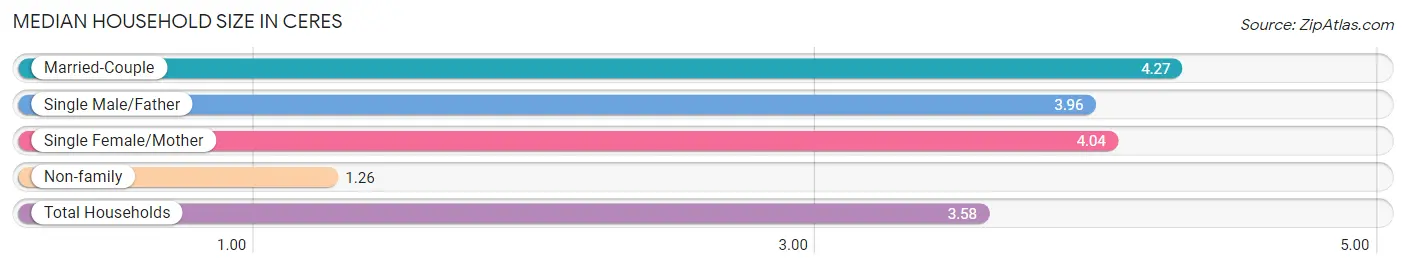
Median Household Size in Ceres
The median household size in Ceres is 3.58 persons per household, with married-couple households (6,935 | 51.2%) accounting for the largest median household size of 4.27 persons per household. non-family households (2,770 | 20.4%) represent the smallest median household size with 1.26 persons per household.
| Household Type | # Households | Household Size |
| Married-Couple | 6,935 (51.2%) | 4.27 |
| Single Male/Father | 1,231 (9.1%) | 3.96 |
| Single Female/Mother | 2,613 (19.3%) | 4.04 |
| Non-family | 2,770 (20.4%) | 1.26 |
| Total Households | 13,549 (100.0%) | 3.58 |
Household Size by Marriage Status in Ceres
Out of a total of 13,549 households in Ceres, 10,779 (79.6%) are family households, while 2,770 (20.4%) are nonfamily households. The most numerous type of family households are 2-person households, comprising 2,845, and the most common type of nonfamily households are 1-person households, comprising 2,250.
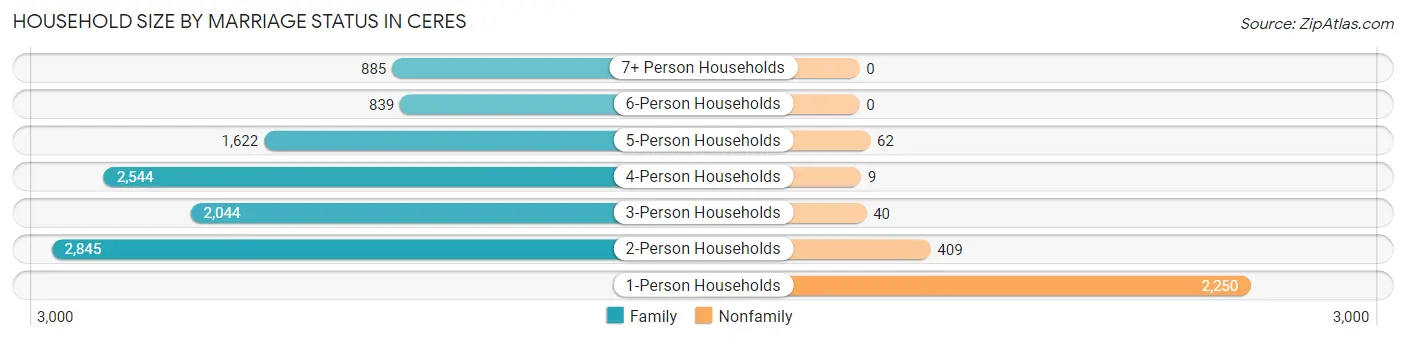
| Household Size | Family Households | Nonfamily Households |
| 1-Person Households | - | 2,250 (16.6%) |
| 2-Person Households | 2,845 (21.0%) | 409 (3.0%) |
| 3-Person Households | 2,044 (15.1%) | 40 (0.3%) |
| 4-Person Households | 2,544 (18.8%) | 9 (0.1%) |
| 5-Person Households | 1,622 (12.0%) | 62 (0.5%) |
| 6-Person Households | 839 (6.2%) | 0 (0.0%) |
| 7+ Person Households | 885 (6.5%) | 0 (0.0%) |
| Total | 10,779 (79.6%) | 2,770 (20.4%) |
Female Fertility in Ceres
Fertility by Age in Ceres
Average fertility rate in Ceres is 70.0 births per 1,000 women. Women in the age bracket of 20 to 34 years have the highest fertility rate with 123.0 births per 1,000 women. Women in the age bracket of 20 to 34 years acount for 73.6% of all women with births.
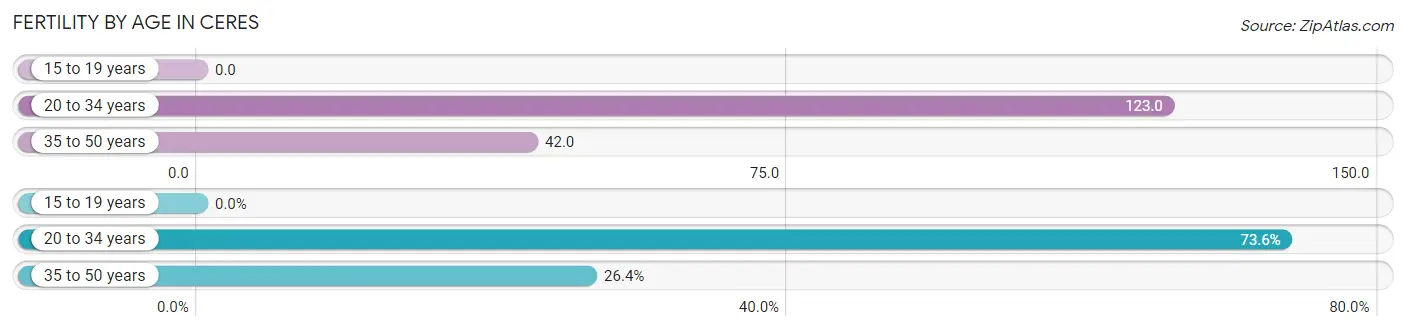
| Age Bracket | Women with Births | Births / 1,000 Women |
| 15 to 19 years | 0 (0.0%) | 0.0 |
| 20 to 34 years | 588 (73.6%) | 123.0 |
| 35 to 50 years | 211 (26.4%) | 42.0 |
| Total | 799 (100.0%) | 70.0 |
Fertility by Age by Marriage Status in Ceres
78.1% of women with births (799) in Ceres are married. The highest percentage of unmarried women with births falls into 35 to 50 years age bracket with 24.6% of them unmarried at the time of birth, while the lowest percentage of unmarried women with births belong to 20 to 34 years age bracket with 20.9% of them unmarried.
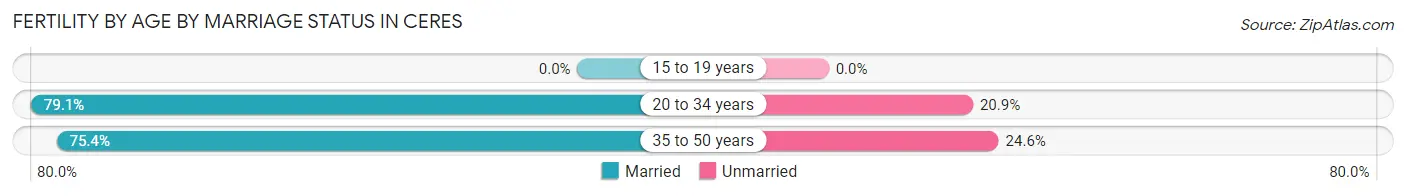
| Age Bracket | Married | Unmarried |
| 15 to 19 years | 0 (0.0%) | 0 (0.0%) |
| 20 to 34 years | 465 (79.1%) | 123 (20.9%) |
| 35 to 50 years | 159 (75.4%) | 52 (24.6%) |
| Total | 624 (78.1%) | 175 (21.9%) |
Fertility by Education in Ceres
Average fertility rate in Ceres is 70.0 births per 1,000 women. Women with the education attainment of graduate degree have the highest fertility rate of 117.0 births per 1,000 women, while women with the education attainment of high school diploma have the lowest fertility at 37.0 births per 1,000 women. Women with the education attainment of college or associate's degree represent 42.3% of all women with births.
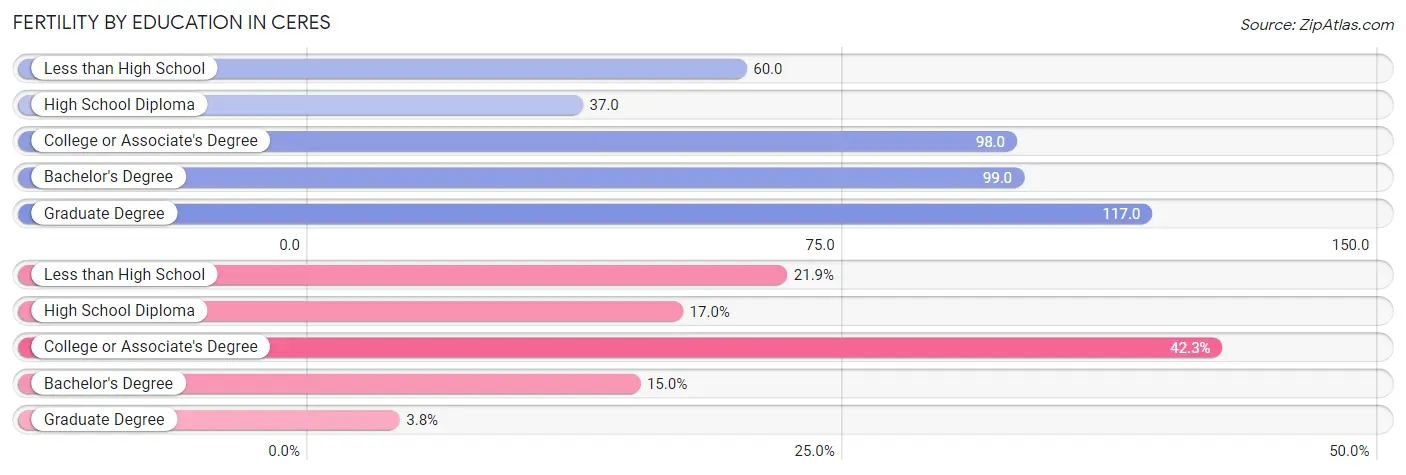
| Educational Attainment | Women with Births | Births / 1,000 Women |
| Less than High School | 175 (21.9%) | 60.0 |
| High School Diploma | 136 (17.0%) | 37.0 |
| College or Associate's Degree | 338 (42.3%) | 98.0 |
| Bachelor's Degree | 120 (15.0%) | 99.0 |
| Graduate Degree | 30 (3.7%) | 117.0 |
| Total | 799 (100.0%) | 70.0 |
Fertility by Education by Marriage Status in Ceres
21.9% of women with births in Ceres are unmarried. Women with the educational attainment of bachelor's degree are most likely to be married with 100.0% of them married at childbirth, while women with the educational attainment of high school diploma are least likely to be married with 48.5% of them unmarried at childbirth.
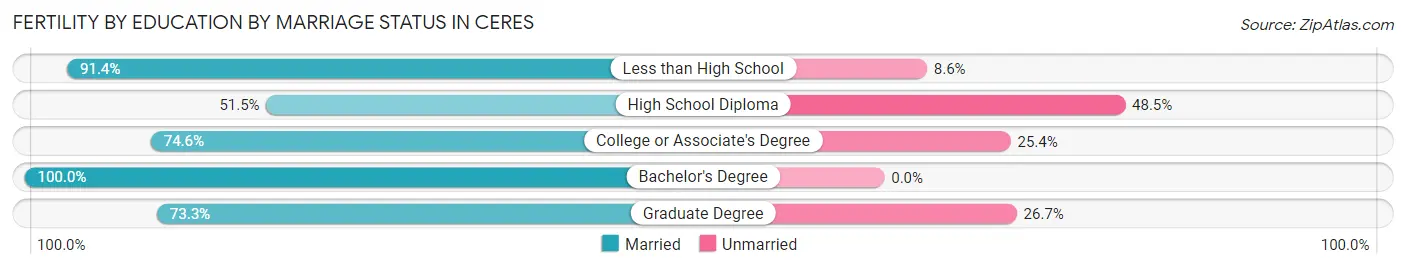
| Educational Attainment | Married | Unmarried |
| Less than High School | 160 (91.4%) | 15 (8.6%) |
| High School Diploma | 70 (51.5%) | 66 (48.5%) |
| College or Associate's Degree | 252 (74.6%) | 86 (25.4%) |
| Bachelor's Degree | 120 (100.0%) | 0 (0.0%) |
| Graduate Degree | 22 (73.3%) | 8 (26.7%) |
| Total | 624 (78.1%) | 175 (21.9%) |
Employment Characteristics in Ceres
Employment by Class of Employer in Ceres
Among the 18,586 employed individuals in Ceres, private company employees (13,623 | 73.3%), local government employees (1,480 | 8.0%), and not-for-profit organizations (1,174 | 6.3%) make up the most common classes of employment.
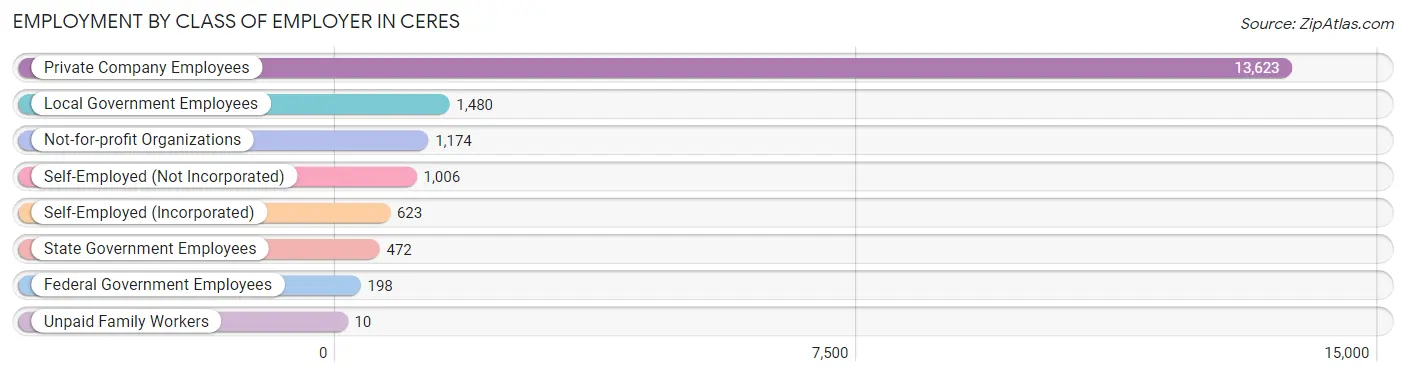
| Employer Class | # Employees | % Employees |
| Private Company Employees | 13,623 | 73.3% |
| Self-Employed (Incorporated) | 623 | 3.4% |
| Self-Employed (Not Incorporated) | 1,006 | 5.4% |
| Not-for-profit Organizations | 1,174 | 6.3% |
| Local Government Employees | 1,480 | 8.0% |
| State Government Employees | 472 | 2.5% |
| Federal Government Employees | 198 | 1.1% |
| Unpaid Family Workers | 10 | 0.1% |
| Total | 18,586 | 100.0% |
Employment Status by Age in Ceres
According to the labor force statistics for Ceres, out of the total population over 16 years of age (36,613), 59.5% or 21,785 individuals are in the labor force, with 10.5% or 2,287 of them unemployed. The age group with the highest labor force participation rate is 30 to 34 years, with 81.7% or 3,127 individuals in the labor force. Within the labor force, the 20 to 24 years age range has the highest percentage of unemployed individuals, with 16.9% or 393 of them being unemployed.
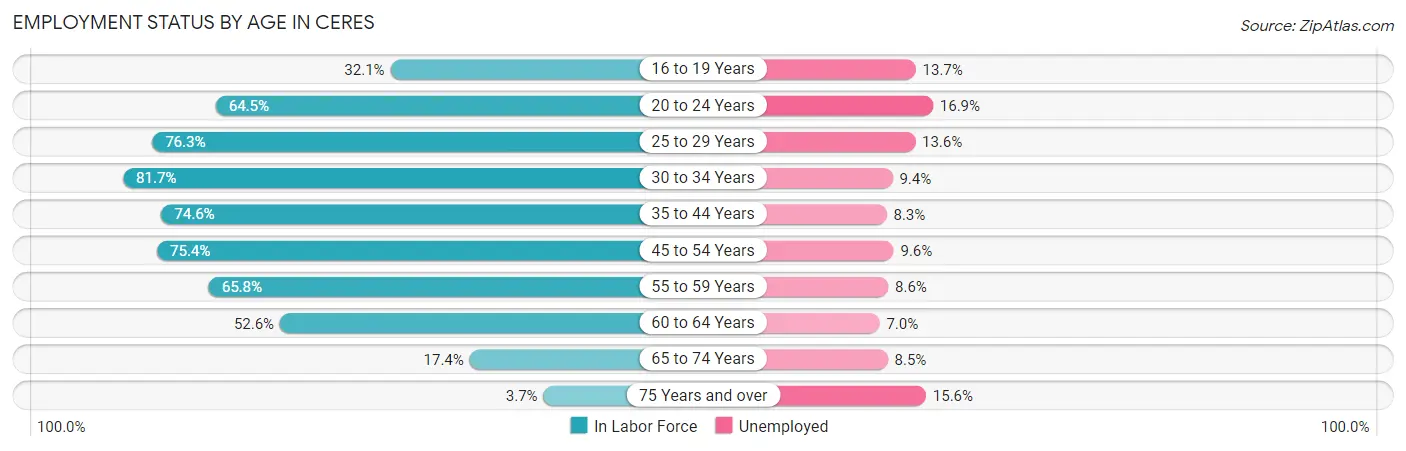
| Age Bracket | In Labor Force | Unemployed |
| 16 to 19 Years | 901 (32.1%) | 123 (13.7%) |
| 20 to 24 Years | 2,325 (64.5%) | 393 (16.9%) |
| 25 to 29 Years | 2,845 (76.3%) | 387 (13.6%) |
| 30 to 34 Years | 3,127 (81.7%) | 294 (9.4%) |
| 35 to 44 Years | 5,165 (74.6%) | 429 (8.3%) |
| 45 to 54 Years | 3,661 (75.4%) | 351 (9.6%) |
| 55 to 59 Years | 2,023 (65.8%) | 174 (8.6%) |
| 60 to 64 Years | 1,045 (52.6%) | 73 (7.0%) |
| 65 to 74 Years | 586 (17.4%) | 50 (8.5%) |
| 75 Years and over | 90 (3.7%) | 14 (15.6%) |
| Total | 21,785 (59.5%) | 2,287 (10.5%) |
Employment Status by Educational Attainment in Ceres
According to labor force statistics for Ceres, 73.2% of individuals (17,859) out of the total population between 25 and 64 years of age (24,398) are in the labor force, with 9.6% or 1,714 of them being unemployed. The group with the highest labor force participation rate are those with the educational attainment of bachelor's degree or higher, with 78.8% or 2,151 individuals in the labor force. Within the labor force, individuals with less than high school education have the highest percentage of unemployment, with 12.4% or 421 of them being unemployed.
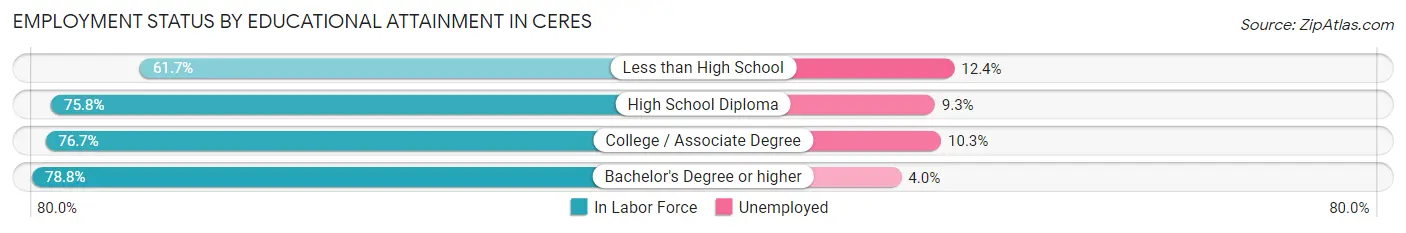
| Educational Attainment | In Labor Force | Unemployed |
| Less than High School | 3,393 (61.7%) | 682 (12.4%) |
| High School Diploma | 6,733 (75.8%) | 826 (9.3%) |
| College / Associate Degree | 5,588 (76.7%) | 750 (10.3%) |
| Bachelor's Degree or higher | 2,151 (78.8%) | 109 (4.0%) |
| Total | 17,859 (73.2%) | 2,342 (9.6%) |
Employment Occupations by Sex in Ceres
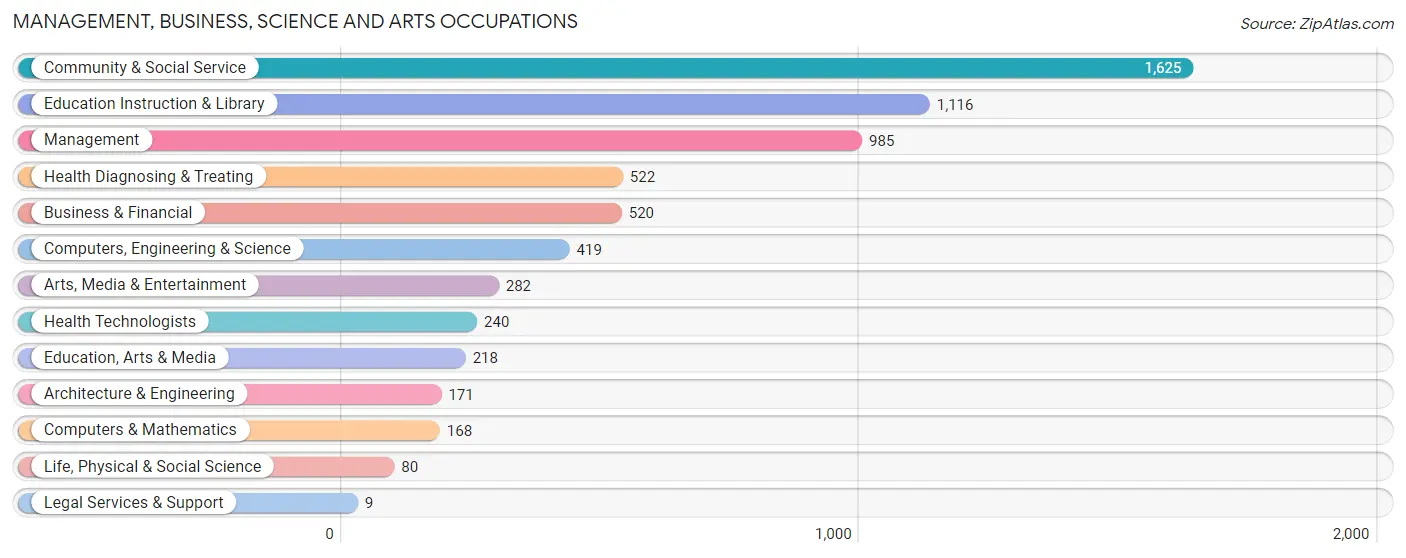
Management, Business, Science and Arts Occupations
The most common Management, Business, Science and Arts occupations in Ceres are Community & Social Service (1,625 | 8.3%), Education Instruction & Library (1,116 | 5.7%), Management (985 | 5.1%), Health Diagnosing & Treating (522 | 2.7%), and Business & Financial (520 | 2.7%).
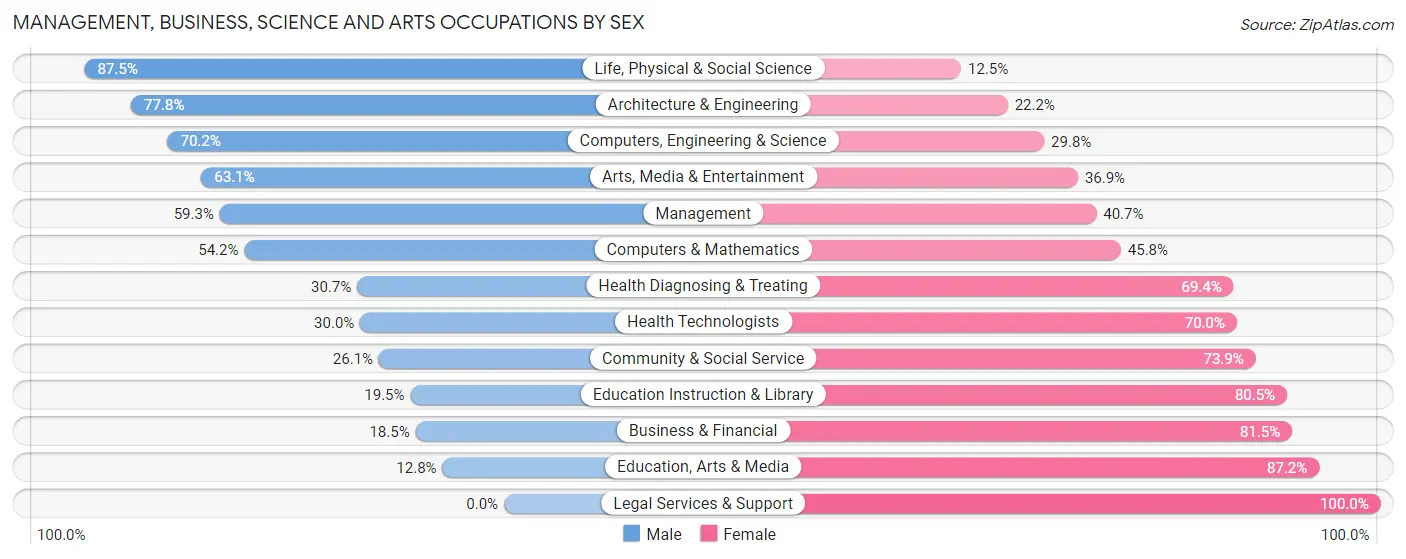
Management, Business, Science and Arts Occupations by Sex
Within the Management, Business, Science and Arts occupations in Ceres, the most male-oriented occupations are Life, Physical & Social Science (87.5%), Architecture & Engineering (77.8%), and Computers, Engineering & Science (70.2%), while the most female-oriented occupations are Legal Services & Support (100.0%), Education, Arts & Media (87.2%), and Business & Financial (81.5%).
| Occupation | Male | Female |
| Management | 584 (59.3%) | 401 (40.7%) |
| Business & Financial | 96 (18.5%) | 424 (81.5%) |
| Computers, Engineering & Science | 294 (70.2%) | 125 (29.8%) |
| Computers & Mathematics | 91 (54.2%) | 77 (45.8%) |
| Architecture & Engineering | 133 (77.8%) | 38 (22.2%) |
| Life, Physical & Social Science | 70 (87.5%) | 10 (12.5%) |
| Community & Social Service | 424 (26.1%) | 1,201 (73.9%) |
| Education, Arts & Media | 28 (12.8%) | 190 (87.2%) |
| Legal Services & Support | 0 (0.0%) | 9 (100.0%) |
| Education Instruction & Library | 218 (19.5%) | 898 (80.5%) |
| Arts, Media & Entertainment | 178 (63.1%) | 104 (36.9%) |
| Health Diagnosing & Treating | 160 (30.6%) | 362 (69.4%) |
| Health Technologists | 72 (30.0%) | 168 (70.0%) |
| Total (Category) | 1,558 (38.3%) | 2,513 (61.7%) |
| Total (Overall) | 11,258 (57.8%) | 8,219 (42.2%) |
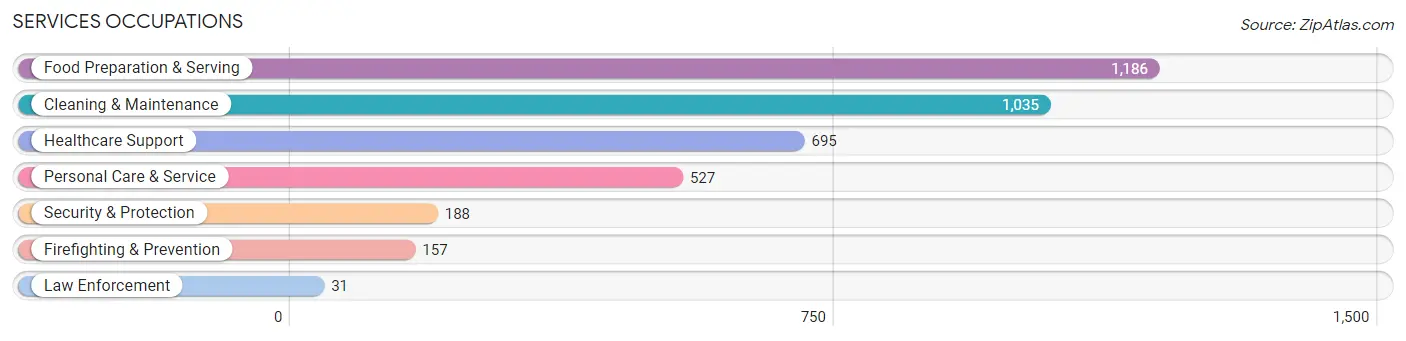
Services Occupations
The most common Services occupations in Ceres are Food Preparation & Serving (1,186 | 6.1%), Cleaning & Maintenance (1,035 | 5.3%), Healthcare Support (695 | 3.6%), Personal Care & Service (527 | 2.7%), and Security & Protection (188 | 1.0%).
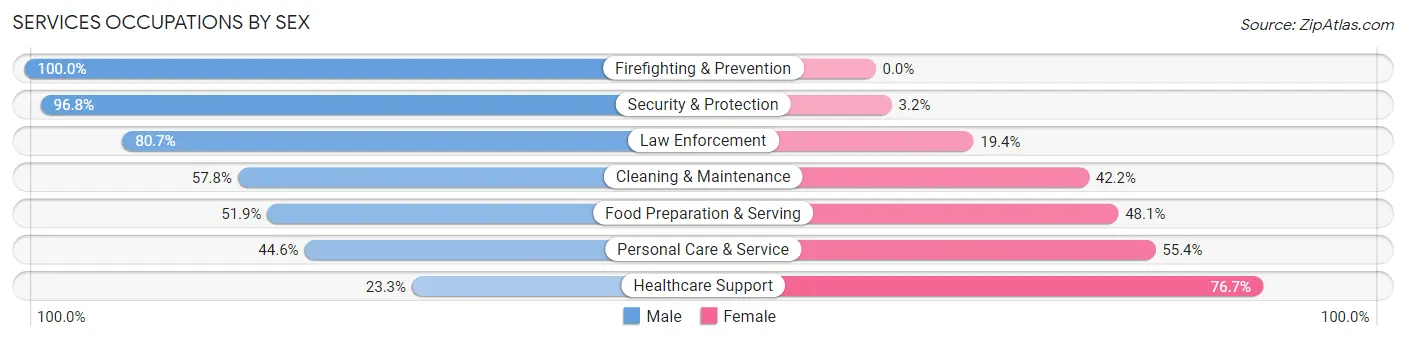
Services Occupations by Sex
Within the Services occupations in Ceres, the most male-oriented occupations are Firefighting & Prevention (100.0%), Security & Protection (96.8%), and Law Enforcement (80.6%), while the most female-oriented occupations are Healthcare Support (76.7%), Personal Care & Service (55.4%), and Food Preparation & Serving (48.1%).
| Occupation | Male | Female |
| Healthcare Support | 162 (23.3%) | 533 (76.7%) |
| Security & Protection | 182 (96.8%) | 6 (3.2%) |
| Firefighting & Prevention | 157 (100.0%) | 0 (0.0%) |
| Law Enforcement | 25 (80.6%) | 6 (19.4%) |
| Food Preparation & Serving | 616 (51.9%) | 570 (48.1%) |
| Cleaning & Maintenance | 598 (57.8%) | 437 (42.2%) |
| Personal Care & Service | 235 (44.6%) | 292 (55.4%) |
| Total (Category) | 1,793 (49.4%) | 1,838 (50.6%) |
| Total (Overall) | 11,258 (57.8%) | 8,219 (42.2%) |
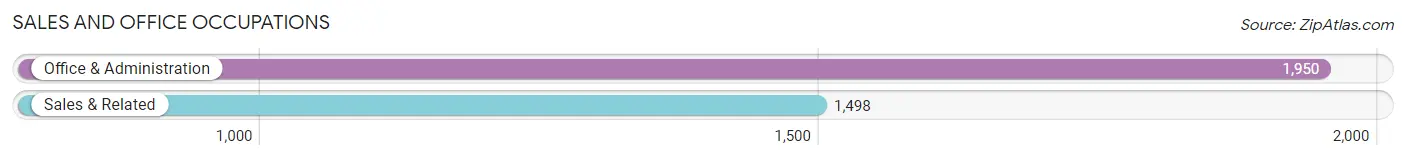
Sales and Office Occupations
The most common Sales and Office occupations in Ceres are Office & Administration (1,950 | 10.0%), and Sales & Related (1,498 | 7.7%).
Sales and Office Occupations by Sex
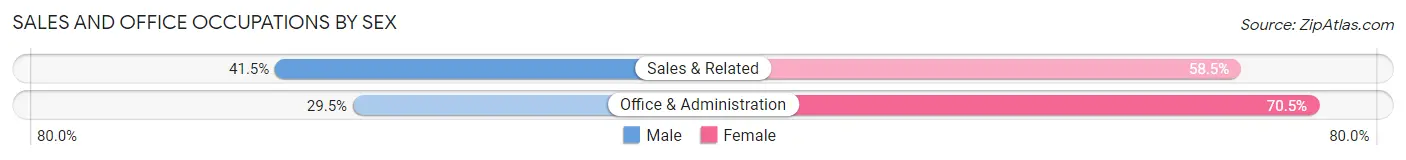
| Occupation | Male | Female |
| Sales & Related | 621 (41.5%) | 877 (58.5%) |
| Office & Administration | 575 (29.5%) | 1,375 (70.5%) |
| Total (Category) | 1,196 (34.7%) | 2,252 (65.3%) |
| Total (Overall) | 11,258 (57.8%) | 8,219 (42.2%) |
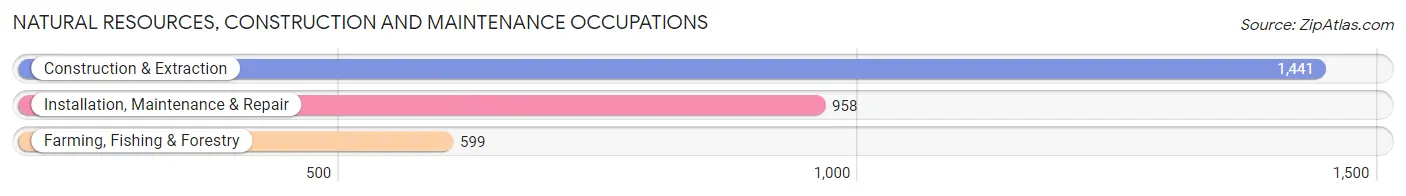
Natural Resources, Construction and Maintenance Occupations
The most common Natural Resources, Construction and Maintenance occupations in Ceres are Construction & Extraction (1,441 | 7.4%), Installation, Maintenance & Repair (958 | 4.9%), and Farming, Fishing & Forestry (599 | 3.1%).
Natural Resources, Construction and Maintenance Occupations by Sex
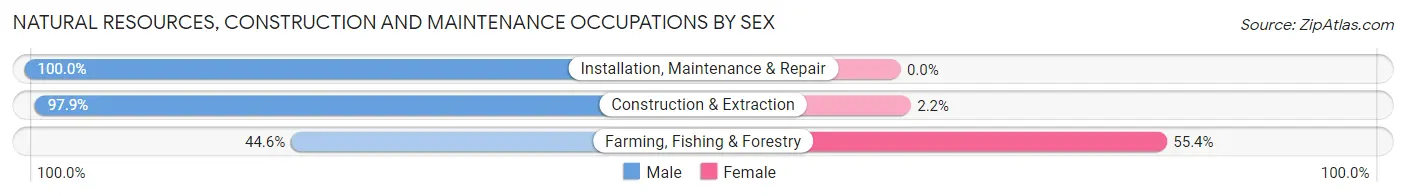
| Occupation | Male | Female |
| Farming, Fishing & Forestry | 267 (44.6%) | 332 (55.4%) |
| Construction & Extraction | 1,410 (97.9%) | 31 (2.1%) |
| Installation, Maintenance & Repair | 958 (100.0%) | 0 (0.0%) |
| Total (Category) | 2,635 (87.9%) | 363 (12.1%) |
| Total (Overall) | 11,258 (57.8%) | 8,219 (42.2%) |
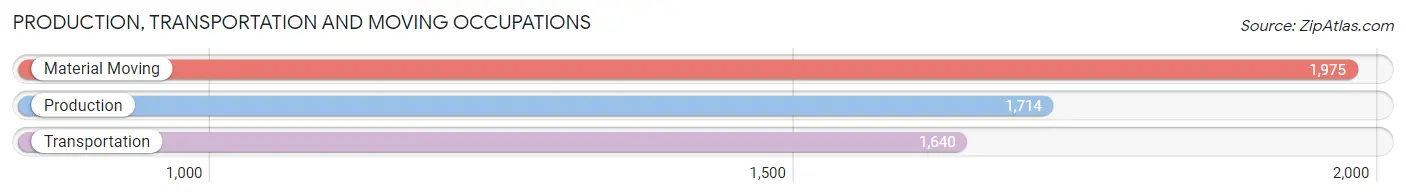
Production, Transportation and Moving Occupations
The most common Production, Transportation and Moving occupations in Ceres are Material Moving (1,975 | 10.1%), Production (1,714 | 8.8%), and Transportation (1,640 | 8.4%).
Production, Transportation and Moving Occupations by Sex
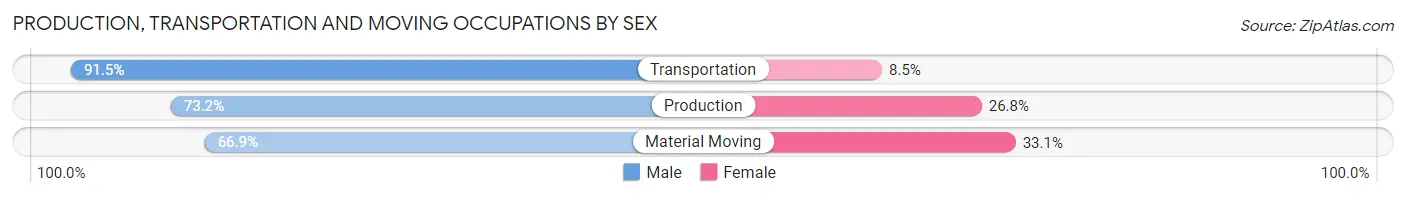
| Occupation | Male | Female |
| Production | 1,254 (73.2%) | 460 (26.8%) |
| Transportation | 1,500 (91.5%) | 140 (8.5%) |
| Material Moving | 1,322 (66.9%) | 653 (33.1%) |
| Total (Category) | 4,076 (76.5%) | 1,253 (23.5%) |
| Total (Overall) | 11,258 (57.8%) | 8,219 (42.2%) |
Employment Industries by Sex in Ceres
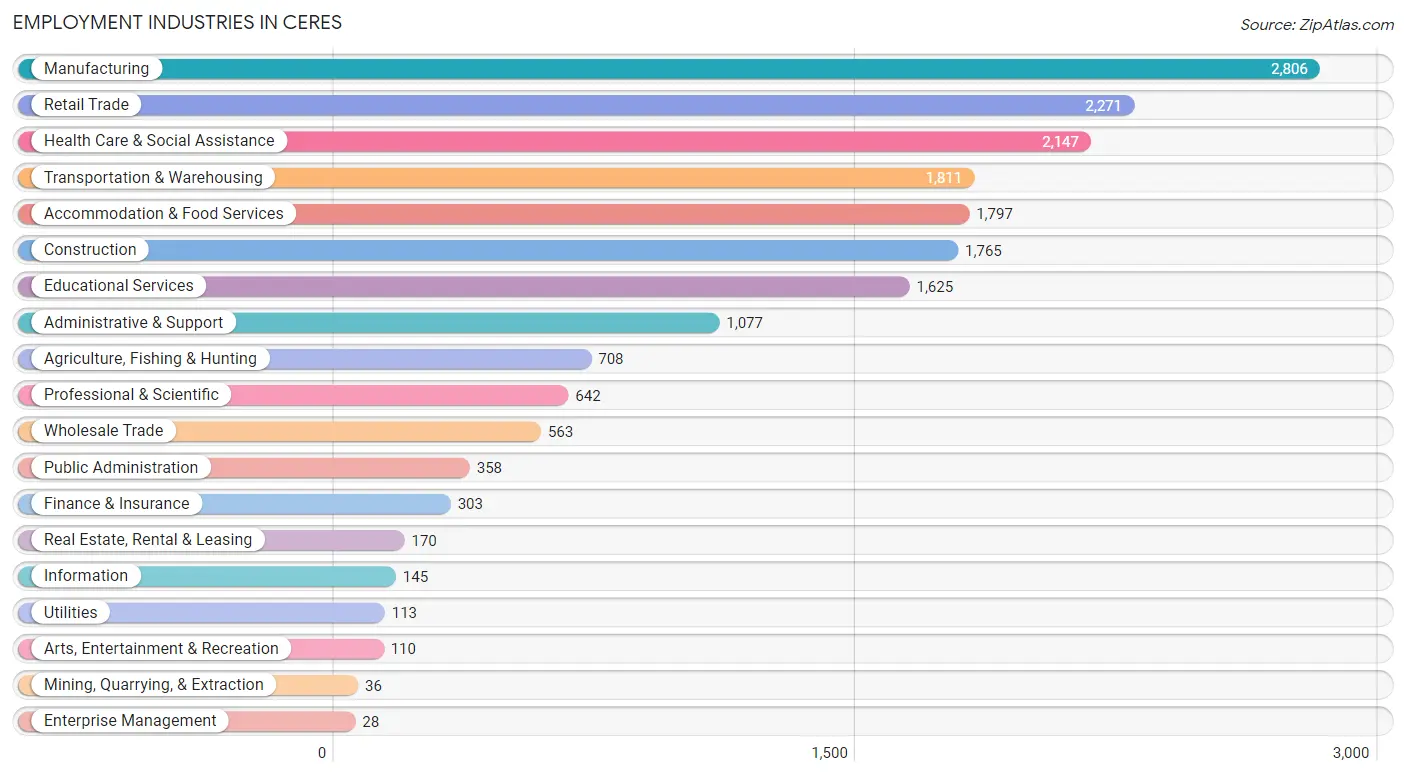
Employment Industries in Ceres
The major employment industries in Ceres include Manufacturing (2,806 | 14.4%), Retail Trade (2,271 | 11.7%), Health Care & Social Assistance (2,147 | 11.0%), Transportation & Warehousing (1,811 | 9.3%), and Accommodation & Food Services (1,797 | 9.2%).
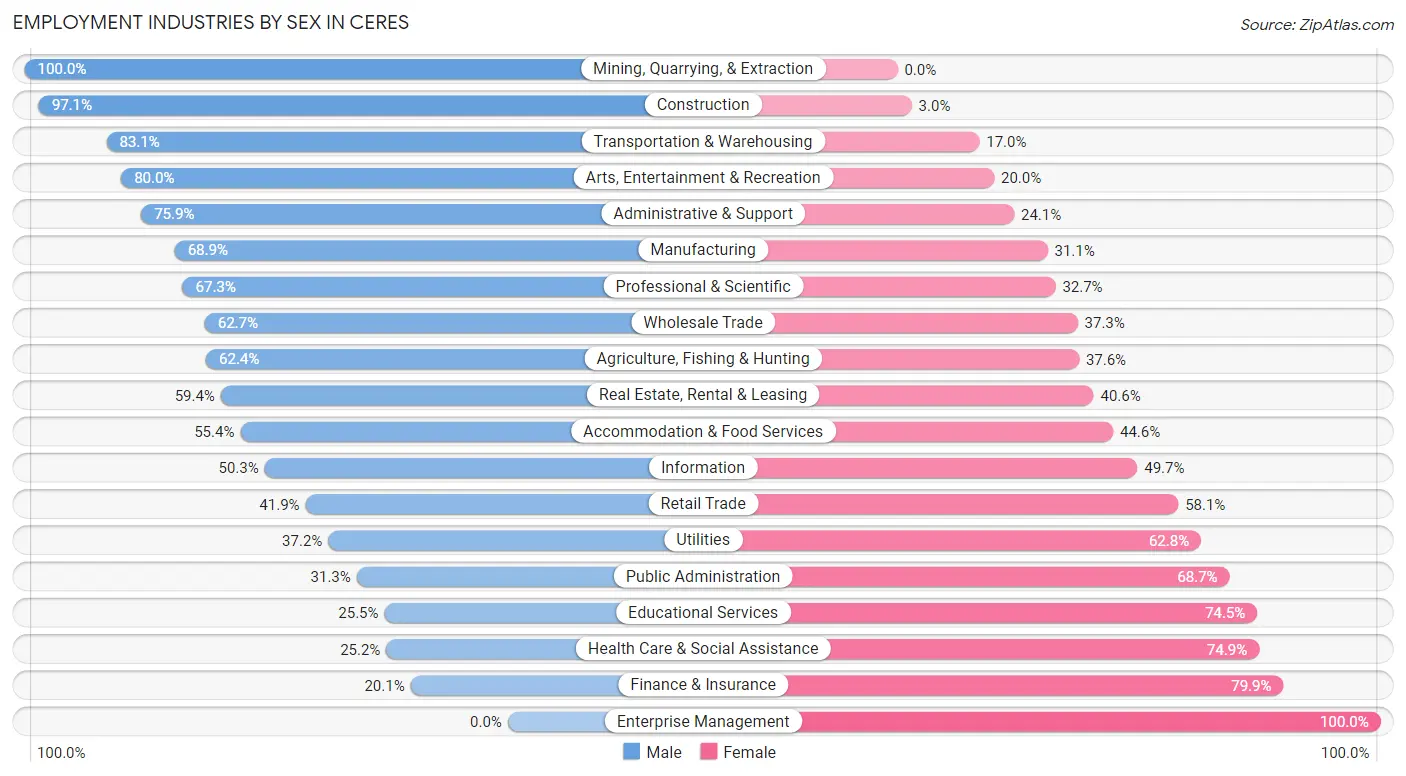
Employment Industries by Sex in Ceres
The Ceres industries that see more men than women are Mining, Quarrying, & Extraction (100.0%), Construction (97.1%), and Transportation & Warehousing (83.1%), whereas the industries that tend to have a higher number of women are Enterprise Management (100.0%), Finance & Insurance (79.9%), and Health Care & Social Assistance (74.9%).
| Industry | Male | Female |
| Agriculture, Fishing & Hunting | 442 (62.4%) | 266 (37.6%) |
| Mining, Quarrying, & Extraction | 36 (100.0%) | 0 (0.0%) |
| Construction | 1,713 (97.1%) | 52 (2.9%) |
| Manufacturing | 1,934 (68.9%) | 872 (31.1%) |
| Wholesale Trade | 353 (62.7%) | 210 (37.3%) |
| Retail Trade | 951 (41.9%) | 1,320 (58.1%) |
| Transportation & Warehousing | 1,504 (83.1%) | 307 (17.0%) |
| Utilities | 42 (37.2%) | 71 (62.8%) |
| Information | 73 (50.3%) | 72 (49.7%) |
| Finance & Insurance | 61 (20.1%) | 242 (79.9%) |
| Real Estate, Rental & Leasing | 101 (59.4%) | 69 (40.6%) |
| Professional & Scientific | 432 (67.3%) | 210 (32.7%) |
| Enterprise Management | 0 (0.0%) | 28 (100.0%) |
| Administrative & Support | 817 (75.9%) | 260 (24.1%) |
| Educational Services | 415 (25.5%) | 1,210 (74.5%) |
| Health Care & Social Assistance | 540 (25.2%) | 1,607 (74.9%) |
| Arts, Entertainment & Recreation | 88 (80.0%) | 22 (20.0%) |
| Accommodation & Food Services | 995 (55.4%) | 802 (44.6%) |
| Public Administration | 112 (31.3%) | 246 (68.7%) |
| Total | 11,258 (57.8%) | 8,219 (42.2%) |
Education in Ceres
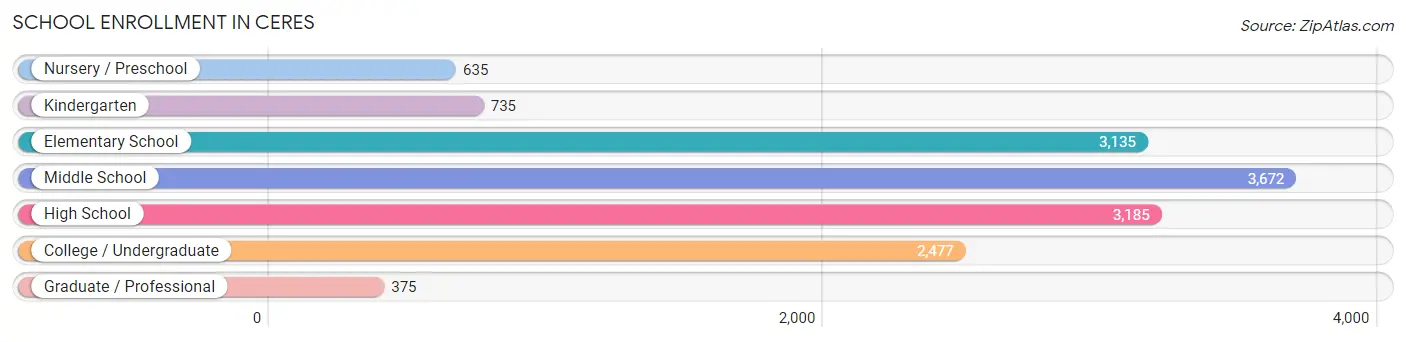
School Enrollment in Ceres
The most common levels of schooling among the 14,214 students in Ceres are middle school (3,672 | 25.8%), high school (3,185 | 22.4%), and elementary school (3,135 | 22.1%).
| School Level | # Students | % Students |
| Nursery / Preschool | 635 | 4.5% |
| Kindergarten | 735 | 5.2% |
| Elementary School | 3,135 | 22.1% |
| Middle School | 3,672 | 25.8% |
| High School | 3,185 | 22.4% |
| College / Undergraduate | 2,477 | 17.4% |
| Graduate / Professional | 375 | 2.6% |
| Total | 14,214 | 100.0% |
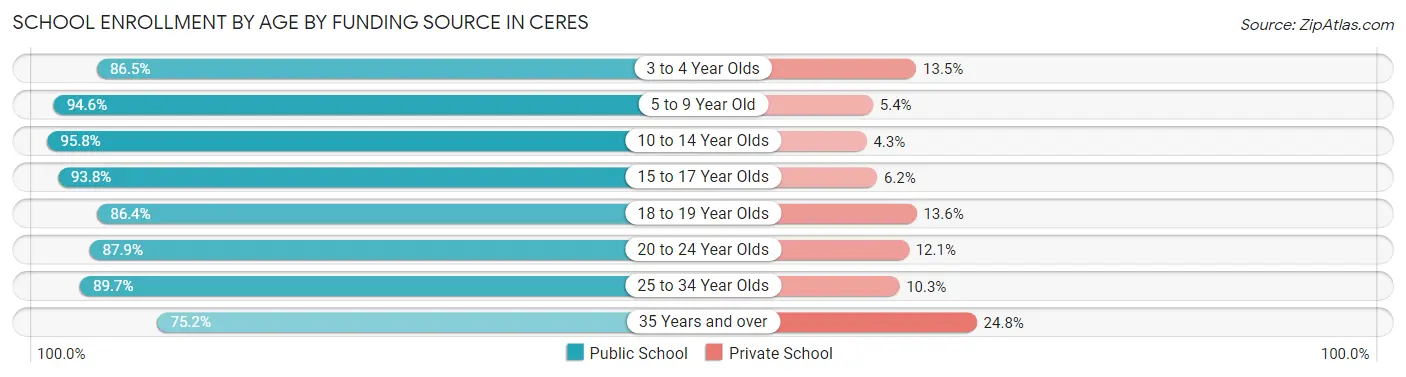
School Enrollment by Age by Funding Source in Ceres
Out of a total of 14,214 students who are enrolled in schools in Ceres, 1,052 (7.4%) attend a private institution, while the remaining 13,162 (92.6%) are enrolled in public schools. The age group of 35 years and over has the highest likelihood of being enrolled in private schools, with 134 (24.8% in the age bracket) enrolled. Conversely, the age group of 10 to 14 year olds has the lowest likelihood of being enrolled in a private school, with 4,508 (95.8% in the age bracket) attending a public institution.
| Age Bracket | Public School | Private School |
| 3 to 4 Year Olds | 449 (86.5%) | 70 (13.5%) |
| 5 to 9 Year Old | 3,434 (94.6%) | 197 (5.4%) |
| 10 to 14 Year Olds | 4,508 (95.8%) | 200 (4.3%) |
| 15 to 17 Year Olds | 1,963 (93.8%) | 130 (6.2%) |
| 18 to 19 Year Olds | 663 (86.4%) | 104 (13.6%) |
| 20 to 24 Year Olds | 928 (87.9%) | 128 (12.1%) |
| 25 to 34 Year Olds | 806 (89.7%) | 93 (10.3%) |
| 35 Years and over | 407 (75.2%) | 134 (24.8%) |
| Total | 13,162 (92.6%) | 1,052 (7.4%) |
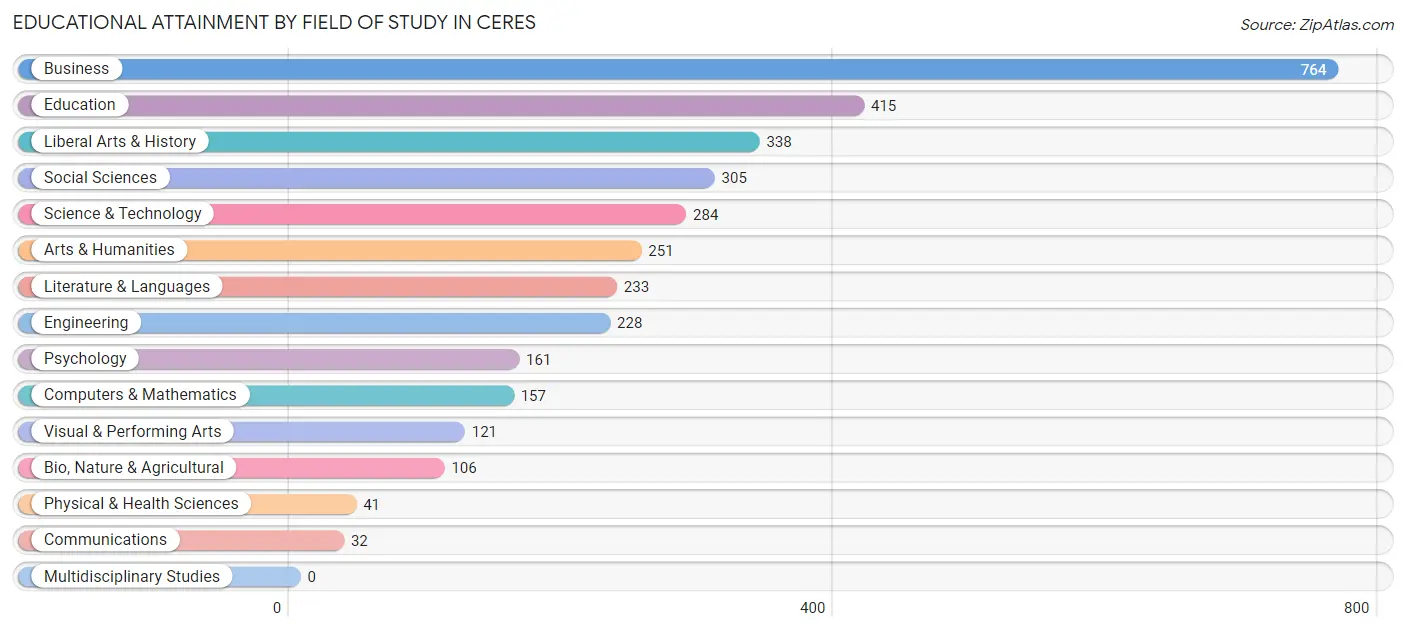
Educational Attainment by Field of Study in Ceres
Business (764 | 22.2%), education (415 | 12.1%), liberal arts & history (338 | 9.8%), social sciences (305 | 8.9%), and science & technology (284 | 8.3%) are the most common fields of study among 3,436 individuals in Ceres who have obtained a bachelor's degree or higher.
| Field of Study | # Graduates | % Graduates |
| Computers & Mathematics | 157 | 4.6% |
| Bio, Nature & Agricultural | 106 | 3.1% |
| Physical & Health Sciences | 41 | 1.2% |
| Psychology | 161 | 4.7% |
| Social Sciences | 305 | 8.9% |
| Engineering | 228 | 6.6% |
| Multidisciplinary Studies | 0 | 0.0% |
| Science & Technology | 284 | 8.3% |
| Business | 764 | 22.2% |
| Education | 415 | 12.1% |
| Literature & Languages | 233 | 6.8% |
| Liberal Arts & History | 338 | 9.8% |
| Visual & Performing Arts | 121 | 3.5% |
| Communications | 32 | 0.9% |
| Arts & Humanities | 251 | 7.3% |
| Total | 3,436 | 100.0% |
Transportation & Commute in Ceres
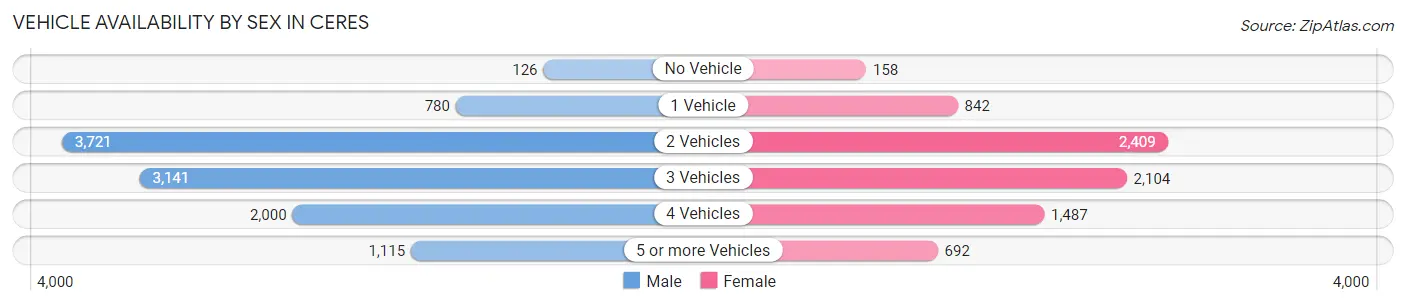
Vehicle Availability by Sex in Ceres
The most prevalent vehicle ownership categories in Ceres are males with 2 vehicles (3,721, accounting for 34.2%) and females with 2 vehicles (2,409, making up 48.4%).
| Vehicles Available | Male | Female |
| No Vehicle | 126 (1.2%) | 158 (2.1%) |
| 1 Vehicle | 780 (7.2%) | 842 (11.0%) |
| 2 Vehicles | 3,721 (34.2%) | 2,409 (31.3%) |
| 3 Vehicles | 3,141 (28.9%) | 2,104 (27.4%) |
| 4 Vehicles | 2,000 (18.4%) | 1,487 (19.3%) |
| 5 or more Vehicles | 1,115 (10.2%) | 692 (9.0%) |
| Total | 10,883 (100.0%) | 7,692 (100.0%) |
Commute Time in Ceres
The most frequently occuring commute durations in Ceres are 15 to 19 minutes (2,709 commuters, 15.1%), 20 to 24 minutes (2,621 commuters, 14.6%), and 10 to 14 minutes (2,379 commuters, 13.3%).
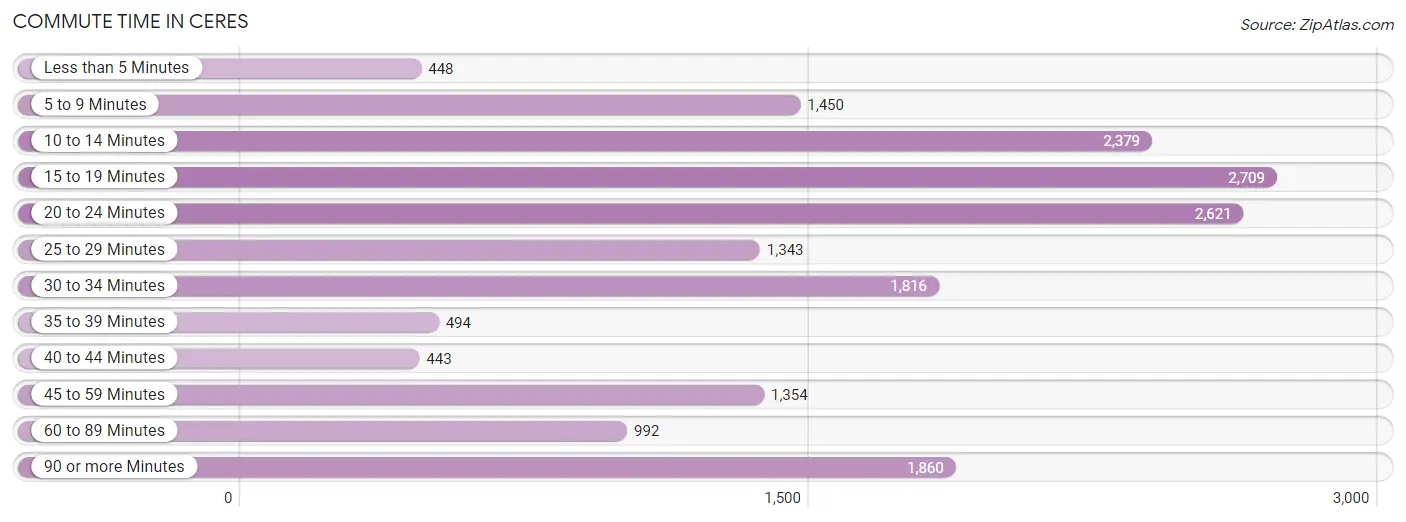
| Commute Time | # Commuters | % Commuters |
| Less than 5 Minutes | 448 | 2.5% |
| 5 to 9 Minutes | 1,450 | 8.1% |
| 10 to 14 Minutes | 2,379 | 13.3% |
| 15 to 19 Minutes | 2,709 | 15.1% |
| 20 to 24 Minutes | 2,621 | 14.6% |
| 25 to 29 Minutes | 1,343 | 7.5% |
| 30 to 34 Minutes | 1,816 | 10.1% |
| 35 to 39 Minutes | 494 | 2.8% |
| 40 to 44 Minutes | 443 | 2.5% |
| 45 to 59 Minutes | 1,354 | 7.6% |
| 60 to 89 Minutes | 992 | 5.5% |
| 90 or more Minutes | 1,860 | 10.4% |
Commute Time by Sex in Ceres
The most common commute times in Ceres are 90 or more minutes (1,734 commuters, 16.5%) for males and 20 to 24 minutes (1,519 commuters, 20.5%) for females.
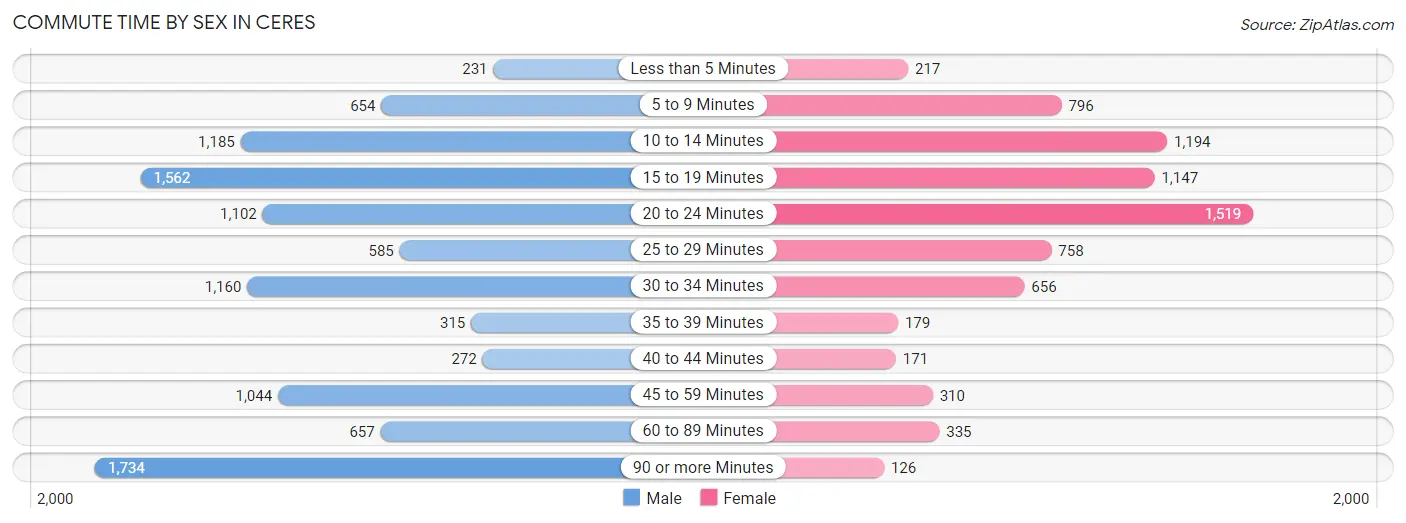
| Commute Time | Male | Female |
| Less than 5 Minutes | 231 (2.2%) | 217 (2.9%) |
| 5 to 9 Minutes | 654 (6.2%) | 796 (10.7%) |
| 10 to 14 Minutes | 1,185 (11.3%) | 1,194 (16.1%) |
| 15 to 19 Minutes | 1,562 (14.9%) | 1,147 (15.5%) |
| 20 to 24 Minutes | 1,102 (10.5%) | 1,519 (20.5%) |
| 25 to 29 Minutes | 585 (5.6%) | 758 (10.2%) |
| 30 to 34 Minutes | 1,160 (11.1%) | 656 (8.9%) |
| 35 to 39 Minutes | 315 (3.0%) | 179 (2.4%) |
| 40 to 44 Minutes | 272 (2.6%) | 171 (2.3%) |
| 45 to 59 Minutes | 1,044 (9.9%) | 310 (4.2%) |
| 60 to 89 Minutes | 657 (6.3%) | 335 (4.5%) |
| 90 or more Minutes | 1,734 (16.5%) | 126 (1.7%) |
Time of Departure to Work by Sex in Ceres
The most frequent times of departure to work in Ceres are 12:00 AM to 4:59 AM (2,645, 25.2%) for males and 7:00 AM to 7:29 AM (1,592, 21.5%) for females.
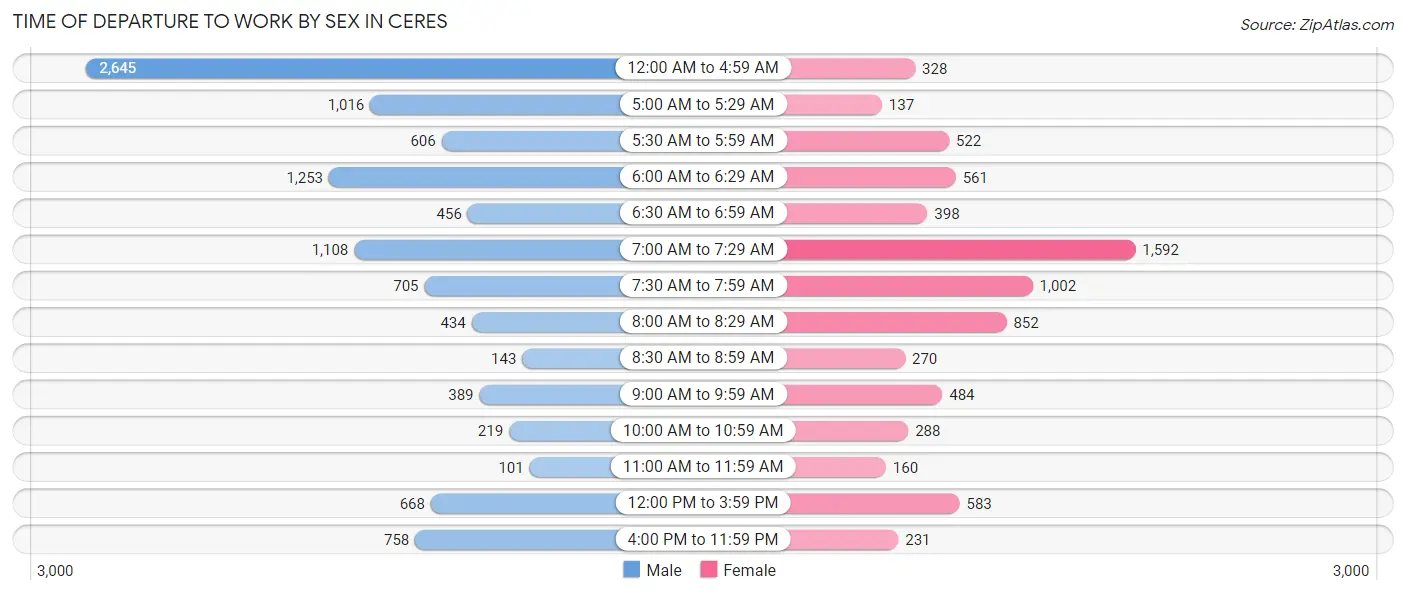
| Time of Departure | Male | Female |
| 12:00 AM to 4:59 AM | 2,645 (25.2%) | 328 (4.4%) |
| 5:00 AM to 5:29 AM | 1,016 (9.7%) | 137 (1.8%) |
| 5:30 AM to 5:59 AM | 606 (5.8%) | 522 (7.0%) |
| 6:00 AM to 6:29 AM | 1,253 (11.9%) | 561 (7.6%) |
| 6:30 AM to 6:59 AM | 456 (4.3%) | 398 (5.4%) |
| 7:00 AM to 7:29 AM | 1,108 (10.5%) | 1,592 (21.5%) |
| 7:30 AM to 7:59 AM | 705 (6.7%) | 1,002 (13.5%) |
| 8:00 AM to 8:29 AM | 434 (4.1%) | 852 (11.5%) |
| 8:30 AM to 8:59 AM | 143 (1.4%) | 270 (3.6%) |
| 9:00 AM to 9:59 AM | 389 (3.7%) | 484 (6.5%) |
| 10:00 AM to 10:59 AM | 219 (2.1%) | 288 (3.9%) |
| 11:00 AM to 11:59 AM | 101 (1.0%) | 160 (2.2%) |
| 12:00 PM to 3:59 PM | 668 (6.4%) | 583 (7.9%) |
| 4:00 PM to 11:59 PM | 758 (7.2%) | 231 (3.1%) |
| Total | 10,501 (100.0%) | 7,408 (100.0%) |
Housing Occupancy in Ceres
Occupancy by Ownership in Ceres
Of the total 13,549 dwellings in Ceres, owner-occupied units account for 8,575 (63.3%), while renter-occupied units make up 4,974 (36.7%).
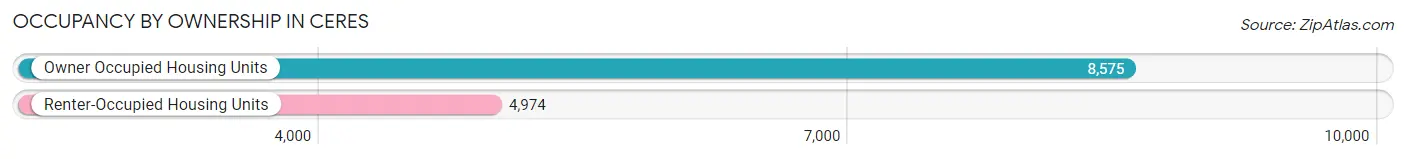
| Occupancy | # Housing Units | % Housing Units |
| Owner Occupied Housing Units | 8,575 | 63.3% |
| Renter-Occupied Housing Units | 4,974 | 36.7% |
| Total Occupied Housing Units | 13,549 | 100.0% |
Occupancy by Household Size in Ceres
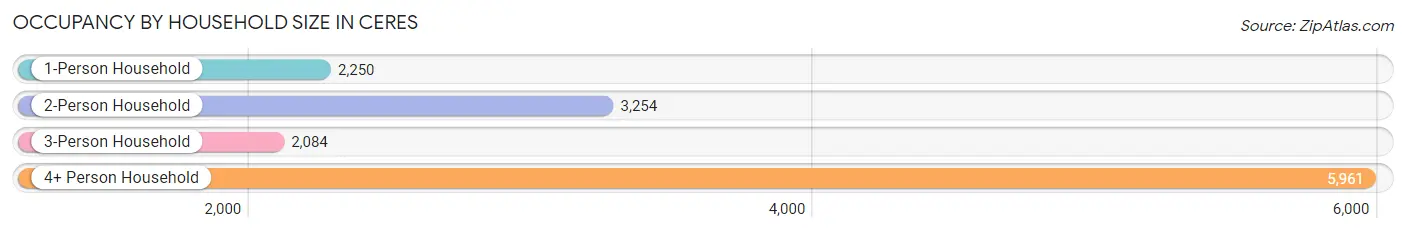
| Household Size | # Housing Units | % Housing Units |
| 1-Person Household | 2,250 | 16.6% |
| 2-Person Household | 3,254 | 24.0% |
| 3-Person Household | 2,084 | 15.4% |
| 4+ Person Household | 5,961 | 44.0% |
| Total Housing Units | 13,549 | 100.0% |
Occupancy by Ownership by Household Size in Ceres
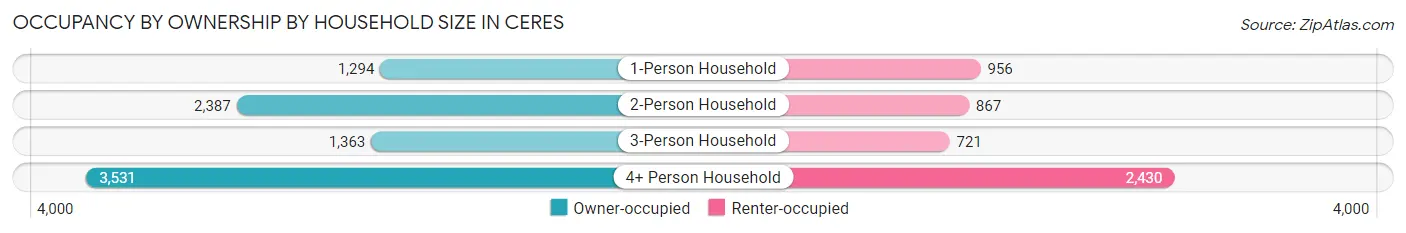
| Household Size | Owner-occupied | Renter-occupied |
| 1-Person Household | 1,294 (57.5%) | 956 (42.5%) |
| 2-Person Household | 2,387 (73.4%) | 867 (26.6%) |
| 3-Person Household | 1,363 (65.4%) | 721 (34.6%) |
| 4+ Person Household | 3,531 (59.2%) | 2,430 (40.8%) |
| Total Housing Units | 8,575 (63.3%) | 4,974 (36.7%) |
Occupancy by Educational Attainment in Ceres
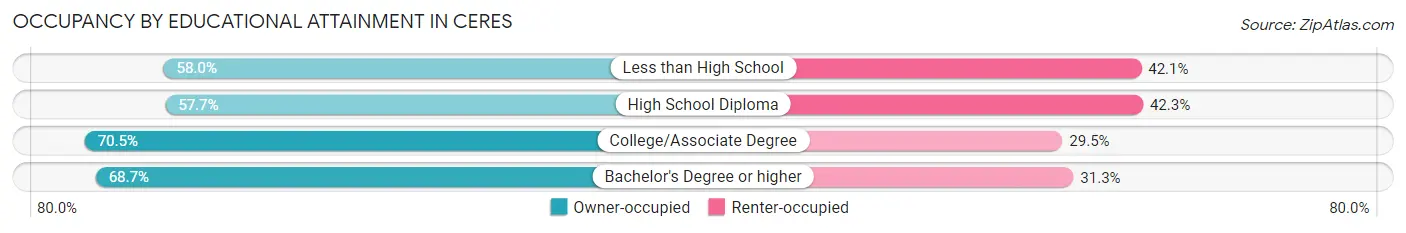
| Household Size | Owner-occupied | Renter-occupied |
| Less than High School | 1,833 (58.0%) | 1,330 (42.0%) |
| High School Diploma | 2,466 (57.7%) | 1,809 (42.3%) |
| College/Associate Degree | 3,096 (70.5%) | 1,298 (29.5%) |
| Bachelor's Degree or higher | 1,180 (68.7%) | 537 (31.3%) |
Occupancy by Age of Householder in Ceres
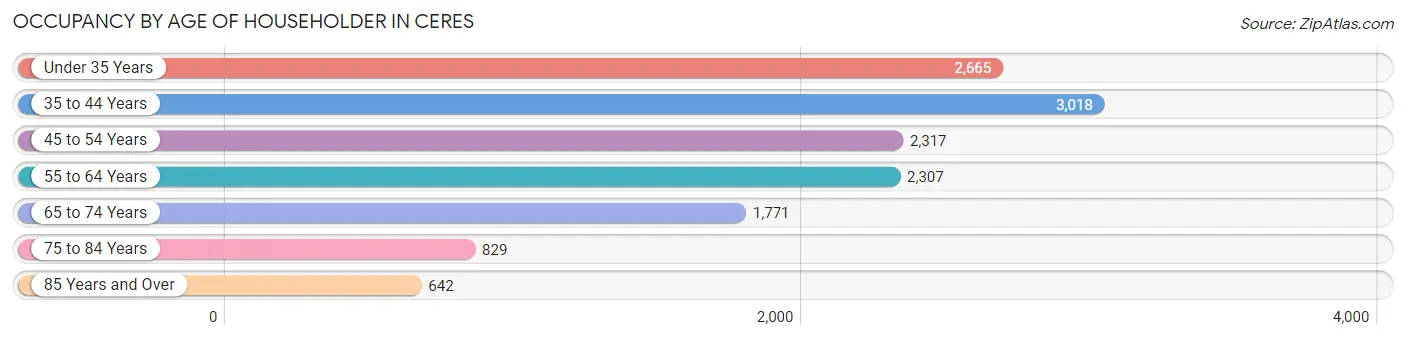
| Age Bracket | # Households | % Households |
| Under 35 Years | 2,665 | 19.7% |
| 35 to 44 Years | 3,018 | 22.3% |
| 45 to 54 Years | 2,317 | 17.1% |
| 55 to 64 Years | 2,307 | 17.0% |
| 65 to 74 Years | 1,771 | 13.1% |
| 75 to 84 Years | 829 | 6.1% |
| 85 Years and Over | 642 | 4.7% |
| Total | 13,549 | 100.0% |
Housing Finances in Ceres
Median Income by Occupancy in Ceres
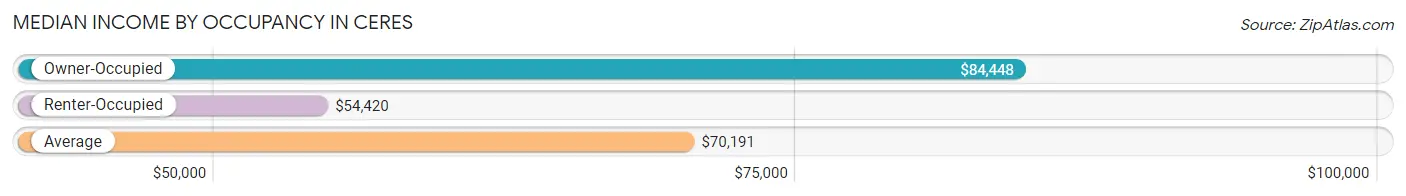
| Occupancy Type | # Households | Median Income |
| Owner-Occupied | 8,575 (63.3%) | $84,448 |
| Renter-Occupied | 4,974 (36.7%) | $54,420 |
| Average | 13,549 (100.0%) | $70,191 |
Occupancy by Householder Income Bracket in Ceres
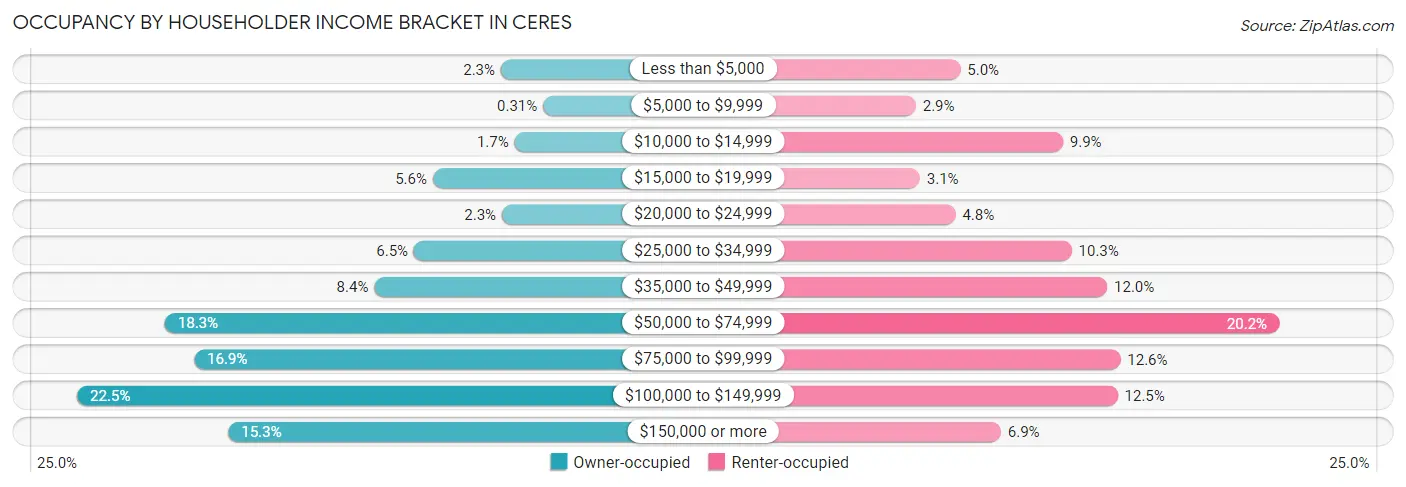
| Income Bracket | Owner-occupied | Renter-occupied |
| Less than $5,000 | 199 (2.3%) | 248 (5.0%) |
| $5,000 to $9,999 | 27 (0.3%) | 143 (2.9%) |
| $10,000 to $14,999 | 143 (1.7%) | 491 (9.9%) |
| $15,000 to $19,999 | 477 (5.6%) | 152 (3.1%) |
| $20,000 to $24,999 | 195 (2.3%) | 237 (4.8%) |
| $25,000 to $34,999 | 554 (6.5%) | 512 (10.3%) |
| $35,000 to $49,999 | 716 (8.4%) | 596 (12.0%) |
| $50,000 to $74,999 | 1,571 (18.3%) | 1,003 (20.2%) |
| $75,000 to $99,999 | 1,452 (16.9%) | 627 (12.6%) |
| $100,000 to $149,999 | 1,929 (22.5%) | 621 (12.5%) |
| $150,000 or more | 1,312 (15.3%) | 344 (6.9%) |
| Total | 8,575 (100.0%) | 4,974 (100.0%) |
Monthly Housing Cost Tiers in Ceres
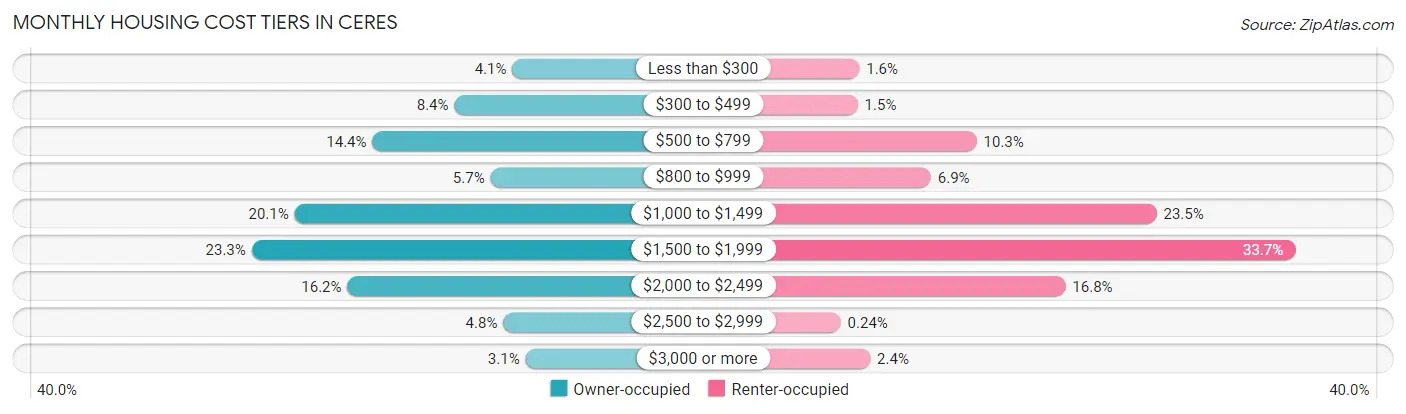
| Monthly Cost | Owner-occupied | Renter-occupied |
| Less than $300 | 350 (4.1%) | 80 (1.6%) |
| $300 to $499 | 716 (8.4%) | 74 (1.5%) |
| $500 to $799 | 1,234 (14.4%) | 510 (10.2%) |
| $800 to $999 | 488 (5.7%) | 342 (6.9%) |
| $1,000 to $1,499 | 1,725 (20.1%) | 1,169 (23.5%) |
| $1,500 to $1,999 | 1,996 (23.3%) | 1,676 (33.7%) |
| $2,000 to $2,499 | 1,392 (16.2%) | 835 (16.8%) |
| $2,500 to $2,999 | 407 (4.8%) | 12 (0.2%) |
| $3,000 or more | 267 (3.1%) | 120 (2.4%) |
| Total | 8,575 (100.0%) | 4,974 (100.0%) |
Physical Housing Characteristics in Ceres
Housing Structures in Ceres
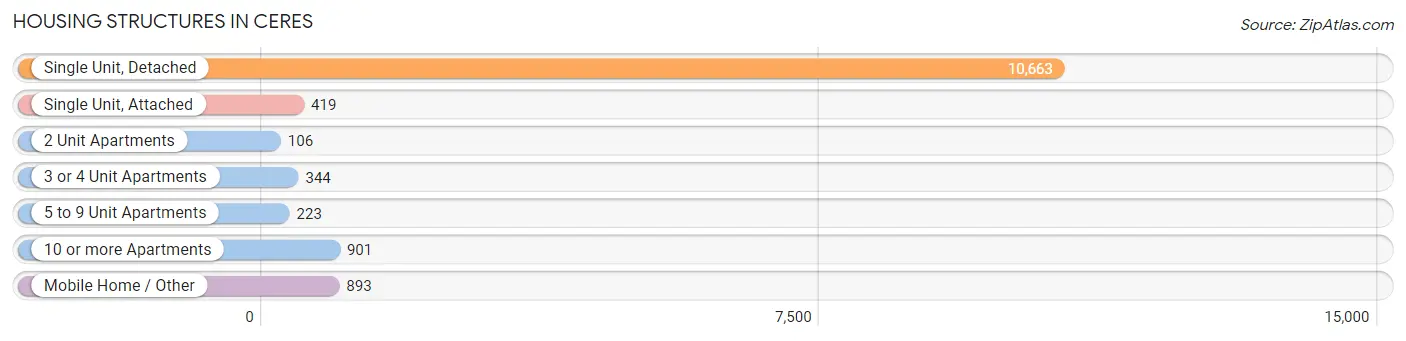
| Structure Type | # Housing Units | % Housing Units |
| Single Unit, Detached | 10,663 | 78.7% |
| Single Unit, Attached | 419 | 3.1% |
| 2 Unit Apartments | 106 | 0.8% |
| 3 or 4 Unit Apartments | 344 | 2.5% |
| 5 to 9 Unit Apartments | 223 | 1.7% |
| 10 or more Apartments | 901 | 6.7% |
| Mobile Home / Other | 893 | 6.6% |
| Total | 13,549 | 100.0% |
Housing Structures by Occupancy in Ceres
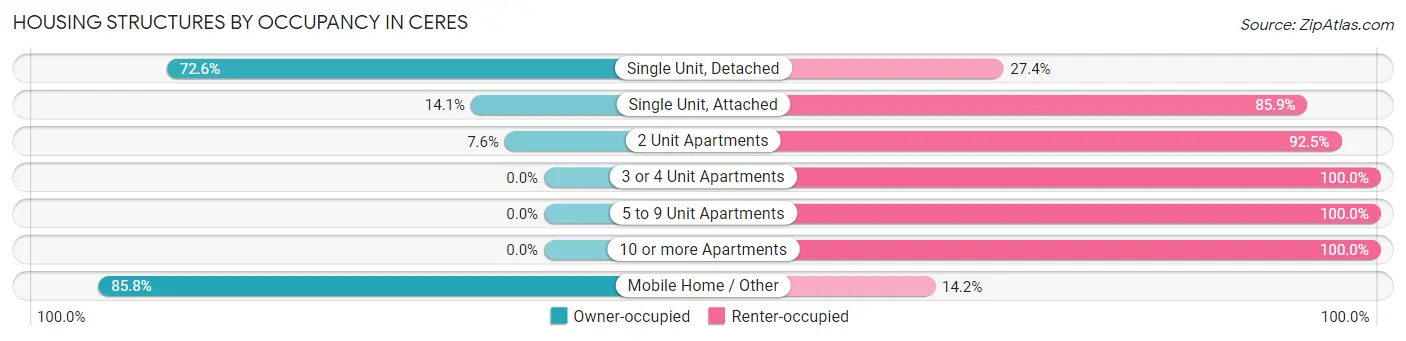
| Structure Type | Owner-occupied | Renter-occupied |
| Single Unit, Detached | 7,742 (72.6%) | 2,921 (27.4%) |
| Single Unit, Attached | 59 (14.1%) | 360 (85.9%) |
| 2 Unit Apartments | 8 (7.5%) | 98 (92.4%) |
| 3 or 4 Unit Apartments | 0 (0.0%) | 344 (100.0%) |
| 5 to 9 Unit Apartments | 0 (0.0%) | 223 (100.0%) |
| 10 or more Apartments | 0 (0.0%) | 901 (100.0%) |
| Mobile Home / Other | 766 (85.8%) | 127 (14.2%) |
| Total | 8,575 (63.3%) | 4,974 (36.7%) |
Housing Structures by Number of Rooms in Ceres
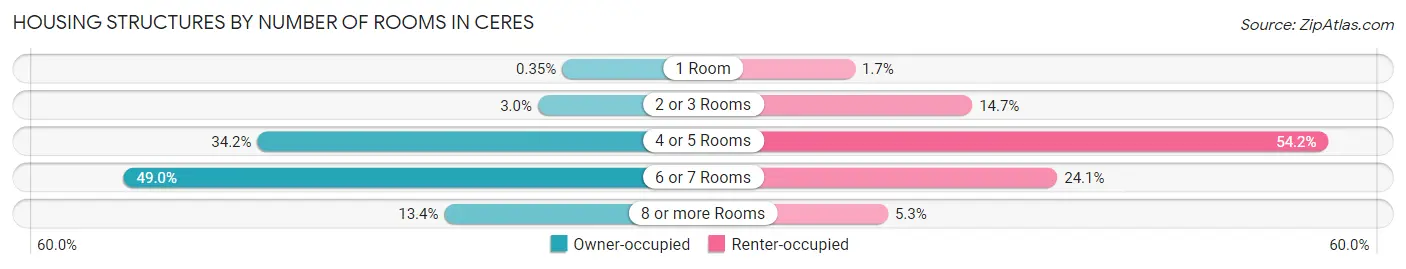
| Number of Rooms | Owner-occupied | Renter-occupied |
| 1 Room | 30 (0.4%) | 83 (1.7%) |
| 2 or 3 Rooms | 261 (3.0%) | 730 (14.7%) |
| 4 or 5 Rooms | 2,930 (34.2%) | 2,696 (54.2%) |
| 6 or 7 Rooms | 4,203 (49.0%) | 1,200 (24.1%) |
| 8 or more Rooms | 1,151 (13.4%) | 265 (5.3%) |
| Total | 8,575 (100.0%) | 4,974 (100.0%) |
Housing Structure by Heating Type in Ceres
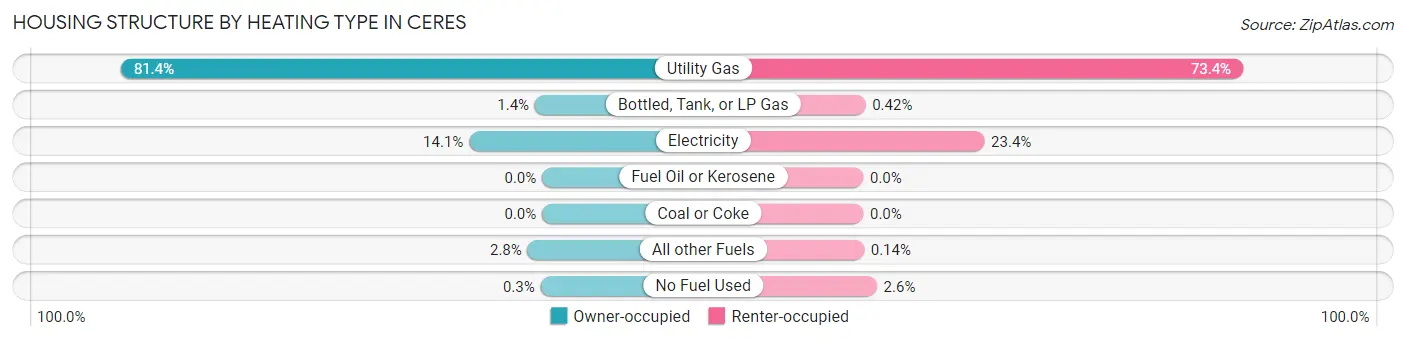
| Heating Type | Owner-occupied | Renter-occupied |
| Utility Gas | 6,981 (81.4%) | 3,651 (73.4%) |
| Bottled, Tank, or LP Gas | 119 (1.4%) | 21 (0.4%) |
| Electricity | 1,209 (14.1%) | 1,164 (23.4%) |
| Fuel Oil or Kerosene | 0 (0.0%) | 0 (0.0%) |
| Coal or Coke | 0 (0.0%) | 0 (0.0%) |
| All other Fuels | 240 (2.8%) | 7 (0.1%) |
| No Fuel Used | 26 (0.3%) | 131 (2.6%) |
| Total | 8,575 (100.0%) | 4,974 (100.0%) |
Household Vehicle Usage in Ceres
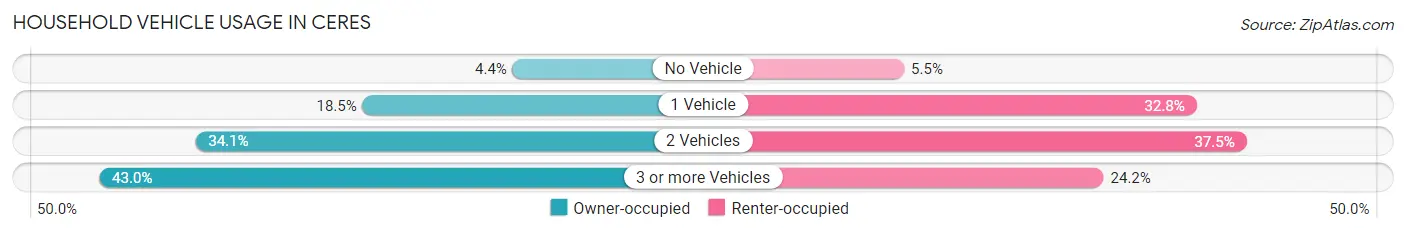
| Vehicles per Household | Owner-occupied | Renter-occupied |
| No Vehicle | 381 (4.4%) | 275 (5.5%) |
| 1 Vehicle | 1,582 (18.4%) | 1,633 (32.8%) |
| 2 Vehicles | 2,921 (34.1%) | 1,865 (37.5%) |
| 3 or more Vehicles | 3,691 (43.0%) | 1,201 (24.1%) |
| Total | 8,575 (100.0%) | 4,974 (100.0%) |
Real Estate & Mortgages in Ceres
Real Estate and Mortgage Overview in Ceres
| Characteristic | Without Mortgage | With Mortgage |
| Housing Units | 2,989 | 5,586 |
| Median Property Value | $314,200 | $379,900 |
| Median Household Income | $70,156 | $919 |
| Monthly Housing Costs | $612 | $267 |
| Real Estate Taxes | $1,703 | $109 |
Property Value by Mortgage Status in Ceres
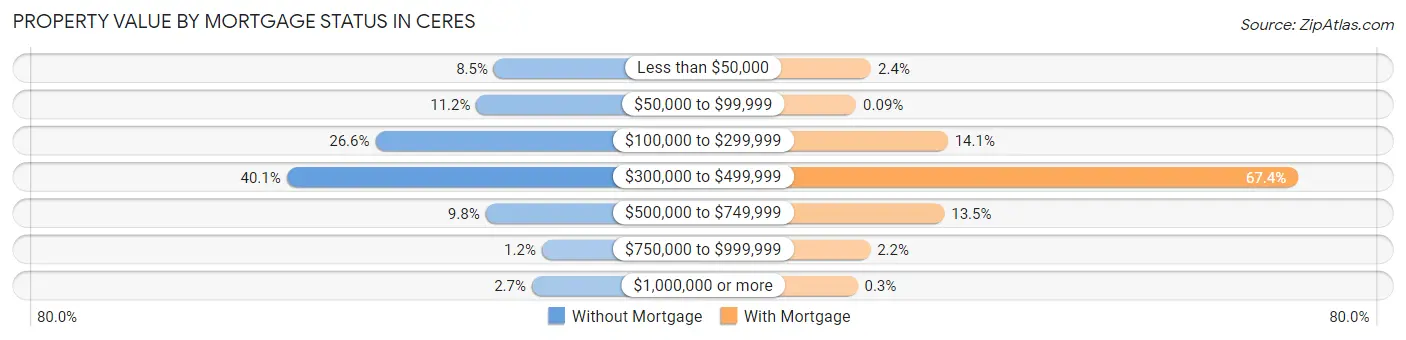
| Property Value | Without Mortgage | With Mortgage |
| Less than $50,000 | 254 (8.5%) | 133 (2.4%) |
| $50,000 to $99,999 | 334 (11.2%) | 5 (0.1%) |
| $100,000 to $299,999 | 794 (26.6%) | 785 (14.1%) |
| $300,000 to $499,999 | 1,198 (40.1%) | 3,766 (67.4%) |
| $500,000 to $749,999 | 292 (9.8%) | 755 (13.5%) |
| $750,000 to $999,999 | 36 (1.2%) | 125 (2.2%) |
| $1,000,000 or more | 81 (2.7%) | 17 (0.3%) |
| Total | 2,989 (100.0%) | 5,586 (100.0%) |
Household Income by Mortgage Status in Ceres
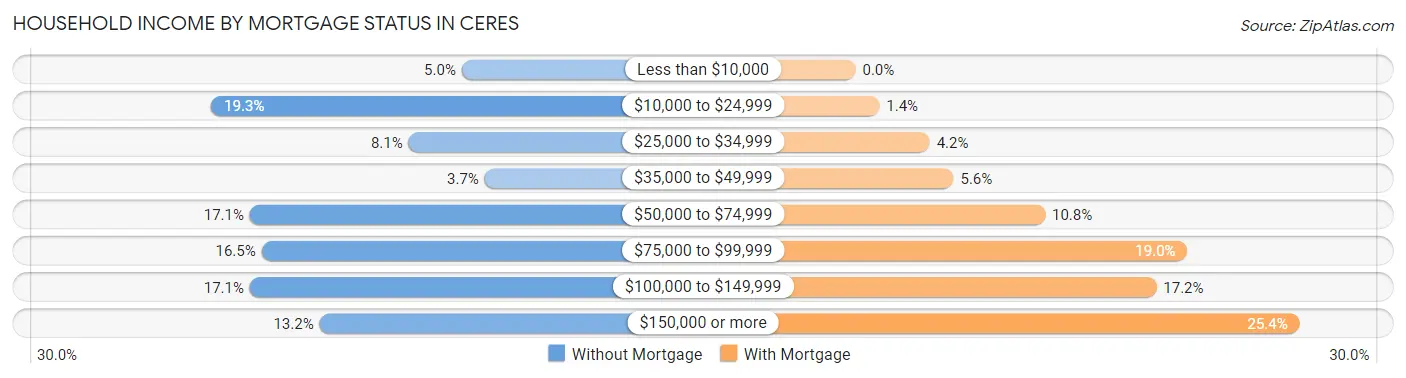
| Household Income | Without Mortgage | With Mortgage |
| Less than $10,000 | 150 (5.0%) | 0 (0.0%) |
| $10,000 to $24,999 | 578 (19.3%) | 76 (1.4%) |
| $25,000 to $34,999 | 241 (8.1%) | 237 (4.2%) |
| $35,000 to $49,999 | 111 (3.7%) | 313 (5.6%) |
| $50,000 to $74,999 | 512 (17.1%) | 605 (10.8%) |
| $75,000 to $99,999 | 492 (16.5%) | 1,059 (19.0%) |
| $100,000 to $149,999 | 512 (17.1%) | 960 (17.2%) |
| $150,000 or more | 393 (13.2%) | 1,417 (25.4%) |
| Total | 2,989 (100.0%) | 5,586 (100.0%) |
Property Value to Household Income Ratio in Ceres
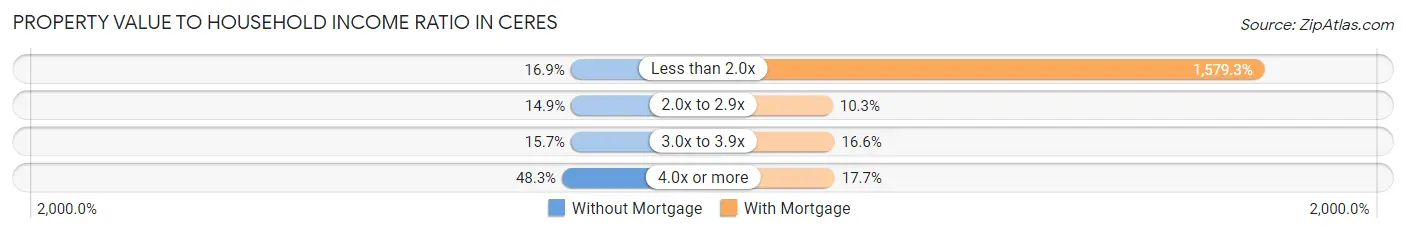
| Value-to-Income Ratio | Without Mortgage | With Mortgage |
| Less than 2.0x | 505 (16.9%) | 88,217 (1,579.3%) |
| 2.0x to 2.9x | 445 (14.9%) | 577 (10.3%) |
| 3.0x to 3.9x | 470 (15.7%) | 928 (16.6%) |
| 4.0x or more | 1,443 (48.3%) | 987 (17.7%) |
| Total | 2,989 (100.0%) | 5,586 (100.0%) |
Real Estate Taxes by Mortgage Status in Ceres
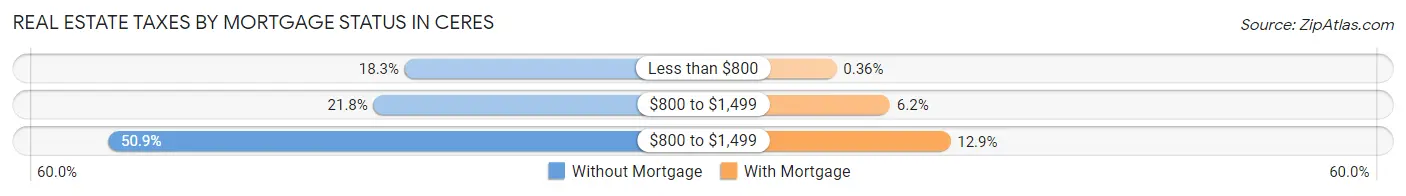
| Property Taxes | Without Mortgage | With Mortgage |
| Less than $800 | 548 (18.3%) | 20 (0.4%) |
| $800 to $1,499 | 650 (21.7%) | 348 (6.2%) |
| $800 to $1,499 | 1,520 (50.8%) | 718 (12.9%) |
| Total | 2,989 (100.0%) | 5,586 (100.0%) |
Health & Disability in Ceres
Health Insurance Coverage by Age in Ceres
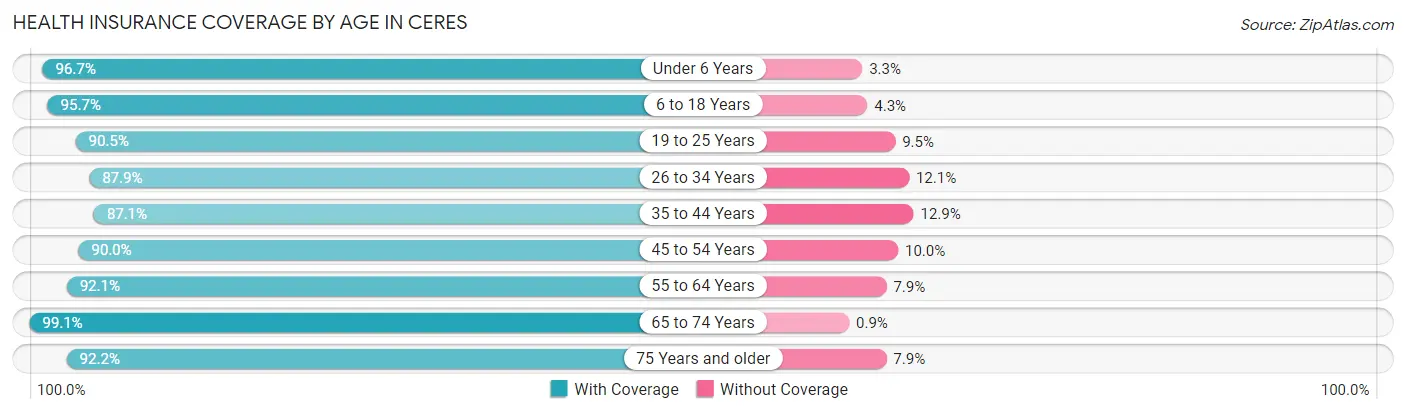
| Age Bracket | With Coverage | Without Coverage |
| Under 6 Years | 3,877 (96.7%) | 134 (3.3%) |
| 6 to 18 Years | 10,096 (95.7%) | 454 (4.3%) |
| 19 to 25 Years | 4,647 (90.5%) | 488 (9.5%) |
| 26 to 34 Years | 5,858 (87.9%) | 803 (12.1%) |
| 35 to 44 Years | 5,942 (87.1%) | 881 (12.9%) |
| 45 to 54 Years | 4,316 (90.0%) | 481 (10.0%) |
| 55 to 64 Years | 4,629 (92.1%) | 395 (7.9%) |
| 65 to 74 Years | 3,303 (99.1%) | 30 (0.9%) |
| 75 Years and older | 2,231 (92.1%) | 190 (7.9%) |
| Total | 44,899 (92.1%) | 3,856 (7.9%) |
Health Insurance Coverage by Citizenship Status in Ceres
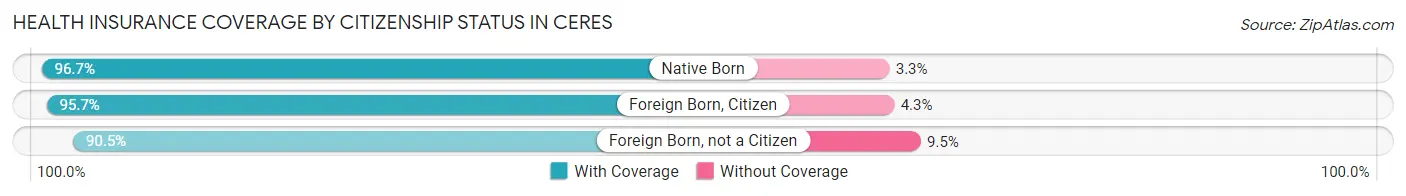
| Citizenship Status | With Coverage | Without Coverage |
| Native Born | 3,877 (96.7%) | 134 (3.3%) |
| Foreign Born, Citizen | 10,096 (95.7%) | 454 (4.3%) |
| Foreign Born, not a Citizen | 4,647 (90.5%) | 488 (9.5%) |
Health Insurance Coverage by Household Income in Ceres
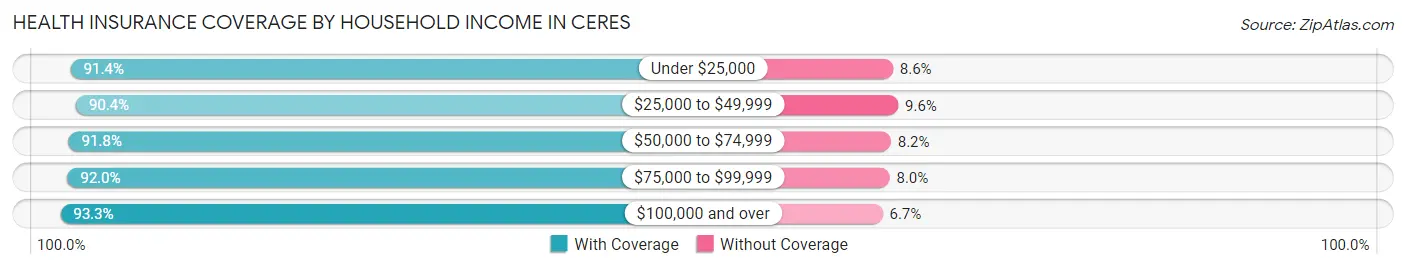
| Household Income | With Coverage | Without Coverage |
| Under $25,000 | 4,701 (91.4%) | 444 (8.6%) |
| $25,000 to $49,999 | 6,708 (90.4%) | 713 (9.6%) |
| $50,000 to $74,999 | 8,892 (91.8%) | 799 (8.2%) |
| $75,000 to $99,999 | 7,147 (92.0%) | 622 (8.0%) |
| $100,000 and over | 17,259 (93.3%) | 1,239 (6.7%) |
Public vs Private Health Insurance Coverage by Age in Ceres
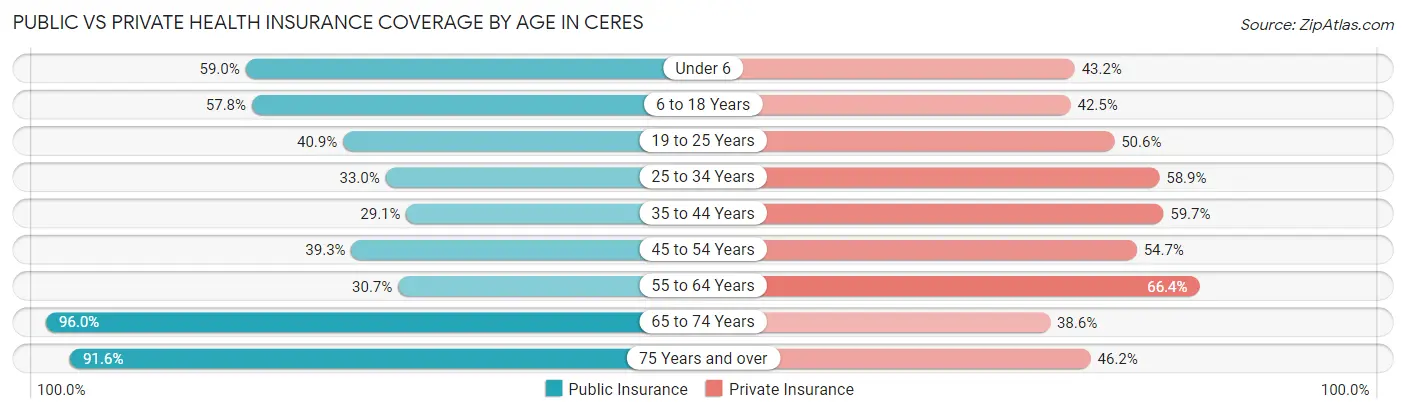
| Age Bracket | Public Insurance | Private Insurance |
| Under 6 | 2,366 (59.0%) | 1,734 (43.2%) |
| 6 to 18 Years | 6,100 (57.8%) | 4,480 (42.5%) |
| 19 to 25 Years | 2,100 (40.9%) | 2,597 (50.6%) |
| 25 to 34 Years | 2,198 (33.0%) | 3,925 (58.9%) |
| 35 to 44 Years | 1,988 (29.1%) | 4,072 (59.7%) |
| 45 to 54 Years | 1,887 (39.3%) | 2,626 (54.7%) |
| 55 to 64 Years | 1,541 (30.7%) | 3,334 (66.4%) |
| 65 to 74 Years | 3,201 (96.0%) | 1,288 (38.6%) |
| 75 Years and over | 2,217 (91.6%) | 1,118 (46.2%) |
| Total | 23,598 (48.4%) | 25,174 (51.6%) |
Disability Status by Sex by Age in Ceres
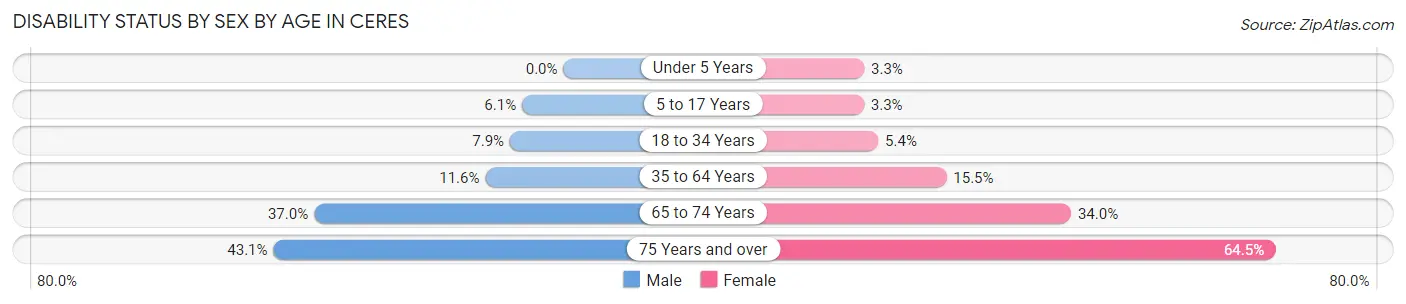
| Age Bracket | Male | Female |
| Under 5 Years | 0 (0.0%) | 56 (3.3%) |
| 5 to 17 Years | 340 (6.1%) | 172 (3.3%) |
| 18 to 34 Years | 561 (7.9%) | 283 (5.4%) |
| 35 to 64 Years | 955 (11.6%) | 1,305 (15.5%) |
| 65 to 74 Years | 628 (37.0%) | 557 (34.0%) |
| 75 Years and over | 565 (43.1%) | 715 (64.5%) |
Disability Class by Sex by Age in Ceres
Disability Class: Hearing Difficulty
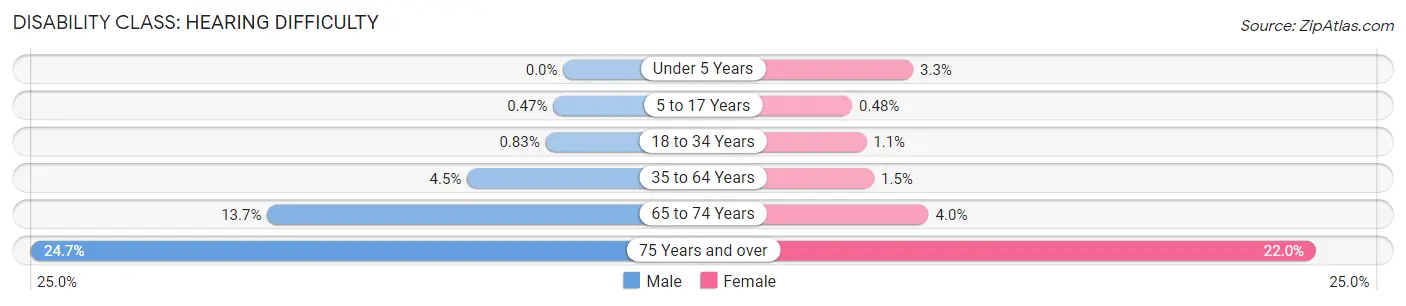
| Age Bracket | Male | Female |
| Under 5 Years | 0 (0.0%) | 56 (3.3%) |
| 5 to 17 Years | 26 (0.5%) | 25 (0.5%) |
| 18 to 34 Years | 59 (0.8%) | 60 (1.1%) |
| 35 to 64 Years | 368 (4.5%) | 126 (1.5%) |
| 65 to 74 Years | 233 (13.7%) | 66 (4.0%) |
| 75 Years and over | 324 (24.7%) | 244 (22.0%) |
Disability Class: Vision Difficulty
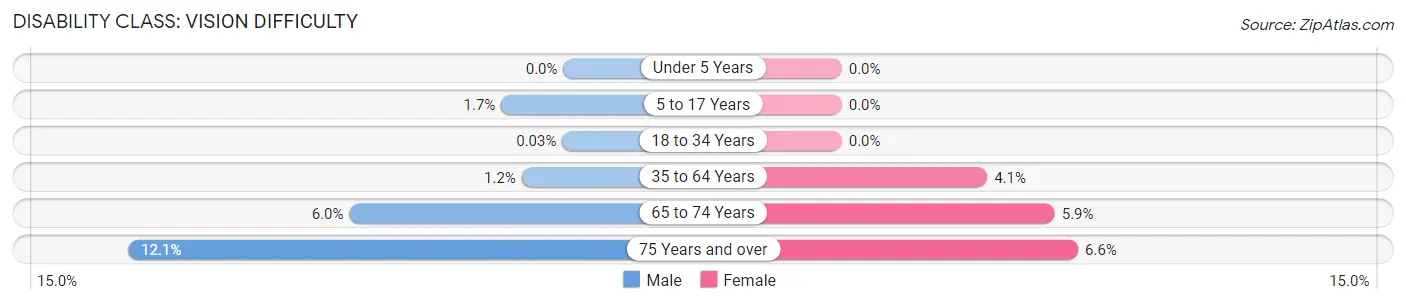
| Age Bracket | Male | Female |
| Under 5 Years | 0 (0.0%) | 0 (0.0%) |
| 5 to 17 Years | 96 (1.7%) | 0 (0.0%) |
| 18 to 34 Years | 2 (0.0%) | 0 (0.0%) |
| 35 to 64 Years | 96 (1.2%) | 340 (4.1%) |
| 65 to 74 Years | 101 (6.0%) | 97 (5.9%) |
| 75 Years and over | 159 (12.1%) | 73 (6.6%) |
Disability Class: Cognitive Difficulty
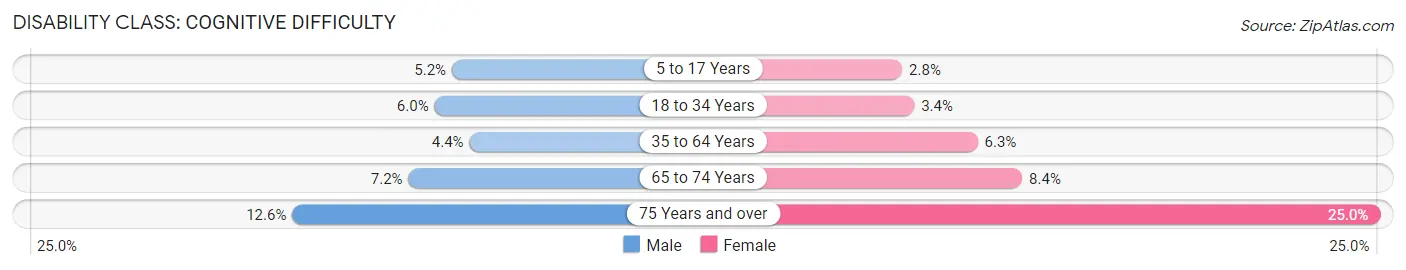
| Age Bracket | Male | Female |
| 5 to 17 Years | 286 (5.2%) | 147 (2.8%) |
| 18 to 34 Years | 423 (6.0%) | 176 (3.4%) |
| 35 to 64 Years | 359 (4.4%) | 529 (6.3%) |
| 65 to 74 Years | 122 (7.2%) | 137 (8.4%) |
| 75 Years and over | 165 (12.6%) | 277 (25.0%) |
Disability Class: Ambulatory Difficulty
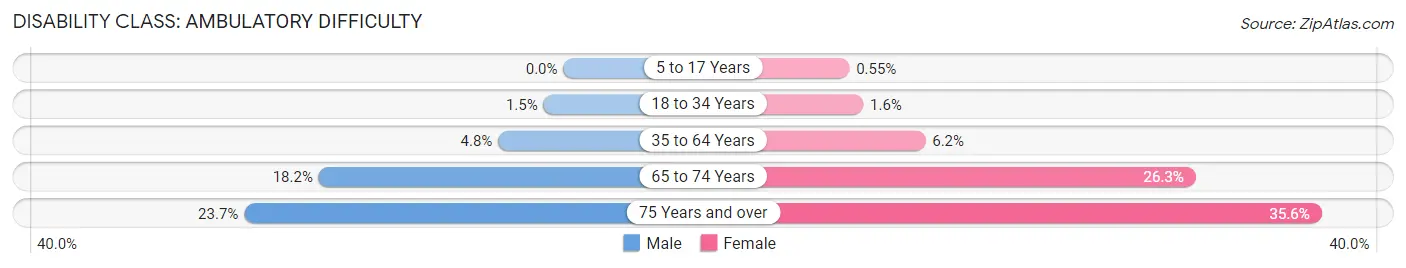
| Age Bracket | Male | Female |
| 5 to 17 Years | 0 (0.0%) | 29 (0.5%) |
| 18 to 34 Years | 104 (1.5%) | 83 (1.6%) |
| 35 to 64 Years | 399 (4.8%) | 521 (6.2%) |
| 65 to 74 Years | 308 (18.2%) | 430 (26.3%) |
| 75 Years and over | 311 (23.7%) | 395 (35.6%) |
Disability Class: Self-Care Difficulty
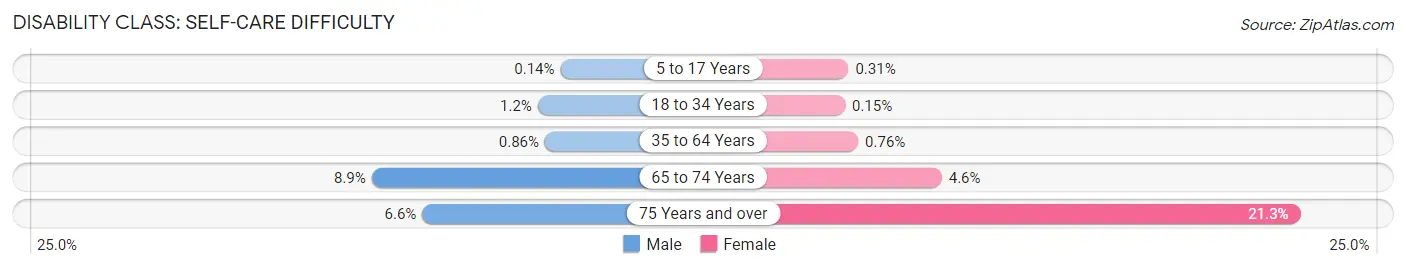
| Age Bracket | Male | Female |
| 5 to 17 Years | 8 (0.1%) | 16 (0.3%) |
| 18 to 34 Years | 84 (1.2%) | 8 (0.2%) |
| 35 to 64 Years | 71 (0.9%) | 64 (0.8%) |
| 65 to 74 Years | 151 (8.9%) | 76 (4.6%) |
| 75 Years and over | 86 (6.6%) | 236 (21.3%) |
Technology Access in Ceres
Computing Device Access in Ceres
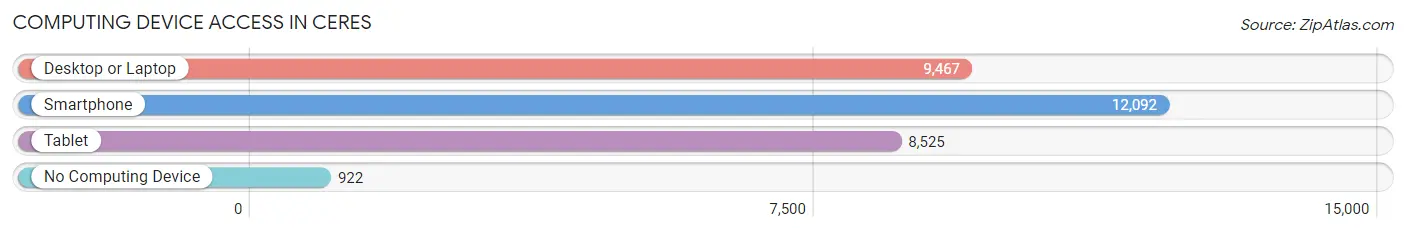
| Device Type | # Households | % Households |
| Desktop or Laptop | 9,467 | 69.9% |
| Smartphone | 12,092 | 89.2% |
| Tablet | 8,525 | 62.9% |
| No Computing Device | 922 | 6.8% |
| Total | 13,549 | 100.0% |
Internet Access in Ceres
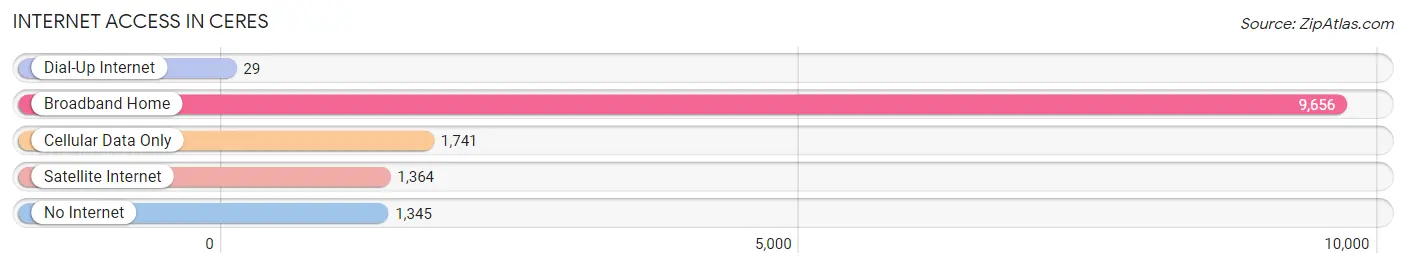
| Internet Type | # Households | % Households |
| Dial-Up Internet | 29 | 0.2% |
| Broadband Home | 9,656 | 71.3% |
| Cellular Data Only | 1,741 | 12.9% |
| Satellite Internet | 1,364 | 10.1% |
| No Internet | 1,345 | 9.9% |
| Total | 13,549 | 100.0% |
Ceres Summary
Ceres is a city located in Stanislaus County, California, United States. It is part of the Modesto Metropolitan Statistical Area. The population was 45,417 at the 2010 census, up from 34,609 at the 2000 census.
History
Ceres was founded in 1868 by a group of settlers from the nearby town of Empire. The town was named after the Roman goddess of agriculture, Ceres. The first post office was established in 1871.
The town grew slowly until the late 19th century, when the railroad arrived. This brought an influx of new settlers and businesses, and the town began to grow rapidly. By the early 20th century, Ceres had become a thriving agricultural center, with a variety of crops being grown in the surrounding area.
Geography
Ceres is located at 37°37'25" North, 120°59'17" West (37.623, -120.988). It is situated in the Central Valley of California, approximately 10 miles (16 km) south of Modesto and about 70 miles (110 km) east of San Francisco.
The city covers an area of 8.3 square miles (21.5 km2), of which 8.2 square miles (21.3 km2) is land and 0.1 square miles (0.2 km2) is water.
Economy
Ceres is a major agricultural center, with a variety of crops being grown in the surrounding area. The city is home to a number of food processing plants, including a cannery, a frozen food plant, and a juice plant.
The city is also home to a number of light industrial businesses, including a plastics plant, a metal fabrication plant, and a printing plant.
Demographics
As of the 2010 census, there were 45,417 people, 15,845 households, and 11,845 families residing in the city. The population density was 5,521.3 people per square mile (2,133.2/km2). There were 16,845 housing units at an average density of 2,053.2 per square mile (792.3/km2).
The racial makeup of the city was 57.2% White, 4.2% African American, 1.2% Native American, 2.3% Asian, 0.3% Pacific Islander, 30.7% from other races, and 4.2% from two or more races. Hispanic or Latino of any race were 57.2% of the population.
The median income for a household in the city was $41,945, and the median income for a family was $48,945. Males had a median income of $37,945 versus $30,945 for females. The per capita income for the city was $17,945. About 14.2% of families and 17.7% of the population were below the poverty line, including 25.2% of those under age 18 and 8.2% of those age 65 or over.
Common Questions
What is Per Capita Income in Ceres?
Per Capita income in Ceres is $24,176.
What is the Median Family Income in Ceres?
Median Family Income in Ceres is $76,871.
What is the Median Household income in Ceres?
Median Household Income in Ceres is $70,191.
What is Income or Wage Gap in Ceres?
Income or Wage Gap in Ceres is 32.9%.
Women in Ceres earn 67.1 cents for every dollar earned by a man.
What is Family Income Deficit in Ceres?
Family Income Deficit in Ceres is $13,104.
Families that are below poverty line in Ceres earn $13,104 less on average than the poverty threshold level.
What is Inequality or Gini Index in Ceres?
Inequality or Gini Index in Ceres is 0.41.
What is the Total Population of Ceres?
Total Population of Ceres is 49,183.
What is the Total Male Population of Ceres?
Total Male Population of Ceres is 25,810.
What is the Total Female Population of Ceres?
Total Female Population of Ceres is 23,373.
What is the Ratio of Males per 100 Females in Ceres?
There are 110.43 Males per 100 Females in Ceres.
What is the Ratio of Females per 100 Males in Ceres?
There are 90.56 Females per 100 Males in Ceres.
What is the Median Population Age in Ceres?
Median Population Age in Ceres is 32.3 Years.
What is the Average Family Size in Ceres
Average Family Size in Ceres is 4.0 People.
What is the Average Household Size in Ceres
Average Household Size in Ceres is 3.6 People.
How Large is the Labor Force in Ceres?
There are 21,785 People in the Labor Forcein in Ceres.
What is the Percentage of People in the Labor Force in Ceres?
59.5% of People are in the Labor Force in Ceres.
What is the Unemployment Rate in Ceres?
Unemployment Rate in Ceres is 10.5%.