Cities with the Most Immigrants from Mexico in Kansas
RELATED REPORTS & OPTIONS
Mexico
Kansas
Compare Cities
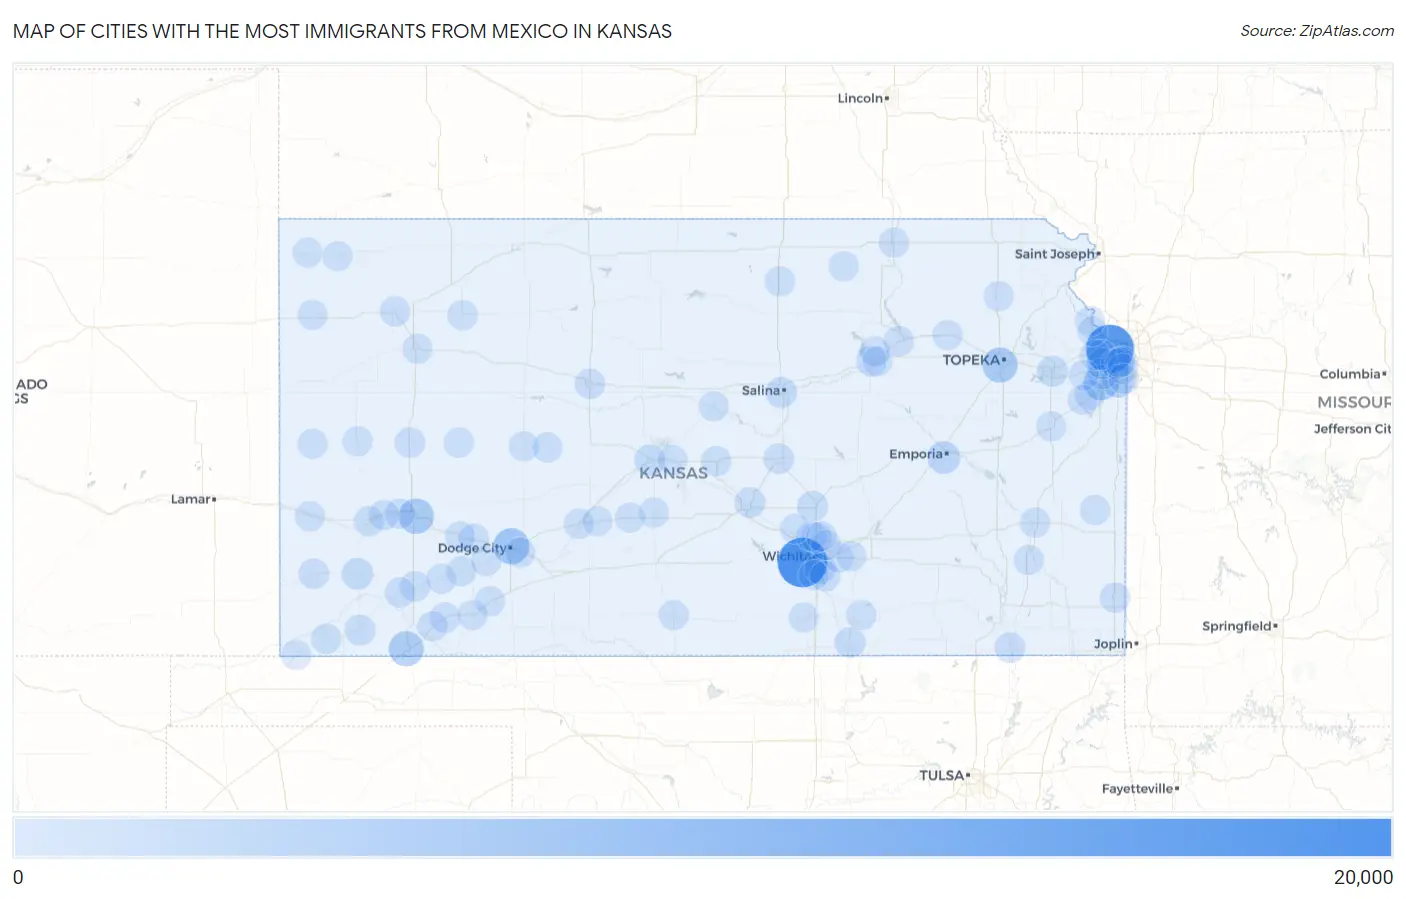
Map of Cities with the Most Immigrants from Mexico in Kansas
0
20,000
Cities with the Most Immigrants from Mexico in Kansas
| City | Mexico | vs State | vs National | |
| 1. | Wichita | 16,527 | 81,282(20.33%)#1 | 10,767,104(0.15%)#84 |
| 2. | Kansas City | 15,212 | 81,282(18.72%)#2 | 10,767,104(0.14%)#98 |
| 3. | Dodge City | 4,901 | 81,282(6.03%)#3 | 10,767,104(0.05%)#320 |
| 4. | Olathe | 4,263 | 81,282(5.24%)#4 | 10,767,104(0.04%)#362 |
| 5. | Garden City | 4,227 | 81,282(5.20%)#5 | 10,767,104(0.04%)#365 |
| 6. | Topeka | 4,090 | 81,282(5.03%)#6 | 10,767,104(0.04%)#381 |
| 7. | Liberal | 3,895 | 81,282(4.79%)#7 | 10,767,104(0.04%)#403 |
| 8. | Overland Park | 2,120 | 81,282(2.61%)#8 | 10,767,104(0.02%)#681 |
| 9. | Emporia | 2,035 | 81,282(2.50%)#9 | 10,767,104(0.02%)#701 |
| 10. | Ulysses | 1,154 | 81,282(1.42%)#10 | 10,767,104(0.01%)#1,054 |
| 11. | Lenexa | 876 | 81,282(1.08%)#11 | 10,767,104(0.01%)#1,292 |
| 12. | Shawnee | 842 | 81,282(1.04%)#12 | 10,767,104(0.01%)#1,325 |
| 13. | Lawrence | 814 | 81,282(1.00%)#13 | 10,767,104(0.01%)#1,363 |
| 14. | Great Bend | 803 | 81,282(0.99%)#14 | 10,767,104(0.01%)#1,378 |
| 15. | Salina | 777 | 81,282(0.96%)#15 | 10,767,104(0.01%)#1,410 |
| 16. | Hutchinson | 562 | 81,282(0.69%)#16 | 10,767,104(0.01%)#1,774 |
| 17. | Hugoton | 558 | 81,282(0.69%)#17 | 10,767,104(0.01%)#1,781 |
| 18. | Newton | 474 | 81,282(0.58%)#18 | 10,767,104(0.00%)#1,995 |
| 19. | Arkansas City | 471 | 81,282(0.58%)#19 | 10,767,104(0.00%)#2,003 |
| 20. | Oaklawn Sunview | 453 | 81,282(0.56%)#20 | 10,767,104(0.00%)#2,051 |
| 21. | Manhattan | 373 | 81,282(0.46%)#21 | 10,767,104(0.00%)#2,332 |
| 22. | Junction City | 370 | 81,282(0.46%)#22 | 10,767,104(0.00%)#2,344 |
| 23. | Mcpherson | 352 | 81,282(0.43%)#23 | 10,767,104(0.00%)#2,409 |
| 24. | Sublette | 342 | 81,282(0.42%)#24 | 10,767,104(0.00%)#2,465 |
| 25. | Johnson City | 323 | 81,282(0.40%)#25 | 10,767,104(0.00%)#2,549 |
| 26. | Plains | 298 | 81,282(0.37%)#26 | 10,767,104(0.00%)#2,685 |
| 27. | Scott City | 293 | 81,282(0.36%)#27 | 10,767,104(0.00%)#2,716 |
| 28. | Derby | 288 | 81,282(0.35%)#28 | 10,767,104(0.00%)#2,747 |
| 29. | Park City | 262 | 81,282(0.32%)#29 | 10,767,104(0.00%)#2,899 |
| 30. | Bonner Springs | 252 | 81,282(0.31%)#30 | 10,767,104(0.00%)#2,961 |
| 31. | Pittsburg | 244 | 81,282(0.30%)#31 | 10,767,104(0.00%)#3,011 |
| 32. | Colby | 205 | 81,282(0.25%)#32 | 10,767,104(0.00%)#3,284 |
| 33. | Gardner | 204 | 81,282(0.25%)#33 | 10,767,104(0.00%)#3,289 |
| 34. | Holcomb | 204 | 81,282(0.25%)#34 | 10,767,104(0.00%)#3,298 |
| 35. | Rolla | 200 | 81,282(0.25%)#35 | 10,767,104(0.00%)#3,335 |
| 36. | Coffeyville | 199 | 81,282(0.24%)#36 | 10,767,104(0.00%)#3,340 |
| 37. | Hays | 196 | 81,282(0.24%)#37 | 10,767,104(0.00%)#3,372 |
| 38. | Lyons | 196 | 81,282(0.24%)#38 | 10,767,104(0.00%)#3,375 |
| 39. | Montezuma | 187 | 81,282(0.23%)#39 | 10,767,104(0.00%)#3,476 |
| 40. | Merriam | 180 | 81,282(0.22%)#40 | 10,767,104(0.00%)#3,556 |
| 41. | Edwardsville | 179 | 81,282(0.22%)#41 | 10,767,104(0.00%)#3,570 |
| 42. | Lakin | 178 | 81,282(0.22%)#42 | 10,767,104(0.00%)#3,586 |
| 43. | Satanta | 165 | 81,282(0.20%)#43 | 10,767,104(0.00%)#3,748 |
| 44. | Deerfield | 156 | 81,282(0.19%)#44 | 10,767,104(0.00%)#3,849 |
| 45. | Wilroads Gardens | 146 | 81,282(0.18%)#45 | 10,767,104(0.00%)#3,997 |
| 46. | Cimarron | 140 | 81,282(0.17%)#46 | 10,767,104(0.00%)#4,082 |
| 47. | De Soto | 134 | 81,282(0.16%)#47 | 10,767,104(0.00%)#4,139 |
| 48. | Leoti | 134 | 81,282(0.16%)#48 | 10,767,104(0.00%)#4,142 |
| 49. | Kinsley | 134 | 81,282(0.16%)#49 | 10,767,104(0.00%)#4,143 |
| 50. | Andover | 133 | 81,282(0.16%)#50 | 10,767,104(0.00%)#4,148 |
| 51. | Goodland | 114 | 81,282(0.14%)#51 | 10,767,104(0.00%)#4,476 |
| 52. | Tribune | 111 | 81,282(0.14%)#52 | 10,767,104(0.00%)#4,545 |
| 53. | Kismet | 108 | 81,282(0.13%)#53 | 10,767,104(0.00%)#4,597 |
| 54. | St John | 106 | 81,282(0.13%)#54 | 10,767,104(0.00%)#4,637 |
| 55. | Ottawa | 103 | 81,282(0.13%)#55 | 10,767,104(0.00%)#4,673 |
| 56. | Syracuse | 102 | 81,282(0.13%)#56 | 10,767,104(0.00%)#4,714 |
| 57. | Valley Center | 98 | 81,282(0.12%)#57 | 10,767,104(0.00%)#4,781 |
| 58. | Ness City | 97 | 81,282(0.12%)#58 | 10,767,104(0.00%)#4,818 |
| 59. | Chanute | 91 | 81,282(0.11%)#59 | 10,767,104(0.00%)#4,932 |
| 60. | Fort Riley | 91 | 81,282(0.11%)#60 | 10,767,104(0.00%)#4,934 |
| 61. | Bel Aire | 91 | 81,282(0.11%)#61 | 10,767,104(0.00%)#4,936 |
| 62. | Winfield | 88 | 81,282(0.11%)#62 | 10,767,104(0.00%)#5,008 |
| 63. | Leavenworth | 86 | 81,282(0.11%)#63 | 10,767,104(0.00%)#5,046 |
| 64. | Concordia | 86 | 81,282(0.11%)#64 | 10,767,104(0.00%)#5,055 |
| 65. | Macksville | 80 | 81,282(0.10%)#65 | 10,767,104(0.00%)#5,227 |
| 66. | Mapleton | 80 | 81,282(0.10%)#66 | 10,767,104(0.00%)#5,228 |
| 67. | Copeland | 70 | 81,282(0.09%)#67 | 10,767,104(0.00%)#5,518 |
| 68. | Wellington | 69 | 81,282(0.08%)#68 | 10,767,104(0.00%)#5,532 |
| 69. | Lewis | 67 | 81,282(0.08%)#69 | 10,767,104(0.00%)#5,617 |
| 70. | Holton | 63 | 81,282(0.08%)#70 | 10,767,104(0.00%)#5,748 |
| 71. | Bazine | 63 | 81,282(0.08%)#71 | 10,767,104(0.00%)#5,764 |
| 72. | Meade | 57 | 81,282(0.07%)#72 | 10,767,104(0.00%)#5,977 |
| 73. | Haysville | 56 | 81,282(0.07%)#73 | 10,767,104(0.00%)#5,999 |
| 74. | St Francis | 54 | 81,282(0.07%)#74 | 10,767,104(0.00%)#6,114 |
| 75. | Hoxie | 49 | 81,282(0.06%)#75 | 10,767,104(0.00%)#6,358 |
| 76. | Dighton | 47 | 81,282(0.06%)#76 | 10,767,104(0.00%)#6,465 |
| 77. | Bird City | 47 | 81,282(0.06%)#77 | 10,767,104(0.00%)#6,467 |
| 78. | Prairie Village | 46 | 81,282(0.06%)#78 | 10,767,104(0.00%)#6,472 |
| 79. | Ellinwood | 45 | 81,282(0.06%)#79 | 10,767,104(0.00%)#6,559 |
| 80. | Roeland Park | 44 | 81,282(0.05%)#80 | 10,767,104(0.00%)#6,599 |
| 81. | Elkhart | 44 | 81,282(0.05%)#81 | 10,767,104(0.00%)#6,624 |
| 82. | Augusta | 43 | 81,282(0.05%)#82 | 10,767,104(0.00%)#6,657 |
| 83. | Linn | 43 | 81,282(0.05%)#83 | 10,767,104(0.00%)#6,695 |
| 84. | Ingalls | 42 | 81,282(0.05%)#84 | 10,767,104(0.00%)#6,765 |
| 85. | Marysville | 41 | 81,282(0.05%)#85 | 10,767,104(0.00%)#6,790 |
| 86. | Grandview Plaza | 41 | 81,282(0.05%)#86 | 10,767,104(0.00%)#6,802 |
| 87. | Bentley | 39 | 81,282(0.05%)#87 | 10,767,104(0.00%)#6,922 |
| 88. | Oakley | 38 | 81,282(0.05%)#88 | 10,767,104(0.00%)#6,959 |
| 89. | Leawood | 37 | 81,282(0.05%)#89 | 10,767,104(0.00%)#6,984 |
| 90. | Lansing | 37 | 81,282(0.05%)#90 | 10,767,104(0.00%)#6,995 |
| 91. | Medicine Lodge | 36 | 81,282(0.04%)#91 | 10,767,104(0.00%)#7,073 |
| 92. | Edgerton | 35 | 81,282(0.04%)#92 | 10,767,104(0.00%)#7,127 |
| 93. | Fowler | 34 | 81,282(0.04%)#93 | 10,767,104(0.00%)#7,218 |
| 94. | Ensign | 34 | 81,282(0.04%)#94 | 10,767,104(0.00%)#7,229 |
| 95. | Shallow Water | 34 | 81,282(0.04%)#95 | 10,767,104(0.00%)#7,231 |
| 96. | Belvue | 33 | 81,282(0.04%)#96 | 10,767,104(0.00%)#7,313 |
| 97. | Ellsworth | 31 | 81,282(0.04%)#97 | 10,767,104(0.00%)#7,398 |
| 98. | Mission | 28 | 81,282(0.03%)#98 | 10,767,104(0.00%)#7,592 |
| 99. | Kechi | 27 | 81,282(0.03%)#99 | 10,767,104(0.00%)#7,697 |
| 100. | Iola | 25 | 81,282(0.03%)#100 | 10,767,104(0.00%)#7,838 |
Common Questions
What are the Top 10 Cities with the Most Immigrants from Mexico in Kansas?
Top 10 Cities with the Most Immigrants from Mexico in Kansas are:
#1
16,527
#2
15,212
#3
4,901
#4
4,263
#5
4,227
#6
4,090
#7
3,895
#8
2,120
#9
2,035
#10
1,154
What city has the Most Immigrants from Mexico in Kansas?
Wichita has the Most Immigrants from Mexico in Kansas with 16,527.
What is the Total Immigrants from Mexico in the State of Kansas?
Total Immigrants from Mexico in Kansas is 81,282.
What is the Total Immigrants from Mexico in the United States?
Total Immigrants from Mexico in the United States is 10,767,104.