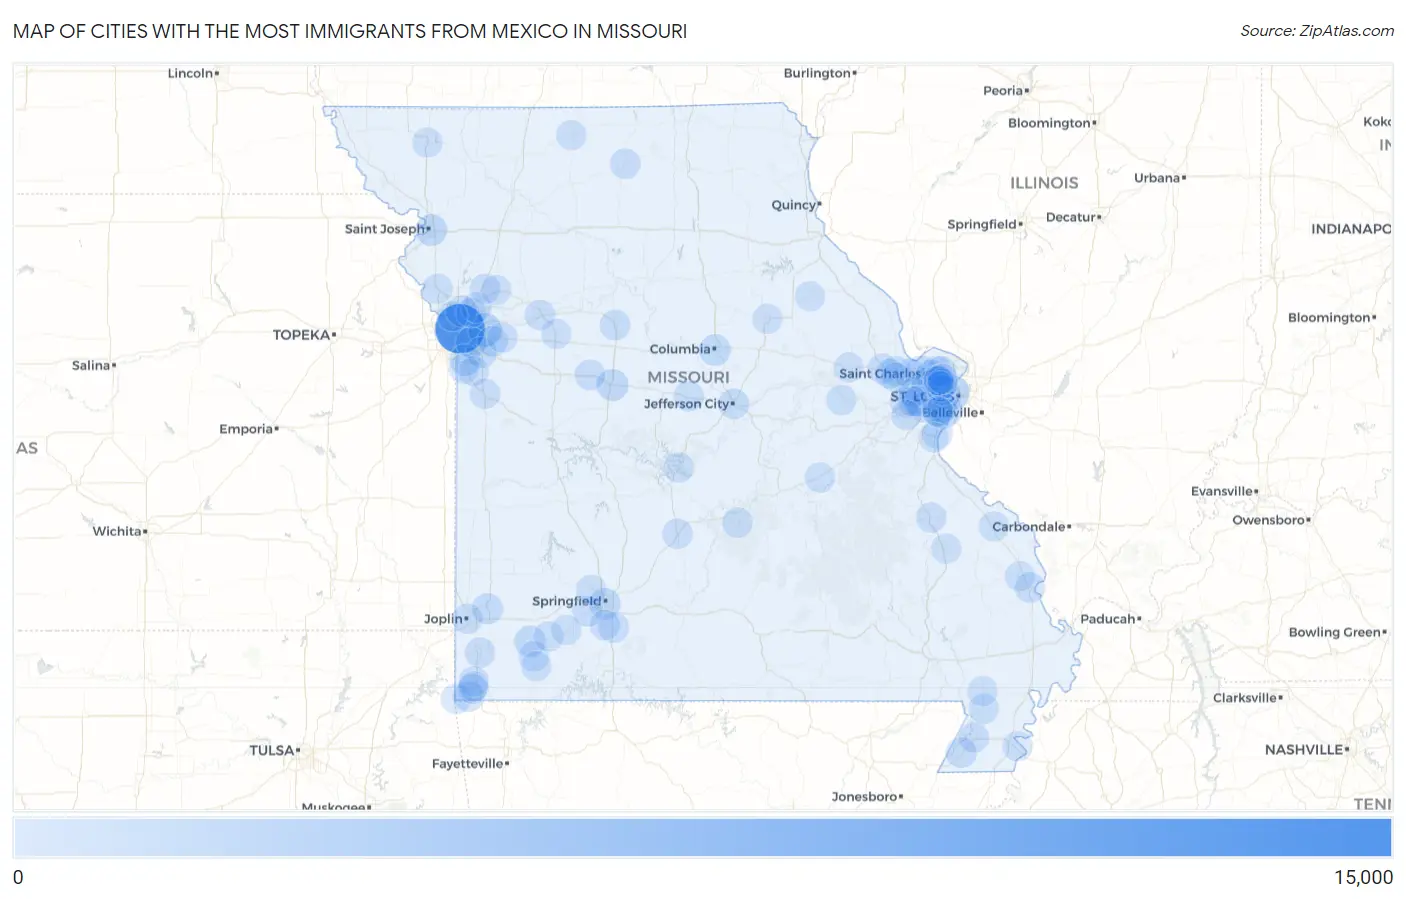
Cities with the Most Immigrants from Mexico in Missouri
RELATED REPORTS & OPTIONS
Mexico
Missouri
Compare Cities
Map of Cities with the Most Immigrants from Mexico in Missouri
0
15,000
Cities with the Most Immigrants from Mexico in Missouri
| City | Mexico | vs State | vs National | |
| 1. | Kansas City | 10,609 | 38,568(27.51%)#1 | 10,767,104(0.10%)#137 |
| 2. | St Louis | 2,082 | 38,568(5.40%)#2 | 10,767,104(0.02%)#693 |
| 3. | Independence | 1,868 | 38,568(4.84%)#3 | 10,767,104(0.02%)#752 |
| 4. | Sedalia | 949 | 38,568(2.46%)#4 | 10,767,104(0.01%)#1,214 |
| 5. | St Joseph | 837 | 38,568(2.17%)#5 | 10,767,104(0.01%)#1,330 |
| 6. | Columbia | 793 | 38,568(2.06%)#6 | 10,767,104(0.01%)#1,391 |
| 7. | Grandview | 703 | 38,568(1.82%)#7 | 10,767,104(0.01%)#1,514 |
| 8. | Springfield | 681 | 38,568(1.77%)#8 | 10,767,104(0.01%)#1,558 |
| 9. | Monett | 631 | 38,568(1.64%)#9 | 10,767,104(0.01%)#1,646 |
| 10. | St Charles | 569 | 38,568(1.48%)#10 | 10,767,104(0.01%)#1,759 |
| 11. | Lee S Summit | 502 | 38,568(1.30%)#11 | 10,767,104(0.00%)#1,921 |
| 12. | Carthage | 500 | 38,568(1.30%)#12 | 10,767,104(0.00%)#1,926 |
| 13. | Gladstone | 422 | 38,568(1.09%)#13 | 10,767,104(0.00%)#2,146 |
| 14. | Bridgeton | 388 | 38,568(1.01%)#14 | 10,767,104(0.00%)#2,273 |
| 15. | Breckenridge Hills | 347 | 38,568(0.90%)#15 | 10,767,104(0.00%)#2,439 |
| 16. | Senath | 318 | 38,568(0.82%)#16 | 10,767,104(0.00%)#2,575 |
| 17. | Noel | 310 | 38,568(0.80%)#17 | 10,767,104(0.00%)#2,615 |
| 18. | Raytown | 309 | 38,568(0.80%)#18 | 10,767,104(0.00%)#2,616 |
| 19. | Blue Springs | 308 | 38,568(0.80%)#19 | 10,767,104(0.00%)#2,627 |
| 20. | Marshall | 293 | 38,568(0.76%)#20 | 10,767,104(0.00%)#2,715 |
| 21. | Maryland Heights | 281 | 38,568(0.73%)#21 | 10,767,104(0.00%)#2,783 |
| 22. | Jefferson City | 273 | 38,568(0.71%)#22 | 10,767,104(0.00%)#2,824 |
| 23. | La Monte | 267 | 38,568(0.69%)#23 | 10,767,104(0.00%)#2,873 |
| 24. | O Fallon | 264 | 38,568(0.68%)#24 | 10,767,104(0.00%)#2,884 |
| 25. | Winchester | 259 | 38,568(0.67%)#25 | 10,767,104(0.00%)#2,923 |
| 26. | St Peters | 254 | 38,568(0.66%)#26 | 10,767,104(0.00%)#2,944 |
| 27. | Ozark | 244 | 38,568(0.63%)#27 | 10,767,104(0.00%)#3,010 |
| 28. | Hazelwood | 241 | 38,568(0.62%)#28 | 10,767,104(0.00%)#3,021 |
| 29. | Lexington | 241 | 38,568(0.62%)#29 | 10,767,104(0.00%)#3,025 |
| 30. | St Ann | 226 | 38,568(0.59%)#30 | 10,767,104(0.00%)#3,120 |
| 31. | Wentzville | 224 | 38,568(0.58%)#31 | 10,767,104(0.00%)#3,129 |
| 32. | Florissant | 213 | 38,568(0.55%)#32 | 10,767,104(0.00%)#3,207 |
| 33. | Milan | 208 | 38,568(0.54%)#33 | 10,767,104(0.00%)#3,252 |
| 34. | Cape Girardeau | 207 | 38,568(0.54%)#34 | 10,767,104(0.00%)#3,256 |
| 35. | Liberty | 193 | 38,568(0.50%)#35 | 10,767,104(0.00%)#3,397 |
| 36. | Republic | 191 | 38,568(0.50%)#36 | 10,767,104(0.00%)#3,413 |
| 37. | Neosho | 190 | 38,568(0.49%)#37 | 10,767,104(0.00%)#3,428 |
| 38. | Fort Leonard Wood | 183 | 38,568(0.47%)#38 | 10,767,104(0.00%)#3,511 |
| 39. | Southwest City | 170 | 38,568(0.44%)#39 | 10,767,104(0.00%)#3,682 |
| 40. | Valley Park | 169 | 38,568(0.44%)#40 | 10,767,104(0.00%)#3,688 |
| 41. | Purdy | 169 | 38,568(0.44%)#41 | 10,767,104(0.00%)#3,694 |
| 42. | Ballwin | 167 | 38,568(0.43%)#42 | 10,767,104(0.00%)#3,708 |
| 43. | Overland | 161 | 38,568(0.42%)#43 | 10,767,104(0.00%)#3,791 |
| 44. | Lemay | 159 | 38,568(0.41%)#44 | 10,767,104(0.00%)#3,815 |
| 45. | Joplin | 155 | 38,568(0.40%)#45 | 10,767,104(0.00%)#3,851 |
| 46. | New Haven | 155 | 38,568(0.40%)#46 | 10,767,104(0.00%)#3,866 |
| 47. | Nixa | 154 | 38,568(0.40%)#47 | 10,767,104(0.00%)#3,874 |
| 48. | Chesterfield | 151 | 38,568(0.39%)#48 | 10,767,104(0.00%)#3,909 |
| 49. | Lebanon | 146 | 38,568(0.38%)#49 | 10,767,104(0.00%)#3,989 |
| 50. | Harrisonville | 144 | 38,568(0.37%)#50 | 10,767,104(0.00%)#4,020 |
| 51. | California | 142 | 38,568(0.37%)#51 | 10,767,104(0.00%)#4,050 |
| 52. | Farmington | 137 | 38,568(0.36%)#52 | 10,767,104(0.00%)#4,109 |
| 53. | Wildwood | 133 | 38,568(0.34%)#53 | 10,767,104(0.00%)#4,146 |
| 54. | Kennett | 130 | 38,568(0.34%)#54 | 10,767,104(0.00%)#4,201 |
| 55. | Crestwood | 97 | 38,568(0.25%)#55 | 10,767,104(0.00%)#4,803 |
| 56. | Willard | 94 | 38,568(0.24%)#56 | 10,767,104(0.00%)#4,862 |
| 57. | Clarkton | 92 | 38,568(0.24%)#57 | 10,767,104(0.00%)#4,919 |
| 58. | Kearney | 90 | 38,568(0.23%)#58 | 10,767,104(0.00%)#4,957 |
| 59. | Mehlville | 87 | 38,568(0.23%)#59 | 10,767,104(0.00%)#5,028 |
| 60. | Butterfield | 87 | 38,568(0.23%)#60 | 10,767,104(0.00%)#5,043 |
| 61. | Platte City | 84 | 38,568(0.22%)#61 | 10,767,104(0.00%)#5,120 |
| 62. | Osage Beach | 84 | 38,568(0.22%)#62 | 10,767,104(0.00%)#5,121 |
| 63. | University City | 82 | 38,568(0.21%)#63 | 10,767,104(0.00%)#5,154 |
| 64. | Caruthersville | 80 | 38,568(0.21%)#64 | 10,767,104(0.00%)#5,215 |
| 65. | Woodson Terrace | 79 | 38,568(0.20%)#65 | 10,767,104(0.00%)#5,242 |
| 66. | Anderson | 78 | 38,568(0.20%)#66 | 10,767,104(0.00%)#5,274 |
| 67. | Cuba | 77 | 38,568(0.20%)#67 | 10,767,104(0.00%)#5,297 |
| 68. | Ellisville | 73 | 38,568(0.19%)#68 | 10,767,104(0.00%)#5,398 |
| 69. | Imperial | 73 | 38,568(0.19%)#69 | 10,767,104(0.00%)#5,402 |
| 70. | Mexico | 71 | 38,568(0.18%)#70 | 10,767,104(0.00%)#5,456 |
| 71. | Princeton | 71 | 38,568(0.18%)#71 | 10,767,104(0.00%)#5,481 |
| 72. | Ginger Blue | 67 | 38,568(0.17%)#72 | 10,767,104(0.00%)#5,621 |
| 73. | Claycomo | 64 | 38,568(0.17%)#73 | 10,767,104(0.00%)#5,720 |
| 74. | Affton | 62 | 38,568(0.16%)#74 | 10,767,104(0.00%)#5,767 |
| 75. | Grain Valley | 62 | 38,568(0.16%)#75 | 10,767,104(0.00%)#5,770 |
| 76. | Riverside | 62 | 38,568(0.16%)#76 | 10,767,104(0.00%)#5,781 |
| 77. | Verona | 58 | 38,568(0.15%)#77 | 10,767,104(0.00%)#5,948 |
| 78. | Dardenne Prairie | 56 | 38,568(0.15%)#78 | 10,767,104(0.00%)#5,998 |
| 79. | Belton | 55 | 38,568(0.14%)#79 | 10,767,104(0.00%)#6,034 |
| 80. | Vinita Park | 54 | 38,568(0.14%)#80 | 10,767,104(0.00%)#6,110 |
| 81. | Malden | 53 | 38,568(0.14%)#81 | 10,767,104(0.00%)#6,152 |
| 82. | Maryville | 51 | 38,568(0.13%)#82 | 10,767,104(0.00%)#6,250 |
| 83. | Higginsville | 49 | 38,568(0.13%)#83 | 10,767,104(0.00%)#6,341 |
| 84. | Bel Ridge | 49 | 38,568(0.13%)#84 | 10,767,104(0.00%)#6,348 |
| 85. | Eureka | 45 | 38,568(0.12%)#85 | 10,767,104(0.00%)#6,531 |
| 86. | Excelsior Springs | 45 | 38,568(0.12%)#86 | 10,767,104(0.00%)#6,534 |
| 87. | Lanagan | 45 | 38,568(0.12%)#87 | 10,767,104(0.00%)#6,583 |
| 88. | Marionville | 44 | 38,568(0.11%)#88 | 10,767,104(0.00%)#6,613 |
| 89. | Raymore | 43 | 38,568(0.11%)#89 | 10,767,104(0.00%)#6,647 |
| 90. | Edmundson | 43 | 38,568(0.11%)#90 | 10,767,104(0.00%)#6,684 |
| 91. | Lake St Louis | 42 | 38,568(0.11%)#91 | 10,767,104(0.00%)#6,712 |
| 92. | Perryville | 42 | 38,568(0.11%)#92 | 10,767,104(0.00%)#6,718 |
| 93. | Fredericktown | 40 | 38,568(0.10%)#93 | 10,767,104(0.00%)#6,841 |
| 94. | Warrenton | 38 | 38,568(0.10%)#94 | 10,767,104(0.00%)#6,941 |
| 95. | Barnhart | 38 | 38,568(0.10%)#95 | 10,767,104(0.00%)#6,950 |
| 96. | Sappington | 37 | 38,568(0.10%)#96 | 10,767,104(0.00%)#7,002 |
| 97. | Jackson | 36 | 38,568(0.09%)#97 | 10,767,104(0.00%)#7,041 |
| 98. | Berkeley | 36 | 38,568(0.09%)#98 | 10,767,104(0.00%)#7,050 |
| 99. | Concord | 35 | 38,568(0.09%)#99 | 10,767,104(0.00%)#7,105 |
| 100. | Vandalia | 35 | 38,568(0.09%)#100 | 10,767,104(0.00%)#7,121 |
Common Questions
What are the Top 10 Cities with the Most Immigrants from Mexico in Missouri?
Top 10 Cities with the Most Immigrants from Mexico in Missouri are:
#1
10,609
#2
2,082
#3
1,868
#4
949
#5
837
#6
793
#7
703
#8
681
#9
631
#10
569
What city has the Most Immigrants from Mexico in Missouri?
Kansas City has the Most Immigrants from Mexico in Missouri with 10,609.
What is the Total Immigrants from Mexico in the State of Missouri?
Total Immigrants from Mexico in Missouri is 38,568.
What is the Total Immigrants from Mexico in the United States?
Total Immigrants from Mexico in the United States is 10,767,104.