Cities with the Most Immigrants from Belarus in Massachusetts
RELATED REPORTS & OPTIONS
Belarus
Massachusetts
Compare Cities
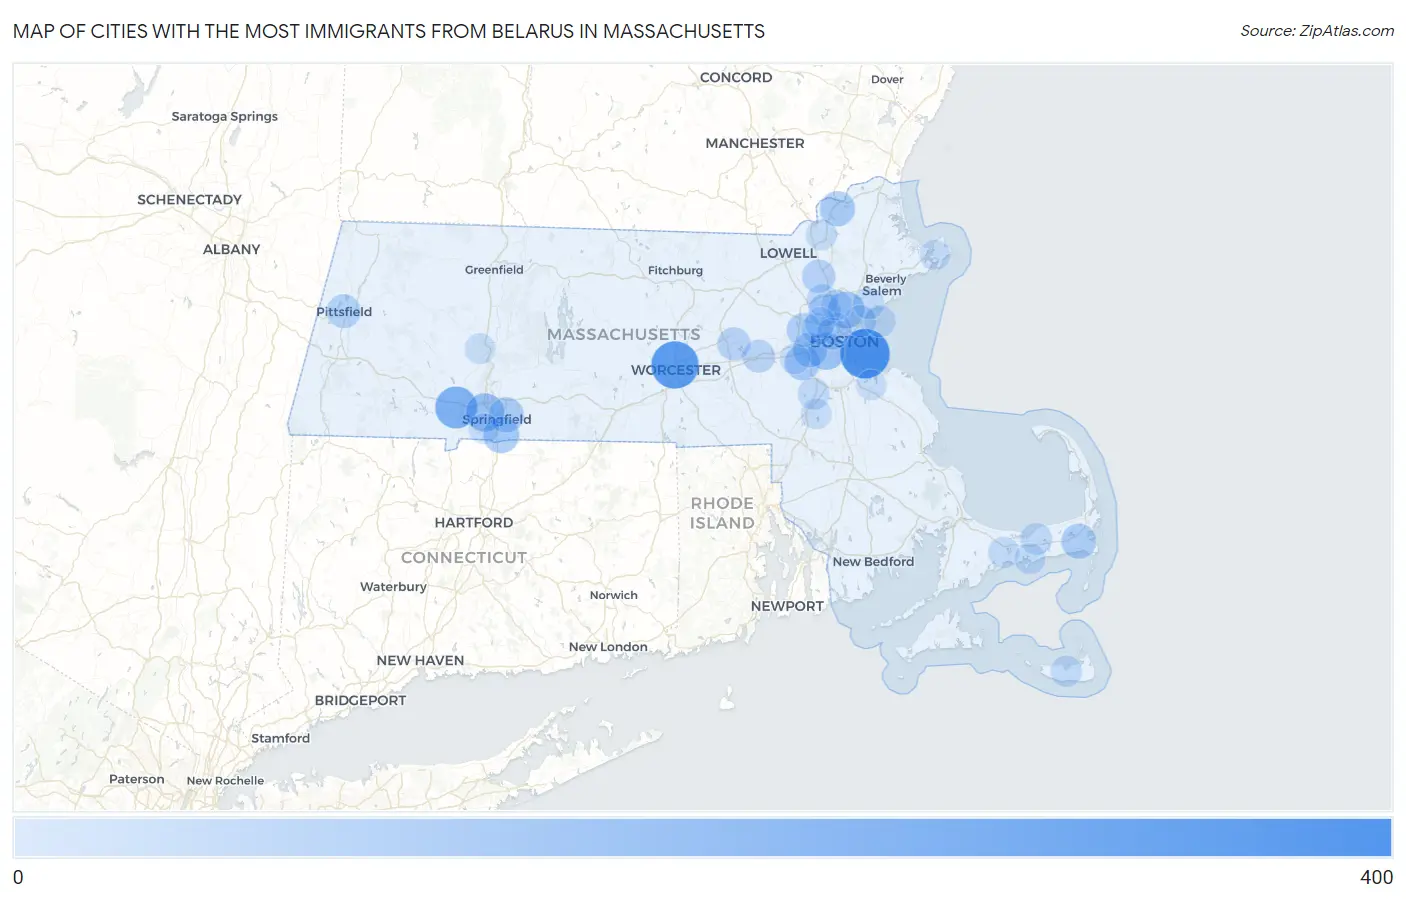
Map of Cities with the Most Immigrants from Belarus in Massachusetts
0
400
Cities with the Most Immigrants from Belarus in Massachusetts
| City | Belarus | vs State | vs National | |
| 1. | Boston | 317 | 2,737(11.58%)#1 | 71,687(0.44%)#20 |
| 2. | Worcester | 281 | 2,737(10.27%)#2 | 71,687(0.39%)#24 |
| 3. | Westfield | 191 | 2,737(6.98%)#3 | 71,687(0.27%)#43 |
| 4. | West Springfield Town | 129 | 2,737(4.71%)#4 | 71,687(0.18%)#67 |
| 5. | Brookline | 115 | 2,737(4.20%)#5 | 71,687(0.16%)#81 |
| 6. | Melrose | 104 | 2,737(3.80%)#6 | 71,687(0.15%)#97 |
| 7. | Longmeadow | 93 | 2,737(3.40%)#7 | 71,687(0.13%)#116 |
| 8. | Needham | 87 | 2,737(3.18%)#8 | 71,687(0.12%)#123 |
| 9. | Springfield | 79 | 2,737(2.89%)#9 | 71,687(0.11%)#133 |
| 10. | Haverhill | 79 | 2,737(2.89%)#10 | 71,687(0.11%)#134 |
| 11. | East Harwich | 76 | 2,737(2.78%)#11 | 71,687(0.11%)#146 |
| 12. | Newton | 73 | 2,737(2.67%)#12 | 71,687(0.10%)#154 |
| 13. | Waltham | 62 | 2,737(2.27%)#13 | 71,687(0.09%)#188 |
| 14. | Pittsfield | 59 | 2,737(2.16%)#14 | 71,687(0.08%)#197 |
| 15. | Wilmington | 52 | 2,737(1.90%)#15 | 71,687(0.07%)#229 |
| 16. | Marlborough | 47 | 2,737(1.72%)#16 | 71,687(0.07%)#252 |
| 17. | Framingham | 43 | 2,737(1.57%)#17 | 71,687(0.06%)#276 |
| 18. | Somerville | 40 | 2,737(1.46%)#18 | 71,687(0.06%)#300 |
| 19. | Winchester | 37 | 2,737(1.35%)#19 | 71,687(0.05%)#321 |
| 20. | Amherst | 32 | 2,737(1.17%)#20 | 71,687(0.04%)#364 |
| 21. | Revere | 30 | 2,737(1.10%)#21 | 71,687(0.04%)#383 |
| 22. | Belmont | 30 | 2,737(1.10%)#22 | 71,687(0.04%)#386 |
| 23. | Cambridge | 29 | 2,737(1.06%)#23 | 71,687(0.04%)#390 |
| 24. | Woburn | 29 | 2,737(1.06%)#24 | 71,687(0.04%)#395 |
| 25. | Norwood | 28 | 2,737(1.02%)#25 | 71,687(0.04%)#413 |
| 26. | Yarmouth Port | 27 | 2,737(0.99%)#26 | 71,687(0.04%)#432 |
| 27. | Nahant | 23 | 2,737(0.84%)#27 | 71,687(0.03%)#494 |
| 28. | Lynn | 20 | 2,737(0.73%)#28 | 71,687(0.03%)#531 |
| 29. | Barnstable Town | 20 | 2,737(0.73%)#29 | 71,687(0.03%)#534 |
| 30. | Nantucket | 20 | 2,737(0.73%)#30 | 71,687(0.03%)#544 |
| 31. | West Yarmouth | 16 | 2,737(0.58%)#31 | 71,687(0.02%)#619 |
| 32. | Lawrence | 15 | 2,737(0.55%)#32 | 71,687(0.02%)#629 |
| 33. | Northampton | 12 | 2,737(0.44%)#33 | 71,687(0.02%)#711 |
| 34. | Stoneham | 12 | 2,737(0.44%)#34 | 71,687(0.02%)#717 |
| 35. | Sharon | 12 | 2,737(0.44%)#35 | 71,687(0.02%)#724 |
| 36. | Arlington | 10 | 2,737(0.37%)#36 | 71,687(0.01%)#757 |
| 37. | Wellesley | 10 | 2,737(0.37%)#37 | 71,687(0.01%)#759 |
| 38. | Gloucester | 10 | 2,737(0.37%)#38 | 71,687(0.01%)#760 |
| 39. | Agawam Town | 10 | 2,737(0.37%)#39 | 71,687(0.01%)#761 |
| 40. | Weymouth Town | 9 | 2,737(0.33%)#40 | 71,687(0.01%)#780 |
Common Questions
What are the Top 10 Cities with the Most Immigrants from Belarus in Massachusetts?
Top 10 Cities with the Most Immigrants from Belarus in Massachusetts are:
#1
317
#2
281
#3
191
#4
129
#5
115
#6
104
#7
93
#8
87
#9
79
#10
79
What city has the Most Immigrants from Belarus in Massachusetts?
Boston has the Most Immigrants from Belarus in Massachusetts with 317.
What is the Total Immigrants from Belarus in the State of Massachusetts?
Total Immigrants from Belarus in Massachusetts is 2,737.
What is the Total Immigrants from Belarus in the United States?
Total Immigrants from Belarus in the United States is 71,687.