Cities with the Most Immigrants from Belarus in Pennsylvania
RELATED REPORTS & OPTIONS
Belarus
Pennsylvania
Compare Cities
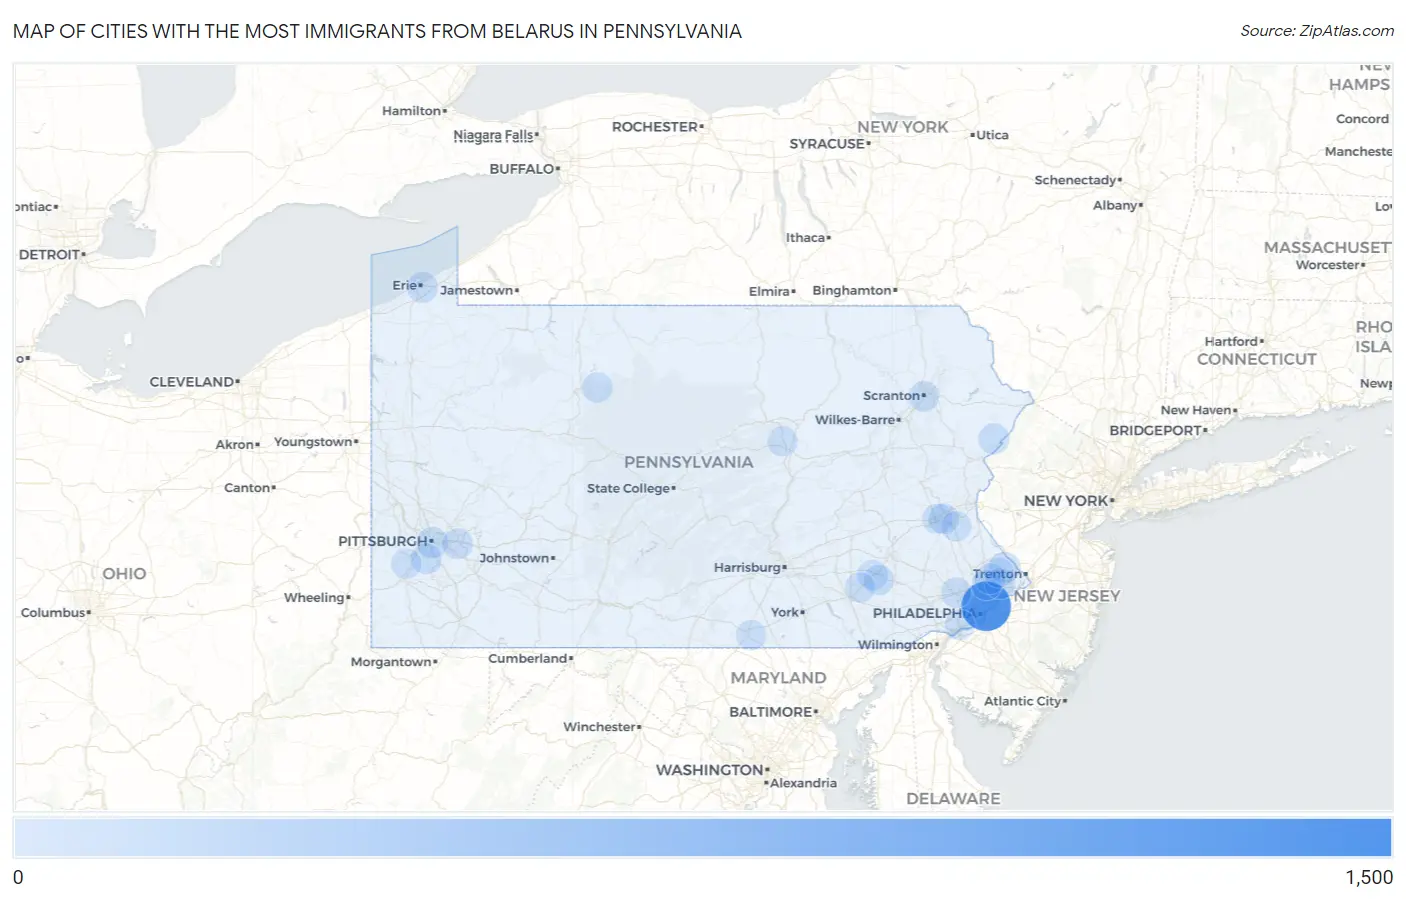
Map of Cities with the Most Immigrants from Belarus in Pennsylvania
0
1,500
Cities with the Most Immigrants from Belarus in Pennsylvania
| City | Belarus | vs State | vs National | |
| 1. | Philadelphia | 1,403 | 4,068(34.49%)#1 | 71,687(1.96%)#3 |
| 2. | Morrisville Borough | 153 | 4,068(3.76%)#2 | 71,687(0.21%)#57 |
| 3. | Pittsburgh | 79 | 4,068(1.94%)#3 | 71,687(0.11%)#132 |
| 4. | Lansdale Borough | 63 | 4,068(1.55%)#4 | 71,687(0.09%)#186 |
| 5. | Penndel Borough | 57 | 4,068(1.40%)#5 | 71,687(0.08%)#209 |
| 6. | Newtown Grant | 56 | 4,068(1.38%)#6 | 71,687(0.08%)#215 |
| 7. | Saw Creek | 56 | 4,068(1.38%)#7 | 71,687(0.08%)#216 |
| 8. | Erie | 51 | 4,068(1.25%)#8 | 71,687(0.07%)#232 |
| 9. | Malvern Borough | 50 | 4,068(1.23%)#9 | 71,687(0.07%)#236 |
| 10. | Franklin Park Borough | 44 | 4,068(1.08%)#10 | 71,687(0.06%)#272 |
| 11. | Media Borough | 43 | 4,068(1.06%)#11 | 71,687(0.06%)#280 |
| 12. | Monroeville | 42 | 4,068(1.03%)#12 | 71,687(0.06%)#287 |
| 13. | Ephrata Borough | 42 | 4,068(1.03%)#13 | 71,687(0.06%)#291 |
| 14. | Feasterville | 42 | 4,068(1.03%)#14 | 71,687(0.06%)#292 |
| 15. | Bethel Park | 40 | 4,068(0.98%)#15 | 71,687(0.06%)#301 |
| 16. | Warminster Heights | 38 | 4,068(0.93%)#16 | 71,687(0.05%)#319 |
| 17. | King Of Prussia | 35 | 4,068(0.86%)#17 | 71,687(0.05%)#332 |
| 18. | Reamstown | 34 | 4,068(0.84%)#18 | 71,687(0.05%)#349 |
| 19. | Scranton | 33 | 4,068(0.81%)#19 | 71,687(0.05%)#352 |
| 20. | Pleasant Hills Borough | 26 | 4,068(0.64%)#20 | 71,687(0.04%)#444 |
| 21. | Woodlyn | 21 | 4,068(0.52%)#21 | 71,687(0.03%)#523 |
| 22. | Fivepointville | 18 | 4,068(0.44%)#22 | 71,687(0.03%)#578 |
| 23. | Cetronia | 16 | 4,068(0.39%)#23 | 71,687(0.02%)#623 |
| 24. | St Marys | 15 | 4,068(0.37%)#24 | 71,687(0.02%)#637 |
| 25. | Allentown | 14 | 4,068(0.34%)#25 | 71,687(0.02%)#649 |
| 26. | Kingston Borough | 12 | 4,068(0.29%)#26 | 71,687(0.02%)#720 |
| 27. | Chester Heights Borough | 12 | 4,068(0.29%)#27 | 71,687(0.02%)#728 |
| 28. | Willow Grove | 9 | 4,068(0.22%)#28 | 71,687(0.01%)#798 |
| 29. | New Cumberland Borough | 9 | 4,068(0.22%)#29 | 71,687(0.01%)#801 |
| 30. | Lake Heritage | 9 | 4,068(0.22%)#30 | 71,687(0.01%)#805 |
| 31. | Richboro | 7 | 4,068(0.17%)#31 | 71,687(0.01%)#861 |
| 32. | Muse | 7 | 4,068(0.17%)#32 | 71,687(0.01%)#868 |
| 33. | Brownstown | 6 | 4,068(0.15%)#33 | 71,687(0.01%)#891 |
| 34. | Allenwood | 6 | 4,068(0.15%)#34 | 71,687(0.01%)#898 |
| 35. | Southmont Borough | 5 | 4,068(0.12%)#35 | 71,687(0.01%)#913 |
| 36. | Coopersburg Borough | 4 | 4,068(0.10%)#36 | 71,687(0.01%)#932 |
| 37. | Desales University | 4 | 4,068(0.10%)#37 | 71,687(0.01%)#933 |
Common Questions
What are the Top 10 Cities with the Most Immigrants from Belarus in Pennsylvania?
Top 10 Cities with the Most Immigrants from Belarus in Pennsylvania are:
#1
1,403
#2
79
#3
56
#4
56
#5
51
#6
42
#7
42
#8
40
#9
38
#10
35
What city has the Most Immigrants from Belarus in Pennsylvania?
Philadelphia has the Most Immigrants from Belarus in Pennsylvania with 1,403.
What is the Total Immigrants from Belarus in the State of Pennsylvania?
Total Immigrants from Belarus in Pennsylvania is 4,068.
What is the Total Immigrants from Belarus in the United States?
Total Immigrants from Belarus in the United States is 71,687.