West Sacramento, CA Map & Demographics
West Sacramento Map
West Sacramento Overview
$40,553
PER CAPITA INCOME
$102,674
AVG FAMILY INCOME
$87,044
AVG HOUSEHOLD INCOME
14.4%
WAGE / INCOME GAP [ % ]
85.6¢/ $1
WAGE / INCOME GAP [ $ ]
$12,232
FAMILY INCOME DEFICIT
0.47
INEQUALITY / GINI INDEX
54,163
TOTAL POPULATION
26,370
MALE POPULATION
27,793
FEMALE POPULATION
94.88
MALES / 100 FEMALES
105.40
FEMALES / 100 MALES
34.5
MEDIAN AGE
3.4
AVG FAMILY SIZE
2.8
AVG HOUSEHOLD SIZE
27,487
LABOR FORCE [ PEOPLE ]
65.8%
PERCENT IN LABOR FORCE
5.4%
UNEMPLOYMENT RATE
Income in West Sacramento
Income Overview in West Sacramento
Per Capita Income in West Sacramento is $40,553, while median incomes of families and households are $102,674 and $87,044 respectively.
| Characteristic | Number | Measure |
| Per Capita Income | 54,163 | $40,553 |
| Median Family Income | 13,222 | $102,674 |
| Mean Family Income | 13,222 | $128,014 |
| Median Household Income | 18,979 | $87,044 |
| Mean Household Income | 18,979 | $114,480 |
| Income Deficit | 13,222 | $12,232 |
| Wage / Income Gap (%) | 54,163 | 14.35% |
| Wage / Income Gap ($) | 54,163 | 85.65¢ per $1 |
| Gini / Inequality Index | 54,163 | 0.47 |
Earnings by Sex in West Sacramento
Average Earnings in West Sacramento are $48,211, $52,591 for men and $45,042 for women, a difference of 14.3%.
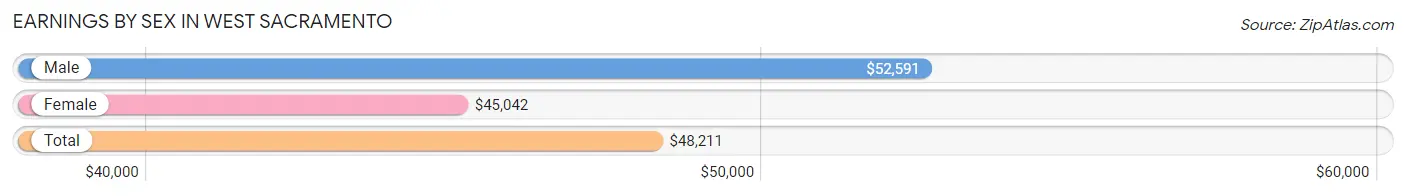
| Sex | Number | Average Earnings |
| Male | 14,248 (50.7%) | $52,591 |
| Female | 13,869 (49.3%) | $45,042 |
| Total | 28,117 (100.0%) | $48,211 |
Earnings by Sex by Income Bracket in West Sacramento
The most common earnings brackets in West Sacramento are $100,000+ for men (3,067 | 21.5%) and $100,000+ for women (2,563 | 18.5%).
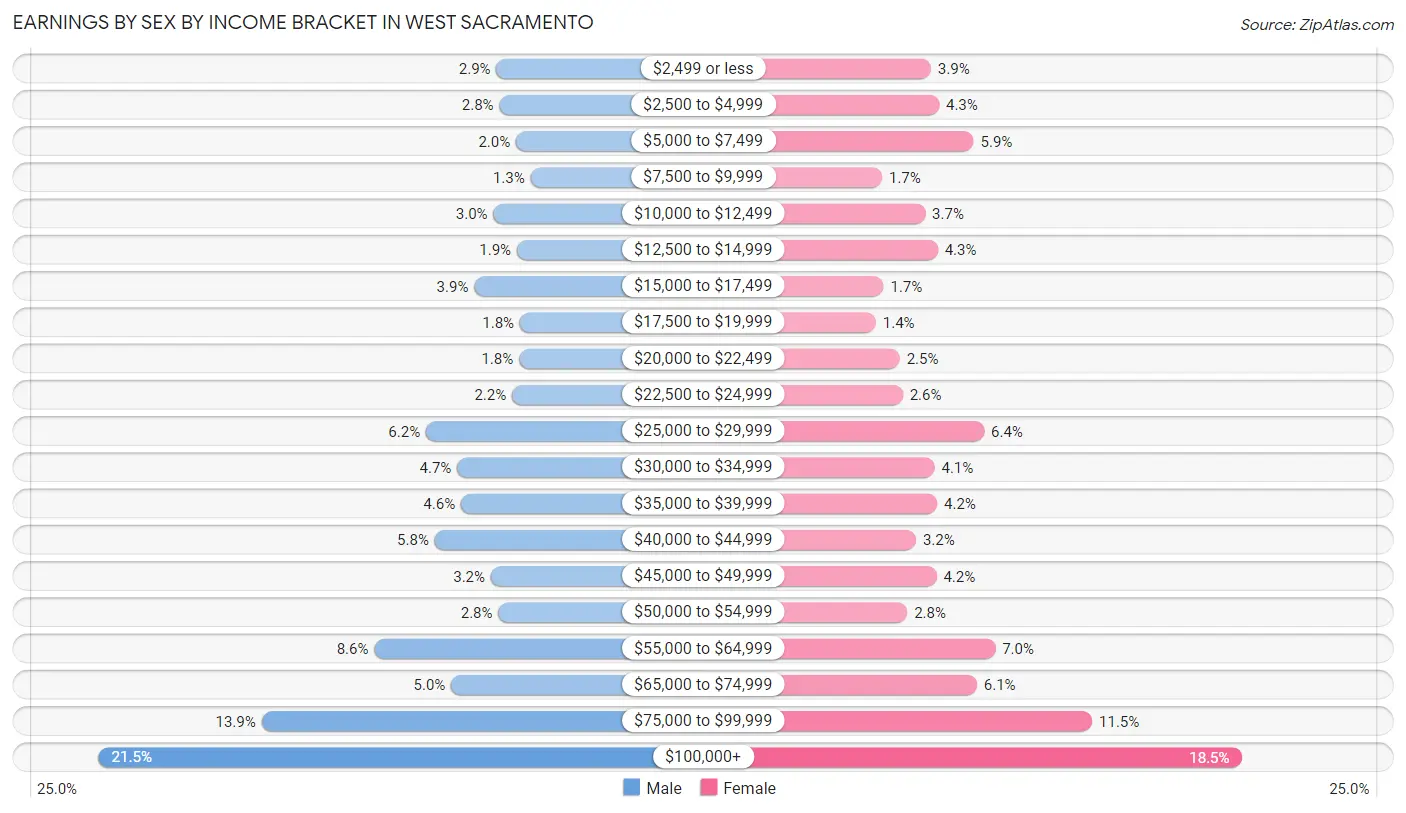
| Income | Male | Female |
| $2,499 or less | 413 (2.9%) | 546 (3.9%) |
| $2,500 to $4,999 | 393 (2.8%) | 599 (4.3%) |
| $5,000 to $7,499 | 282 (2.0%) | 824 (5.9%) |
| $7,500 to $9,999 | 185 (1.3%) | 229 (1.7%) |
| $10,000 to $12,499 | 433 (3.0%) | 509 (3.7%) |
| $12,500 to $14,999 | 276 (1.9%) | 591 (4.3%) |
| $15,000 to $17,499 | 562 (3.9%) | 239 (1.7%) |
| $17,500 to $19,999 | 257 (1.8%) | 188 (1.4%) |
| $20,000 to $22,499 | 262 (1.8%) | 344 (2.5%) |
| $22,500 to $24,999 | 309 (2.2%) | 363 (2.6%) |
| $25,000 to $29,999 | 884 (6.2%) | 892 (6.4%) |
| $30,000 to $34,999 | 676 (4.7%) | 570 (4.1%) |
| $35,000 to $39,999 | 649 (4.6%) | 586 (4.2%) |
| $40,000 to $44,999 | 825 (5.8%) | 449 (3.2%) |
| $45,000 to $49,999 | 450 (3.2%) | 582 (4.2%) |
| $50,000 to $54,999 | 401 (2.8%) | 393 (2.8%) |
| $55,000 to $64,999 | 1,228 (8.6%) | 964 (7.0%) |
| $65,000 to $74,999 | 715 (5.0%) | 845 (6.1%) |
| $75,000 to $99,999 | 1,981 (13.9%) | 1,593 (11.5%) |
| $100,000+ | 3,067 (21.5%) | 2,563 (18.5%) |
| Total | 14,248 (100.0%) | 13,869 (100.0%) |
Earnings by Sex by Educational Attainment in West Sacramento
Average earnings in West Sacramento are $61,768 for men and $55,824 for women, a difference of 9.6%. Men with an educational attainment of graduate degree enjoy the highest average annual earnings of $128,075, while those with less than high school education earn the least with $36,662. Women with an educational attainment of graduate degree earn the most with the average annual earnings of $100,212, while those with less than high school education have the smallest earnings of $25,531.
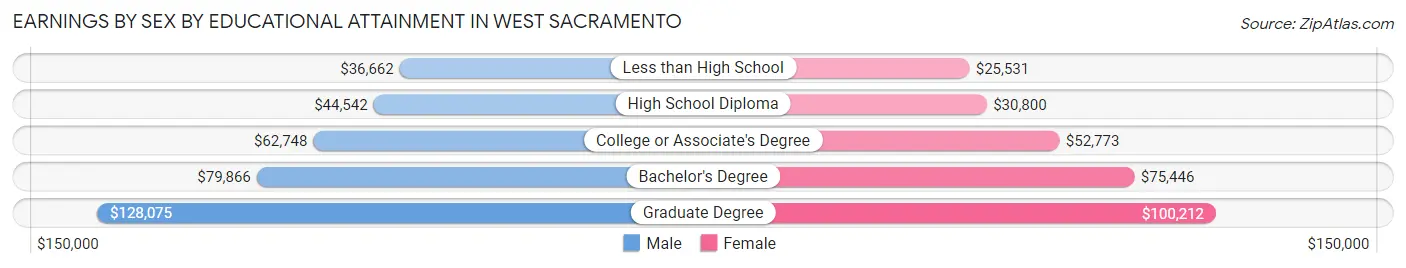
| Educational Attainment | Male Income | Female Income |
| Less than High School | $36,662 | $25,531 |
| High School Diploma | $44,542 | $30,800 |
| College or Associate's Degree | $62,748 | $52,773 |
| Bachelor's Degree | $79,866 | $75,446 |
| Graduate Degree | $128,075 | $100,212 |
| Total | $61,768 | $55,824 |
Family Income in West Sacramento
Family Income Brackets in West Sacramento
According to the West Sacramento family income data, there are 2,909 families falling into the $100,000 to $149,999 income range, which is the most common income bracket and makes up 22.0% of all families. Conversely, the $10,000 to $14,999 income bracket is the least frequent group with only 251 families (1.9%) belonging to this category.
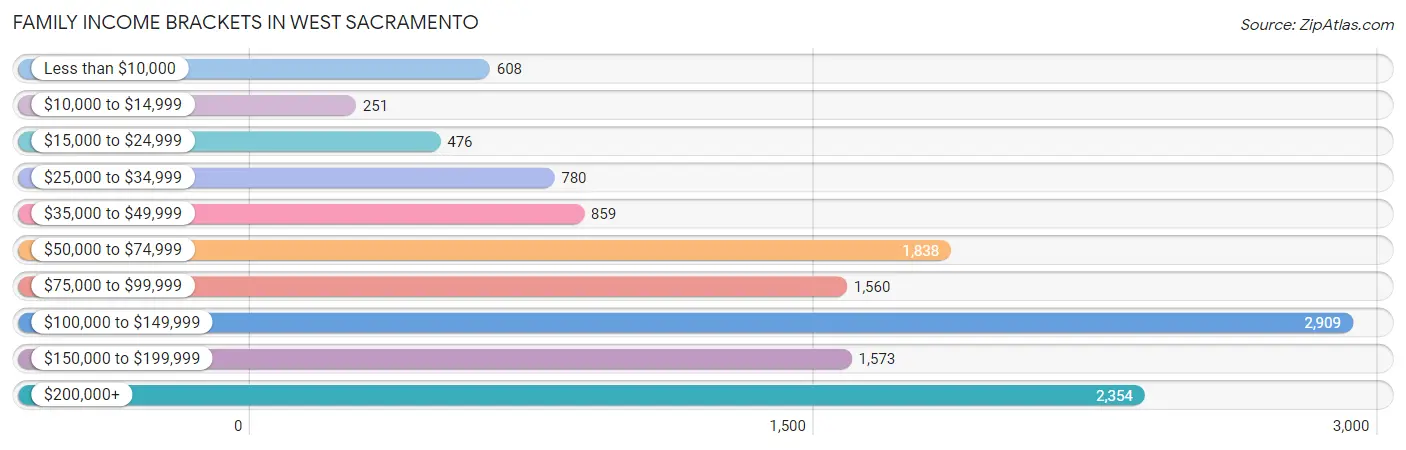
| Income Bracket | # Families | % Families |
| Less than $10,000 | 608 | 4.6% |
| $10,000 to $14,999 | 251 | 1.9% |
| $15,000 to $24,999 | 476 | 3.6% |
| $25,000 to $34,999 | 780 | 5.9% |
| $35,000 to $49,999 | 859 | 6.5% |
| $50,000 to $74,999 | 1,838 | 13.9% |
| $75,000 to $99,999 | 1,560 | 11.8% |
| $100,000 to $149,999 | 2,909 | 22.0% |
| $150,000 to $199,999 | 1,573 | 11.9% |
| $200,000+ | 2,354 | 17.8% |
Family Income by Famaliy Size in West Sacramento
4-person families (2,935 | 22.2%) account for the highest median family income in West Sacramento with $109,727 per family, while 2-person families (4,949 | 37.4%) have the highest median income of $53,396 per family member.
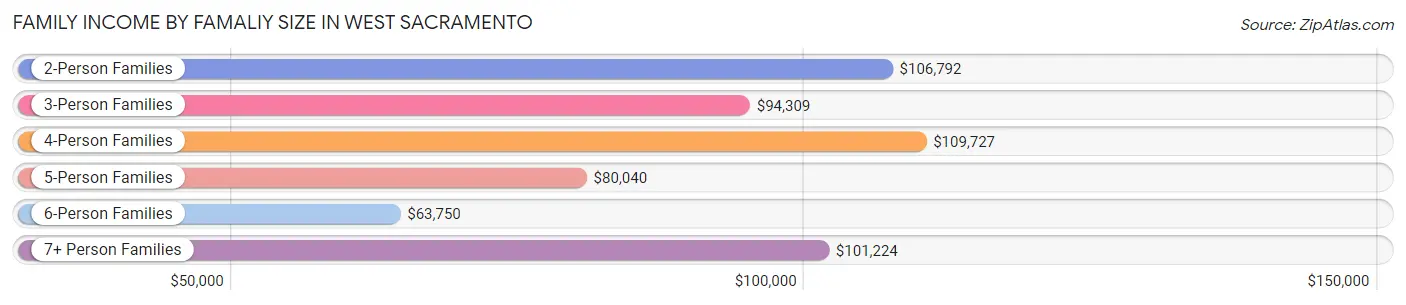
| Income Bracket | # Families | Median Income |
| 2-Person Families | 4,949 (37.4%) | $106,792 |
| 3-Person Families | 3,082 (23.3%) | $94,309 |
| 4-Person Families | 2,935 (22.2%) | $109,727 |
| 5-Person Families | 1,333 (10.1%) | $80,040 |
| 6-Person Families | 376 (2.8%) | $63,750 |
| 7+ Person Families | 547 (4.1%) | $101,224 |
| Total | 13,222 (100.0%) | $102,674 |
Family Income by Number of Earners in West Sacramento
The median family income in West Sacramento is $102,674, with families comprising 3+ earners (1,449) having the highest median family income of $143,432, while families with no earners (1,362) have the lowest median family income of $38,929, accounting for 11.0% and 10.3% of families, respectively.
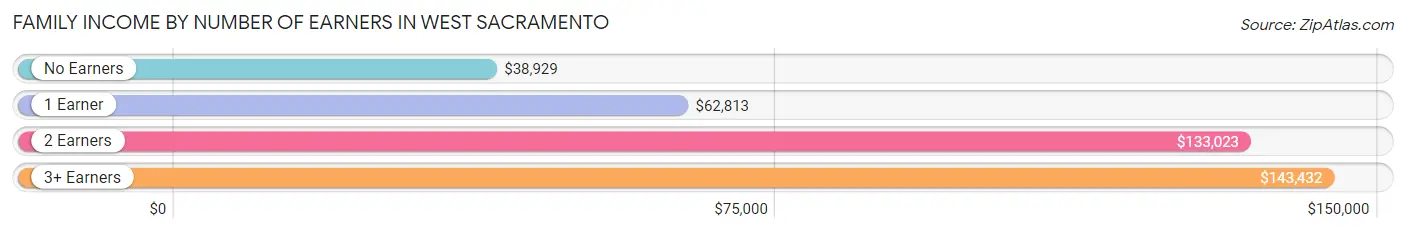
| Number of Earners | # Families | Median Income |
| No Earners | 1,362 (10.3%) | $38,929 |
| 1 Earner | 4,569 (34.6%) | $62,813 |
| 2 Earners | 5,842 (44.2%) | $133,023 |
| 3+ Earners | 1,449 (11.0%) | $143,432 |
| Total | 13,222 (100.0%) | $102,674 |
Household Income in West Sacramento
Household Income Brackets in West Sacramento
With 3,739 households falling in the category, the $100,000 to $149,999 income range is the most frequent in West Sacramento, accounting for 19.7% of all households. In contrast, only 854 households (4.5%) fall into the less than $10,000 income bracket, making it the least populous group.
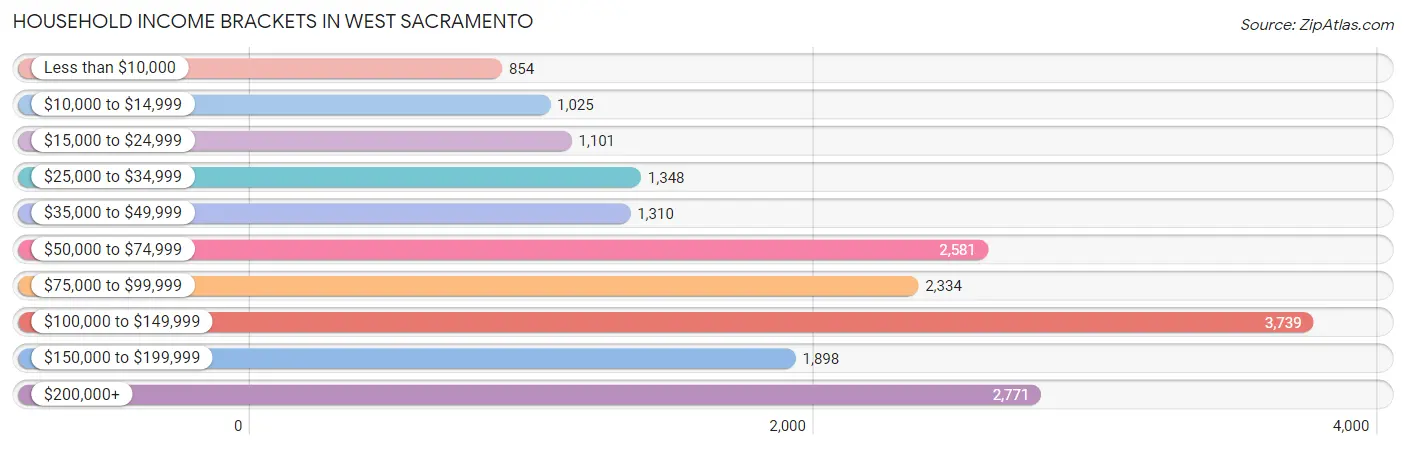
| Income Bracket | # Households | % Households |
| Less than $10,000 | 854 | 4.5% |
| $10,000 to $14,999 | 1,025 | 5.4% |
| $15,000 to $24,999 | 1,101 | 5.8% |
| $25,000 to $34,999 | 1,348 | 7.1% |
| $35,000 to $49,999 | 1,310 | 6.9% |
| $50,000 to $74,999 | 2,581 | 13.6% |
| $75,000 to $99,999 | 2,334 | 12.3% |
| $100,000 to $149,999 | 3,739 | 19.7% |
| $150,000 to $199,999 | 1,898 | 10.0% |
| $200,000+ | 2,771 | 14.6% |
Household Income by Householder Age in West Sacramento
The median household income in West Sacramento is $87,044, with the highest median household income of $101,967 found in the 45 to 64 years age bracket for the primary householder. A total of 6,785 households (35.7%) fall into this category. Meanwhile, the 65+ years age bracket for the primary householder has the lowest median household income of $49,858, with 3,664 households (19.3%) in this group.
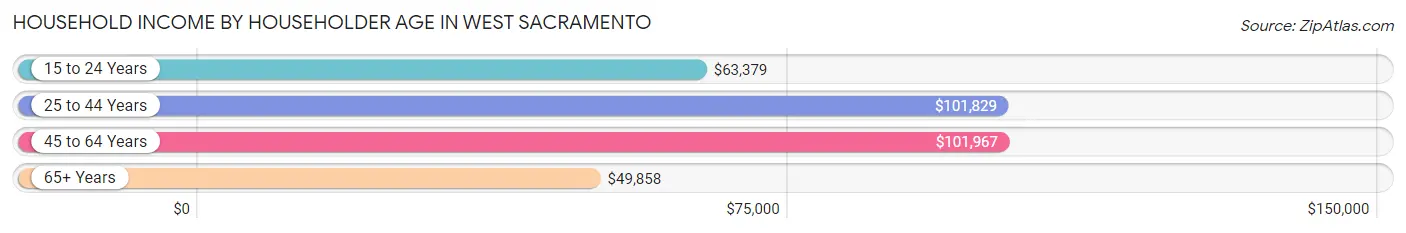
| Income Bracket | # Households | Median Income |
| 15 to 24 Years | 839 (4.4%) | $63,379 |
| 25 to 44 Years | 7,691 (40.5%) | $101,829 |
| 45 to 64 Years | 6,785 (35.7%) | $101,967 |
| 65+ Years | 3,664 (19.3%) | $49,858 |
| Total | 18,979 (100.0%) | $87,044 |
Poverty in West Sacramento
Income Below Poverty by Sex and Age in West Sacramento
With 13.1% poverty level for males and 15.5% for females among the residents of West Sacramento, 5 year old males and 75 year old and over females are the most vulnerable to poverty, with 129 males (36.3%) and 302 females (22.4%) in their respective age groups living below the poverty level.
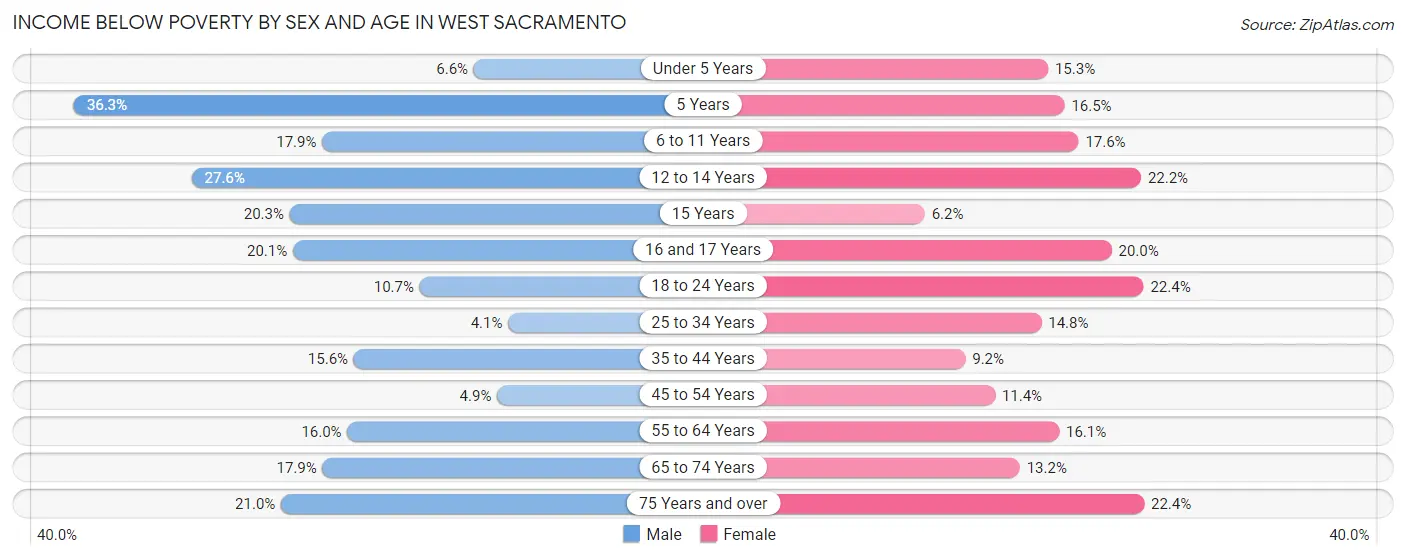
| Age Bracket | Male | Female |
| Under 5 Years | 120 (6.6%) | 224 (15.3%) |
| 5 Years | 129 (36.3%) | 61 (16.5%) |
| 6 to 11 Years | 497 (17.9%) | 384 (17.6%) |
| 12 to 14 Years | 326 (27.6%) | 329 (22.2%) |
| 15 Years | 65 (20.3%) | 21 (6.2%) |
| 16 and 17 Years | 173 (20.1%) | 149 (20.0%) |
| 18 to 24 Years | 258 (10.7%) | 646 (22.4%) |
| 25 to 34 Years | 171 (4.1%) | 619 (14.8%) |
| 35 to 44 Years | 617 (15.5%) | 398 (9.2%) |
| 45 to 54 Years | 147 (4.9%) | 333 (11.4%) |
| 55 to 64 Years | 456 (16.0%) | 545 (16.1%) |
| 65 to 74 Years | 278 (17.9%) | 273 (13.2%) |
| 75 Years and over | 199 (20.9%) | 302 (22.4%) |
| Total | 3,436 (13.1%) | 4,284 (15.5%) |
Income Above Poverty by Sex and Age in West Sacramento
According to the poverty statistics in West Sacramento, males aged 25 to 34 years and females aged 15 years are the age groups that are most secure financially, with 95.9% of males and 93.8% of females in these age groups living above the poverty line.
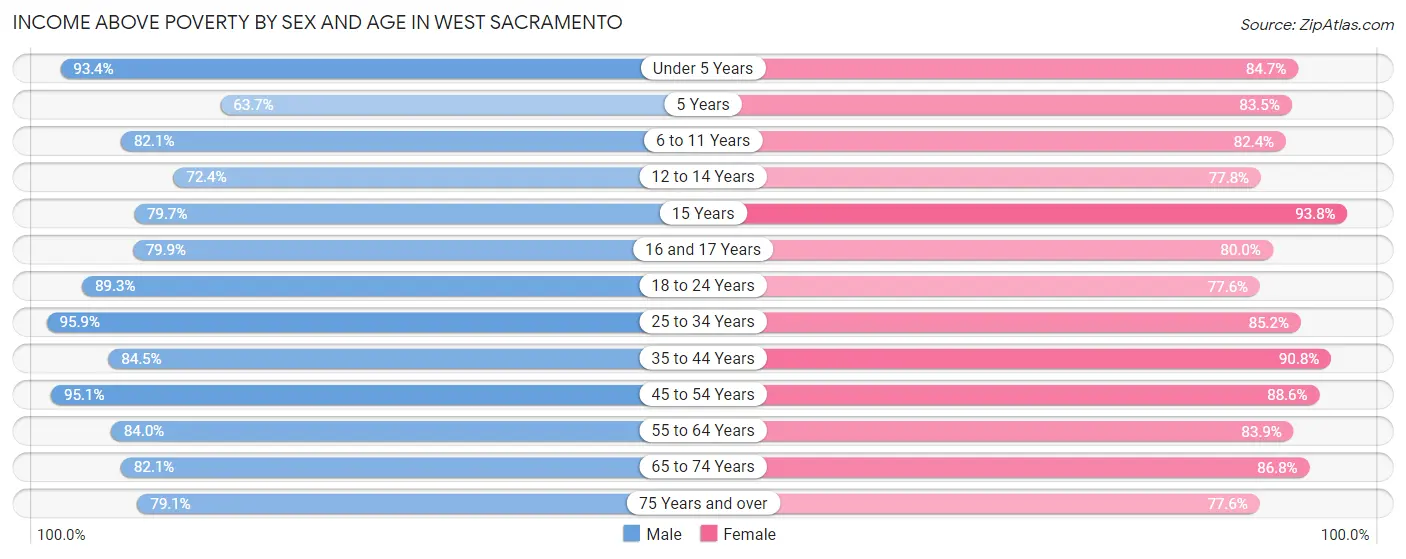
| Age Bracket | Male | Female |
| Under 5 Years | 1,688 (93.4%) | 1,239 (84.7%) |
| 5 Years | 226 (63.7%) | 308 (83.5%) |
| 6 to 11 Years | 2,280 (82.1%) | 1,801 (82.4%) |
| 12 to 14 Years | 855 (72.4%) | 1,152 (77.8%) |
| 15 Years | 255 (79.7%) | 320 (93.8%) |
| 16 and 17 Years | 689 (79.9%) | 595 (80.0%) |
| 18 to 24 Years | 2,162 (89.3%) | 2,238 (77.6%) |
| 25 to 34 Years | 4,005 (95.9%) | 3,561 (85.2%) |
| 35 to 44 Years | 3,352 (84.5%) | 3,943 (90.8%) |
| 45 to 54 Years | 2,847 (95.1%) | 2,596 (88.6%) |
| 55 to 64 Years | 2,389 (84.0%) | 2,834 (83.9%) |
| 65 to 74 Years | 1,277 (82.1%) | 1,793 (86.8%) |
| 75 Years and over | 751 (79.0%) | 1,044 (77.6%) |
| Total | 22,776 (86.9%) | 23,424 (84.5%) |
Income Below Poverty Among Married-Couple Families in West Sacramento
The poverty statistics for married-couple families in West Sacramento show that 8.4% or 788 of the total 9,440 families live below the poverty line. Families with 5 or more children have the highest poverty rate of 91.6%, comprising of 98 families. On the other hand, families with 1 or 2 children have the lowest poverty rate of 3.5%, which includes 134 families.
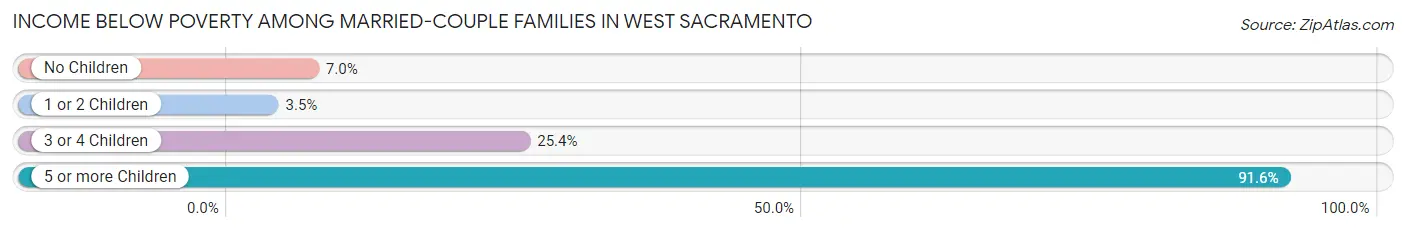
| Children | Above Poverty | Below Poverty |
| No Children | 4,303 (93.0%) | 326 (7.0%) |
| 1 or 2 Children | 3,666 (96.5%) | 134 (3.5%) |
| 3 or 4 Children | 674 (74.6%) | 230 (25.4%) |
| 5 or more Children | 9 (8.4%) | 98 (91.6%) |
| Total | 8,652 (91.6%) | 788 (8.4%) |
Income Below Poverty Among Single-Parent Households in West Sacramento
According to the poverty data in West Sacramento, 7.9% or 75 single-father households and 18.9% or 533 single-mother households are living below the poverty line. Among single-father households, those with 1 or 2 children have the highest poverty rate, with 39 households (8.8%) experiencing poverty. Likewise, among single-mother households, those with 3 or 4 children have the highest poverty rate, with 119 households (27.4%) falling below the poverty line.
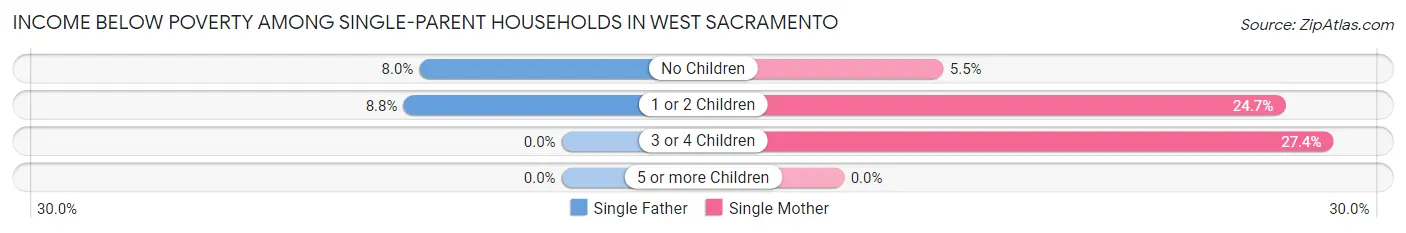
| Children | Single Father | Single Mother |
| No Children | 36 (8.0%) | 51 (5.5%) |
| 1 or 2 Children | 39 (8.8%) | 363 (24.7%) |
| 3 or 4 Children | 0 (0.0%) | 119 (27.4%) |
| 5 or more Children | 0 (0.0%) | 0 (0.0%) |
| Total | 75 (7.9%) | 533 (18.9%) |
Income Below Poverty Among Married-Couple vs Single-Parent Households in West Sacramento
The poverty data for West Sacramento shows that 788 of the married-couple family households (8.4%) and 608 of the single-parent households (16.1%) are living below the poverty level. Within the married-couple family households, those with 5 or more children have the highest poverty rate, with 98 households (91.6%) falling below the poverty line. Among the single-parent households, those with 3 or 4 children have the highest poverty rate, with 119 household (24.0%) living below poverty.
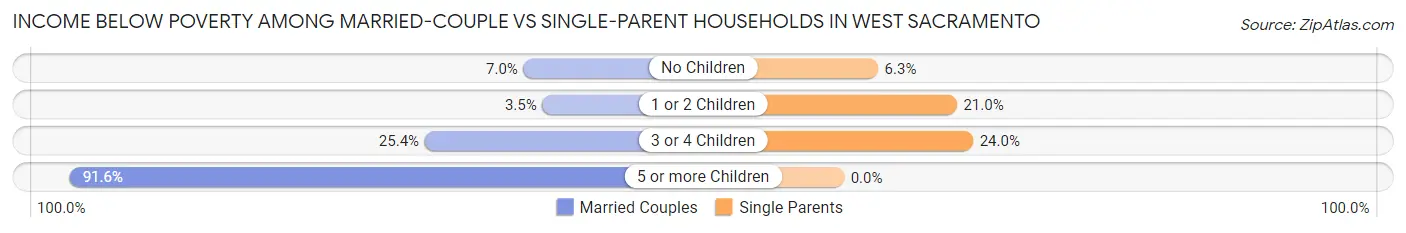
| Children | Married-Couple Families | Single-Parent Households |
| No Children | 326 (7.0%) | 87 (6.3%) |
| 1 or 2 Children | 134 (3.5%) | 402 (21.0%) |
| 3 or 4 Children | 230 (25.4%) | 119 (24.0%) |
| 5 or more Children | 98 (91.6%) | 0 (0.0%) |
| Total | 788 (8.4%) | 608 (16.1%) |
Race in West Sacramento
The most populous races in West Sacramento are White / Caucasian (29,760 | 54.9%), Hispanic or Latino (18,245 | 33.7%), and Two or more Races (8,486 | 15.7%).
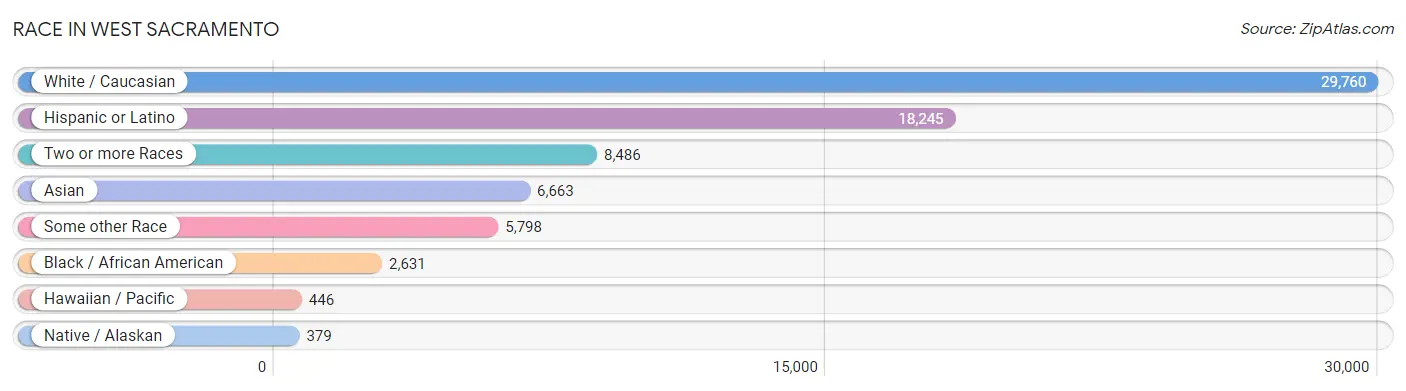
| Race | # Population | % Population |
| Asian | 6,663 | 12.3% |
| Black / African American | 2,631 | 4.9% |
| Hawaiian / Pacific | 446 | 0.8% |
| Hispanic or Latino | 18,245 | 33.7% |
| Native / Alaskan | 379 | 0.7% |
| White / Caucasian | 29,760 | 54.9% |
| Two or more Races | 8,486 | 15.7% |
| Some other Race | 5,798 | 10.7% |
| Total | 54,163 | 100.0% |
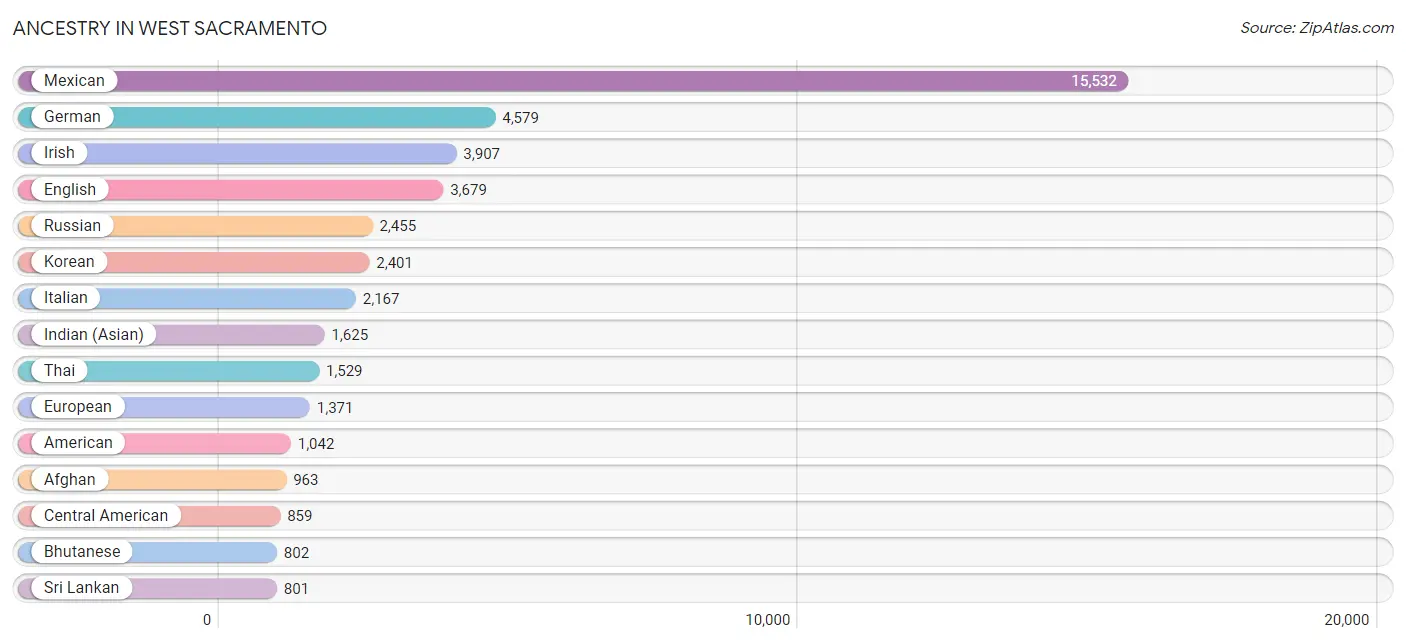
Ancestry in West Sacramento
The most populous ancestries reported in West Sacramento are Mexican (15,532 | 28.7%), German (4,579 | 8.5%), Irish (3,907 | 7.2%), English (3,679 | 6.8%), and Russian (2,455 | 4.5%), together accounting for 55.7% of all West Sacramento residents.
| Ancestry | # Population | % Population |
| Afghan | 963 | 1.8% |
| African | 384 | 0.7% |
| Albanian | 7 | 0.0% |
| American | 1,042 | 1.9% |
| Apache | 132 | 0.2% |
| Arab | 308 | 0.6% |
| Armenian | 61 | 0.1% |
| Australian | 15 | 0.0% |
| Austrian | 56 | 0.1% |
| Bangladeshi | 17 | 0.0% |
| Basque | 78 | 0.1% |
| Belgian | 58 | 0.1% |
| Belizean | 22 | 0.0% |
| Bhutanese | 802 | 1.5% |
| Blackfeet | 23 | 0.0% |
| Brazilian | 255 | 0.5% |
| British | 170 | 0.3% |
| Bulgarian | 13 | 0.0% |
| Burmese | 580 | 1.1% |
| Cajun | 38 | 0.1% |
| Cambodian | 9 | 0.0% |
| Central American | 859 | 1.6% |
| Central American Indian | 18 | 0.0% |
| Cherokee | 97 | 0.2% |
| Choctaw | 104 | 0.2% |
| Colombian | 117 | 0.2% |
| Creek | 41 | 0.1% |
| Croatian | 66 | 0.1% |
| Cuban | 143 | 0.3% |
| Czech | 226 | 0.4% |
| Danish | 173 | 0.3% |
| Dutch | 341 | 0.6% |
| Eastern European | 296 | 0.5% |
| Egyptian | 20 | 0.0% |
| English | 3,679 | 6.8% |
| European | 1,371 | 2.5% |
| Filipino | 92 | 0.2% |
| Finnish | 100 | 0.2% |
| French | 695 | 1.3% |
| French American Indian | 31 | 0.1% |
| French Canadian | 90 | 0.2% |
| German | 4,579 | 8.5% |
| Greek | 85 | 0.2% |
| Guamanian / Chamorro | 209 | 0.4% |
| Guatemalan | 312 | 0.6% |
| Haitian | 19 | 0.0% |
| Honduran | 52 | 0.1% |
| Hungarian | 21 | 0.0% |
| Icelander | 12 | 0.0% |
| Indian (Asian) | 1,625 | 3.0% |
| Iranian | 44 | 0.1% |
| Irish | 3,907 | 7.2% |
| Italian | 2,167 | 4.0% |
| Jamaican | 26 | 0.1% |
| Japanese | 219 | 0.4% |
| Korean | 2,401 | 4.4% |
| Lebanese | 129 | 0.2% |
| Lithuanian | 56 | 0.1% |
| Macedonian | 23 | 0.0% |
| Malaysian | 357 | 0.7% |
| Mexican | 15,532 | 28.7% |
| Mexican American Indian | 190 | 0.4% |
| Native Hawaiian | 172 | 0.3% |
| Navajo | 48 | 0.1% |
| Nepalese | 65 | 0.1% |
| Nicaraguan | 53 | 0.1% |
| Nigerian | 7 | 0.0% |
| Northern European | 85 | 0.2% |
| Norwegian | 507 | 0.9% |
| Pakistani | 49 | 0.1% |
| Pennsylvania German | 29 | 0.1% |
| Peruvian | 71 | 0.1% |
| Polish | 610 | 1.1% |
| Portuguese | 795 | 1.5% |
| Puerto Rican | 327 | 0.6% |
| Romanian | 213 | 0.4% |
| Russian | 2,455 | 4.5% |
| Salvadoran | 442 | 0.8% |
| Samoan | 18 | 0.0% |
| Scandinavian | 135 | 0.3% |
| Scotch-Irish | 392 | 0.7% |
| Scottish | 734 | 1.4% |
| Sioux | 28 | 0.1% |
| Slavic | 19 | 0.0% |
| Slovak | 44 | 0.1% |
| Slovene | 28 | 0.1% |
| South African | 16 | 0.0% |
| South American | 520 | 1.0% |
| South American Indian | 9 | 0.0% |
| Spaniard | 374 | 0.7% |
| Spanish | 325 | 0.6% |
| Sri Lankan | 801 | 1.5% |
| Subsaharan African | 407 | 0.7% |
| Swedish | 221 | 0.4% |
| Swiss | 74 | 0.1% |
| Syrian | 118 | 0.2% |
| Thai | 1,529 | 2.8% |
| Ukrainian | 662 | 1.2% |
| Venezuelan | 332 | 0.6% |
| Welsh | 184 | 0.3% |
| Yaqui | 12 | 0.0% |
| Yugoslavian | 43 | 0.1% | View All 102 Rows |
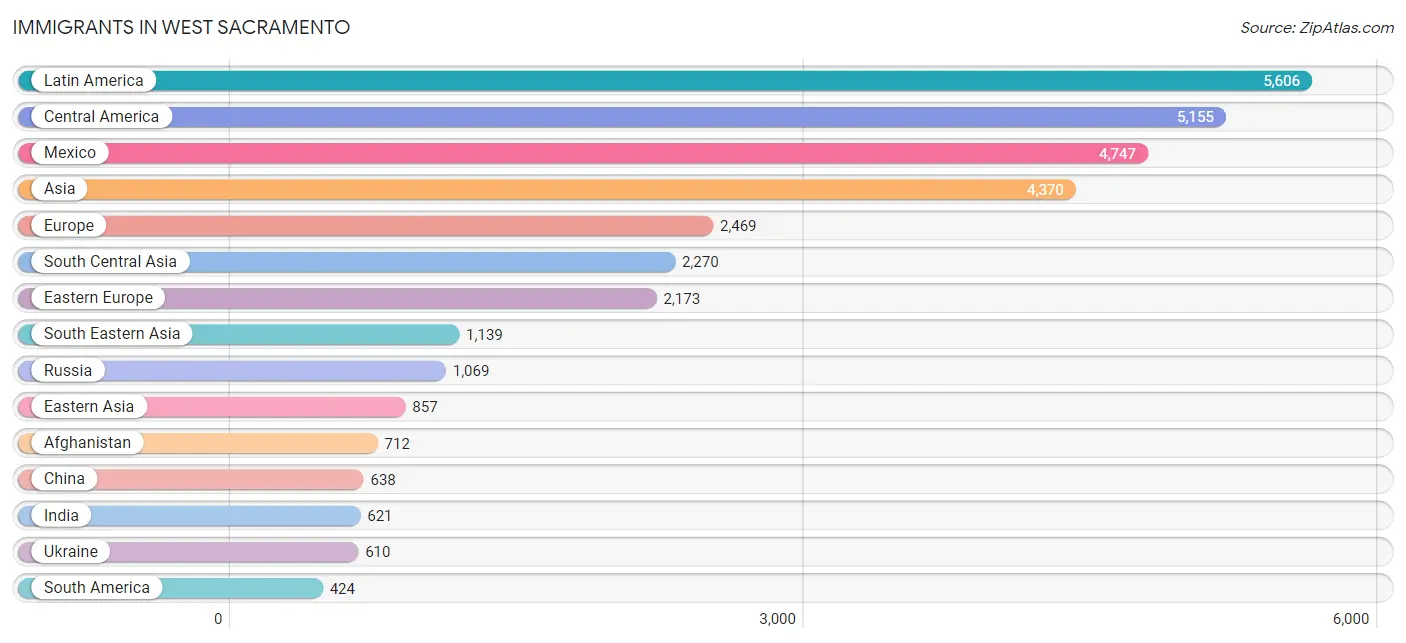
Immigrants in West Sacramento
The most numerous immigrant groups reported in West Sacramento came from Latin America (5,606 | 10.3%), Central America (5,155 | 9.5%), Mexico (4,747 | 8.8%), Asia (4,370 | 8.1%), and Europe (2,469 | 4.6%), together accounting for 41.3% of all West Sacramento residents.
| Immigration Origin | # Population | % Population |
| Afghanistan | 712 | 1.3% |
| Africa | 136 | 0.3% |
| Albania | 37 | 0.1% |
| Asia | 4,370 | 8.1% |
| Australia | 49 | 0.1% |
| Belarus | 47 | 0.1% |
| Belize | 2 | 0.0% |
| Bosnia and Herzegovina | 8 | 0.0% |
| Brazil | 300 | 0.5% |
| Cambodia | 82 | 0.2% |
| Canada | 20 | 0.0% |
| Caribbean | 27 | 0.1% |
| Central America | 5,155 | 9.5% |
| China | 638 | 1.2% |
| Colombia | 60 | 0.1% |
| Cuba | 14 | 0.0% |
| Czechoslovakia | 8 | 0.0% |
| Eastern Africa | 43 | 0.1% |
| Eastern Asia | 857 | 1.6% |
| Eastern Europe | 2,173 | 4.0% |
| El Salvador | 275 | 0.5% |
| England | 56 | 0.1% |
| Europe | 2,469 | 4.6% |
| Fiji | 225 | 0.4% |
| France | 12 | 0.0% |
| Germany | 48 | 0.1% |
| Guatemala | 92 | 0.2% |
| Honduras | 30 | 0.1% |
| Hong Kong | 33 | 0.1% |
| Hungary | 3 | 0.0% |
| India | 621 | 1.1% |
| Iran | 14 | 0.0% |
| Israel | 31 | 0.1% |
| Italy | 39 | 0.1% |
| Japan | 14 | 0.0% |
| Kazakhstan | 223 | 0.4% |
| Kenya | 13 | 0.0% |
| Korea | 205 | 0.4% |
| Laos | 158 | 0.3% |
| Latin America | 5,606 | 10.3% |
| Latvia | 84 | 0.2% |
| Mexico | 4,747 | 8.8% |
| Moldova | 30 | 0.1% |
| Nepal | 32 | 0.1% |
| Netherlands | 23 | 0.0% |
| Nicaragua | 9 | 0.0% |
| Northern Africa | 8 | 0.0% |
| Northern Europe | 87 | 0.2% |
| Oceania | 274 | 0.5% |
| Pakistan | 190 | 0.4% |
| Peru | 64 | 0.1% |
| Philippines | 386 | 0.7% |
| Poland | 46 | 0.1% |
| Portugal | 46 | 0.1% |
| Romania | 131 | 0.2% |
| Russia | 1,069 | 2.0% |
| Saudi Arabia | 20 | 0.0% |
| South Africa | 51 | 0.1% |
| South America | 424 | 0.8% |
| South Central Asia | 2,270 | 4.2% |
| South Eastern Asia | 1,139 | 2.1% |
| Southern Europe | 91 | 0.2% |
| Spain | 6 | 0.0% |
| Taiwan | 141 | 0.3% |
| Thailand | 162 | 0.3% |
| Trinidad and Tobago | 13 | 0.0% |
| Ukraine | 610 | 1.1% |
| Uzbekistan | 404 | 0.7% |
| Vietnam | 351 | 0.6% |
| Western Africa | 34 | 0.1% |
| Western Asia | 82 | 0.2% |
| Western Europe | 83 | 0.2% | View All 72 Rows |
Sex and Age in West Sacramento
Sex and Age in West Sacramento
The most populous age groups in West Sacramento are 35 to 39 Years (2,372 | 9.0%) for men and 10 to 14 Years (2,355 | 8.5%) for women.
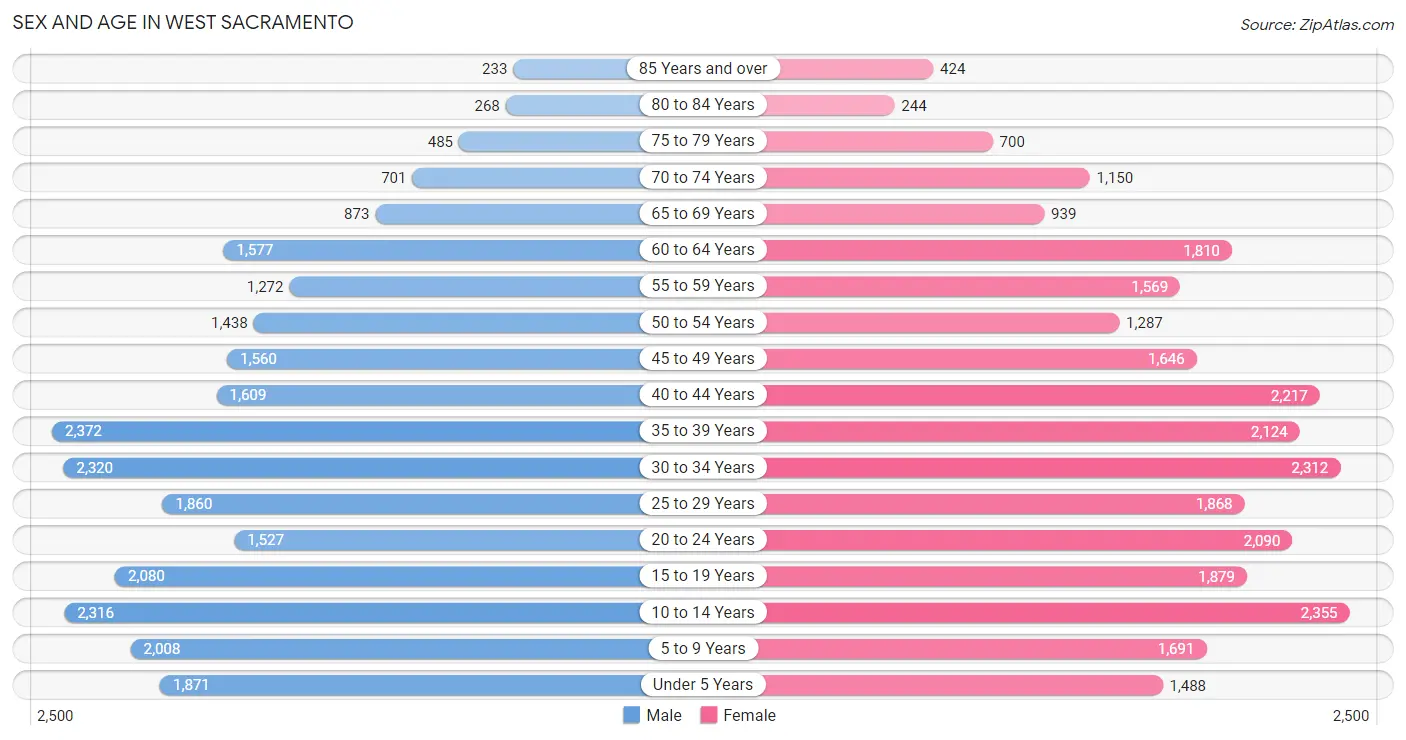
| Age Bracket | Male | Female |
| Under 5 Years | 1,871 (7.1%) | 1,488 (5.3%) |
| 5 to 9 Years | 2,008 (7.6%) | 1,691 (6.1%) |
| 10 to 14 Years | 2,316 (8.8%) | 2,355 (8.5%) |
| 15 to 19 Years | 2,080 (7.9%) | 1,879 (6.8%) |
| 20 to 24 Years | 1,527 (5.8%) | 2,090 (7.5%) |
| 25 to 29 Years | 1,860 (7.0%) | 1,868 (6.7%) |
| 30 to 34 Years | 2,320 (8.8%) | 2,312 (8.3%) |
| 35 to 39 Years | 2,372 (9.0%) | 2,124 (7.6%) |
| 40 to 44 Years | 1,609 (6.1%) | 2,217 (8.0%) |
| 45 to 49 Years | 1,560 (5.9%) | 1,646 (5.9%) |
| 50 to 54 Years | 1,438 (5.4%) | 1,287 (4.6%) |
| 55 to 59 Years | 1,272 (4.8%) | 1,569 (5.7%) |
| 60 to 64 Years | 1,577 (6.0%) | 1,810 (6.5%) |
| 65 to 69 Years | 873 (3.3%) | 939 (3.4%) |
| 70 to 74 Years | 701 (2.7%) | 1,150 (4.1%) |
| 75 to 79 Years | 485 (1.8%) | 700 (2.5%) |
| 80 to 84 Years | 268 (1.0%) | 244 (0.9%) |
| 85 Years and over | 233 (0.9%) | 424 (1.5%) |
| Total | 26,370 (100.0%) | 27,793 (100.0%) |
Families and Households in West Sacramento
Median Family Size in West Sacramento
The median family size in West Sacramento is 3.39 persons per family, with married-couple families (9,440 | 71.4%) accounting for the largest median family size of 3.48 persons per family. On the other hand, single male/father families (954 | 7.2%) represent the smallest median family size with 2.97 persons per family.
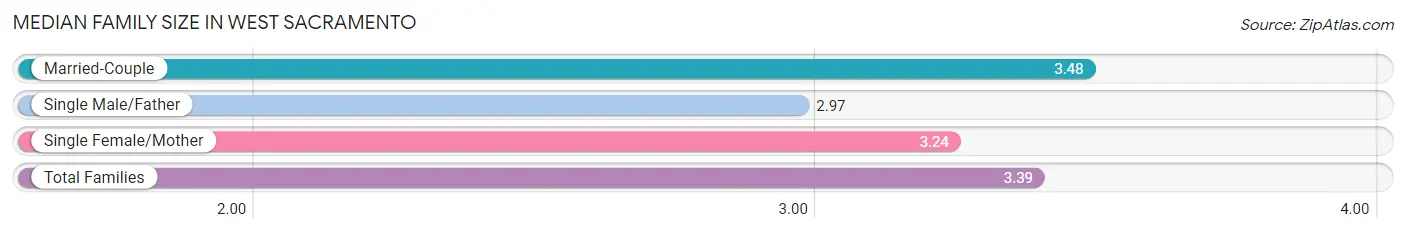
| Family Type | # Families | Family Size |
| Married-Couple | 9,440 (71.4%) | 3.48 |
| Single Male/Father | 954 (7.2%) | 2.97 |
| Single Female/Mother | 2,828 (21.4%) | 3.24 |
| Total Families | 13,222 (100.0%) | 3.39 |
Median Household Size in West Sacramento
The median household size in West Sacramento is 2.83 persons per household, with married-couple households (9,440 | 49.7%) accounting for the largest median household size of 3.51 persons per household. non-family households (5,757 | 30.3%) represent the smallest median household size with 1.30 persons per household.
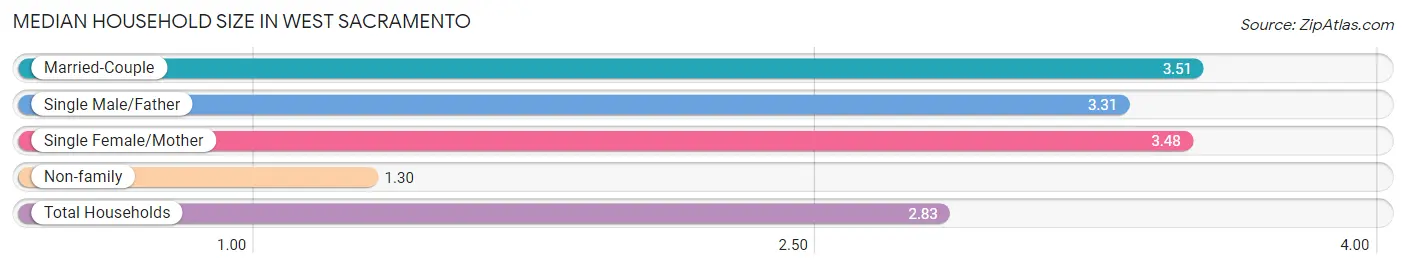
| Household Type | # Households | Household Size |
| Married-Couple | 9,440 (49.7%) | 3.51 |
| Single Male/Father | 954 (5.0%) | 3.31 |
| Single Female/Mother | 2,828 (14.9%) | 3.48 |
| Non-family | 5,757 (30.3%) | 1.30 |
| Total Households | 18,979 (100.0%) | 2.83 |
Household Size by Marriage Status in West Sacramento
Out of a total of 18,979 households in West Sacramento, 13,222 (69.7%) are family households, while 5,757 (30.3%) are nonfamily households. The most numerous type of family households are 2-person households, comprising 4,379, and the most common type of nonfamily households are 1-person households, comprising 4,143.
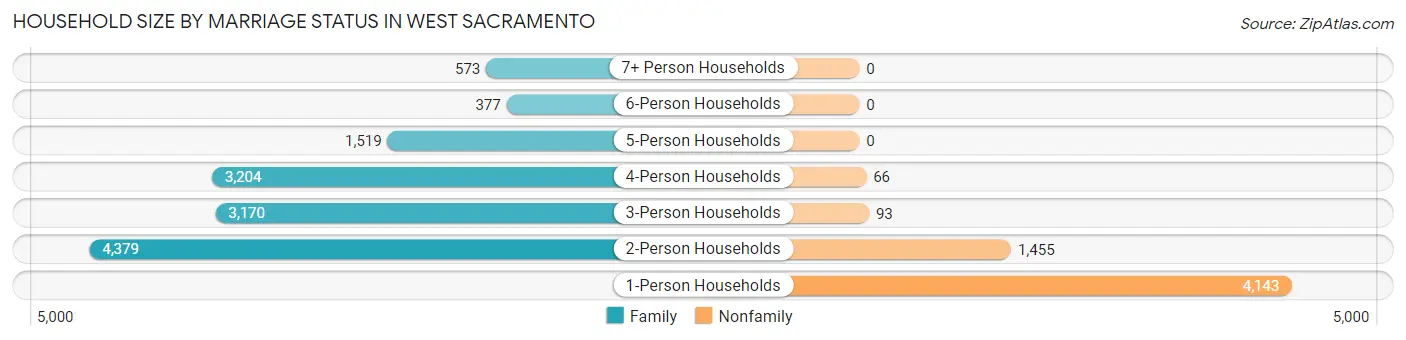
| Household Size | Family Households | Nonfamily Households |
| 1-Person Households | - | 4,143 (21.8%) |
| 2-Person Households | 4,379 (23.1%) | 1,455 (7.7%) |
| 3-Person Households | 3,170 (16.7%) | 93 (0.5%) |
| 4-Person Households | 3,204 (16.9%) | 66 (0.4%) |
| 5-Person Households | 1,519 (8.0%) | 0 (0.0%) |
| 6-Person Households | 377 (2.0%) | 0 (0.0%) |
| 7+ Person Households | 573 (3.0%) | 0 (0.0%) |
| Total | 13,222 (69.7%) | 5,757 (30.3%) |
Female Fertility in West Sacramento
Fertility by Age in West Sacramento
Average fertility rate in West Sacramento is 56.0 births per 1,000 women. Women in the age bracket of 20 to 34 years have the highest fertility rate with 89.0 births per 1,000 women. Women in the age bracket of 20 to 34 years acount for 69.4% of all women with births.
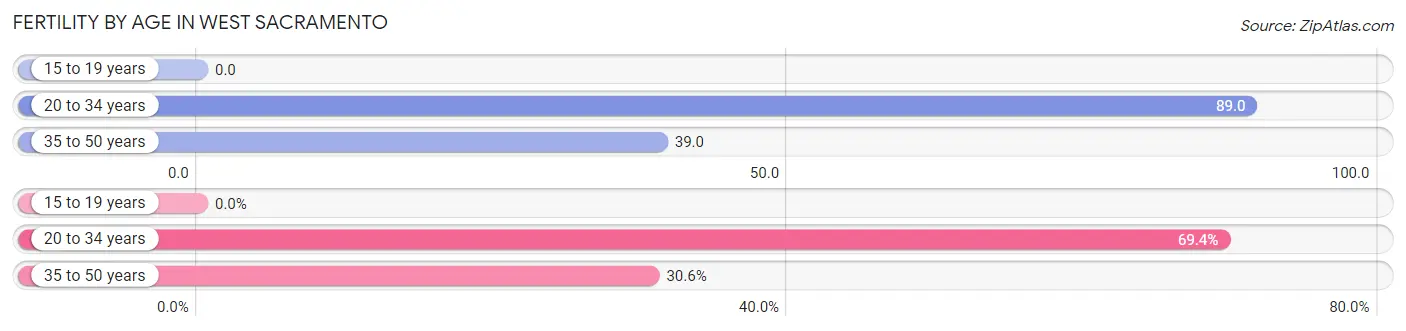
| Age Bracket | Women with Births | Births / 1,000 Women |
| 15 to 19 years | 0 (0.0%) | 0.0 |
| 20 to 34 years | 557 (69.4%) | 89.0 |
| 35 to 50 years | 246 (30.6%) | 39.0 |
| Total | 803 (100.0%) | 56.0 |
Fertility by Age by Marriage Status in West Sacramento
65.9% of women with births (803) in West Sacramento are married. The highest percentage of unmarried women with births falls into 20 to 34 years age bracket with 42.4% of them unmarried at the time of birth, while the lowest percentage of unmarried women with births belong to 35 to 50 years age bracket with 15.4% of them unmarried.
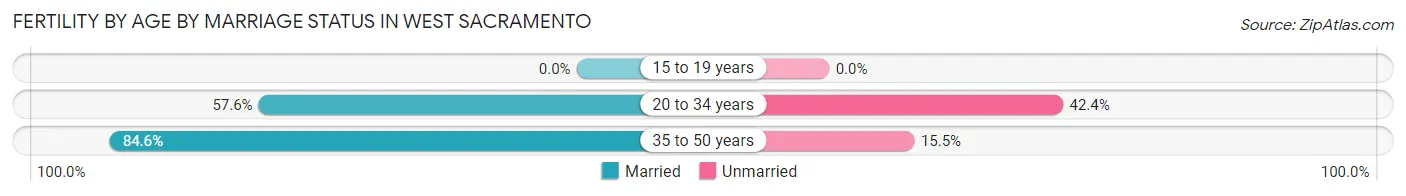
| Age Bracket | Married | Unmarried |
| 15 to 19 years | 0 (0.0%) | 0 (0.0%) |
| 20 to 34 years | 321 (57.6%) | 236 (42.4%) |
| 35 to 50 years | 208 (84.6%) | 38 (15.4%) |
| Total | 529 (65.9%) | 274 (34.1%) |
Fertility by Education in West Sacramento
Average fertility rate in West Sacramento is 56.0 births per 1,000 women. Women with the education attainment of high school diploma have the highest fertility rate of 78.0 births per 1,000 women, while women with the education attainment of less than high school have the lowest fertility at 30.0 births per 1,000 women. Women with the education attainment of bachelor's degree represent 30.4% of all women with births.
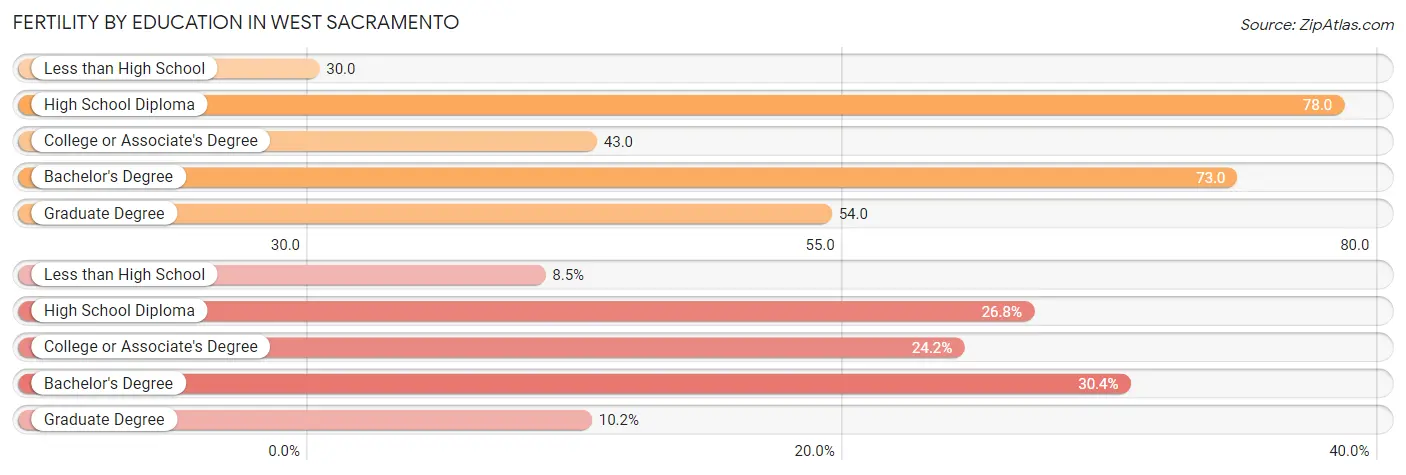
| Educational Attainment | Women with Births | Births / 1,000 Women |
| Less than High School | 68 (8.5%) | 30.0 |
| High School Diploma | 215 (26.8%) | 78.0 |
| College or Associate's Degree | 194 (24.2%) | 43.0 |
| Bachelor's Degree | 244 (30.4%) | 73.0 |
| Graduate Degree | 82 (10.2%) | 54.0 |
| Total | 803 (100.0%) | 56.0 |
Fertility by Education by Marriage Status in West Sacramento
34.1% of women with births in West Sacramento are unmarried. Women with the educational attainment of graduate degree are most likely to be married with 100.0% of them married at childbirth, while women with the educational attainment of college or associate's degree are least likely to be married with 84.0% of them unmarried at childbirth.
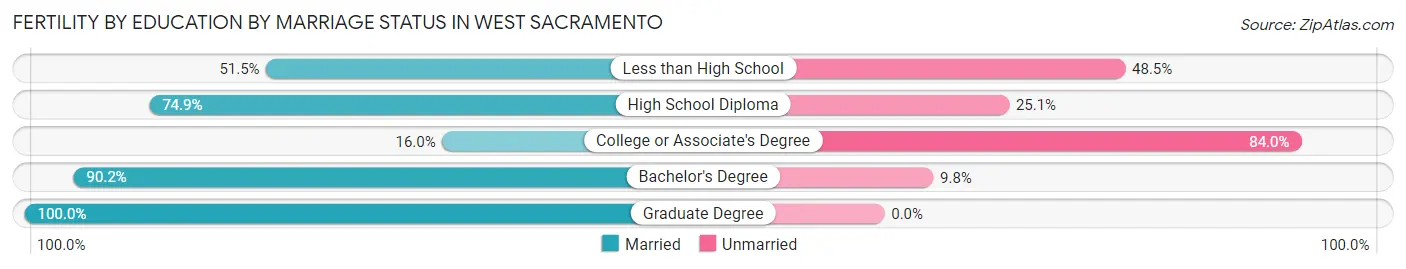
| Educational Attainment | Married | Unmarried |
| Less than High School | 35 (51.5%) | 33 (48.5%) |
| High School Diploma | 161 (74.9%) | 54 (25.1%) |
| College or Associate's Degree | 31 (16.0%) | 163 (84.0%) |
| Bachelor's Degree | 220 (90.2%) | 24 (9.8%) |
| Graduate Degree | 82 (100.0%) | 0 (0.0%) |
| Total | 529 (65.9%) | 274 (34.1%) |
Employment Characteristics in West Sacramento
Employment by Class of Employer in West Sacramento
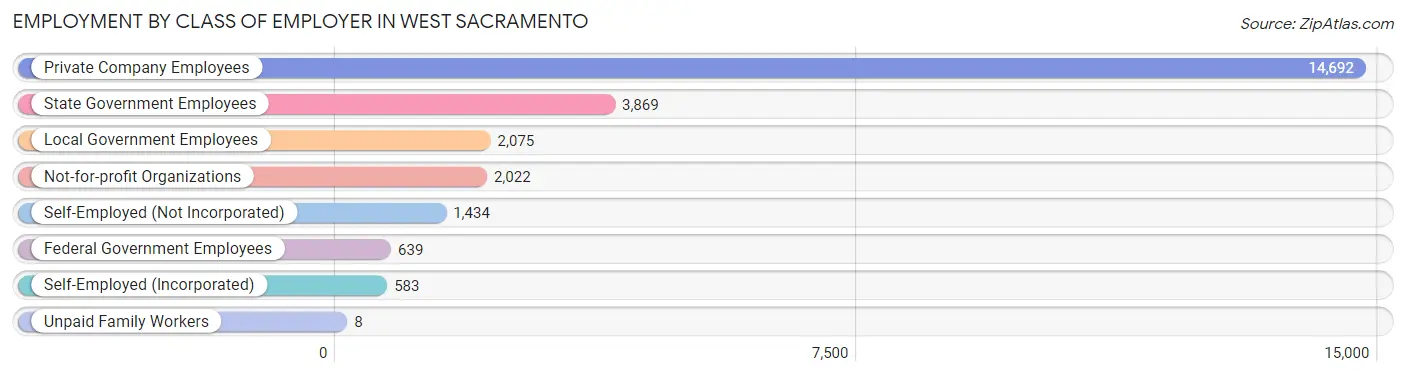
Among the 25,322 employed individuals in West Sacramento, private company employees (14,692 | 58.0%), state government employees (3,869 | 15.3%), and local government employees (2,075 | 8.2%) make up the most common classes of employment.
| Employer Class | # Employees | % Employees |
| Private Company Employees | 14,692 | 58.0% |
| Self-Employed (Incorporated) | 583 | 2.3% |
| Self-Employed (Not Incorporated) | 1,434 | 5.7% |
| Not-for-profit Organizations | 2,022 | 8.0% |
| Local Government Employees | 2,075 | 8.2% |
| State Government Employees | 3,869 | 15.3% |
| Federal Government Employees | 639 | 2.5% |
| Unpaid Family Workers | 8 | 0.0% |
| Total | 25,322 | 100.0% |
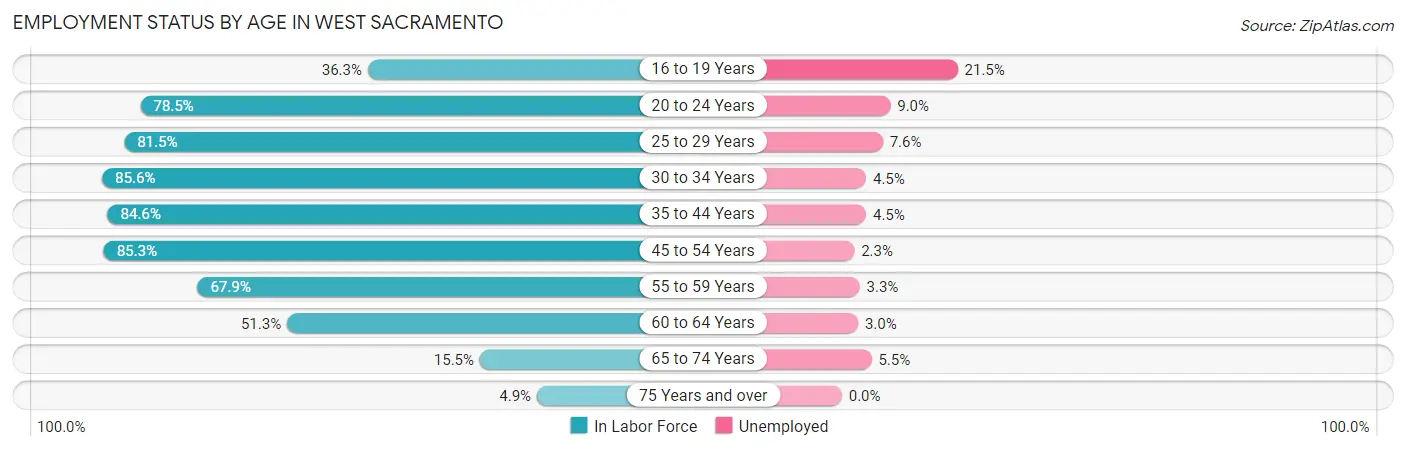
Employment Status by Age in West Sacramento
According to the labor force statistics for West Sacramento, out of the total population over 16 years of age (41,773), 65.8% or 27,487 individuals are in the labor force, with 5.4% or 1,484 of them unemployed. The age group with the highest labor force participation rate is 30 to 34 years, with 85.6% or 3,965 individuals in the labor force. Within the labor force, the 16 to 19 years age range has the highest percentage of unemployed individuals, with 21.5% or 257 of them being unemployed.
| Age Bracket | In Labor Force | Unemployed |
| 16 to 19 Years | 1,197 (36.3%) | 257 (21.5%) |
| 20 to 24 Years | 2,839 (78.5%) | 256 (9.0%) |
| 25 to 29 Years | 3,038 (81.5%) | 231 (7.6%) |
| 30 to 34 Years | 3,965 (85.6%) | 178 (4.5%) |
| 35 to 44 Years | 7,040 (84.6%) | 317 (4.5%) |
| 45 to 54 Years | 5,059 (85.3%) | 116 (2.3%) |
| 55 to 59 Years | 1,929 (67.9%) | 64 (3.3%) |
| 60 to 64 Years | 1,738 (51.3%) | 52 (3.0%) |
| 65 to 74 Years | 568 (15.5%) | 31 (5.5%) |
| 75 Years and over | 115 (4.9%) | 0 (0.0%) |
| Total | 27,487 (65.8%) | 1,484 (5.4%) |
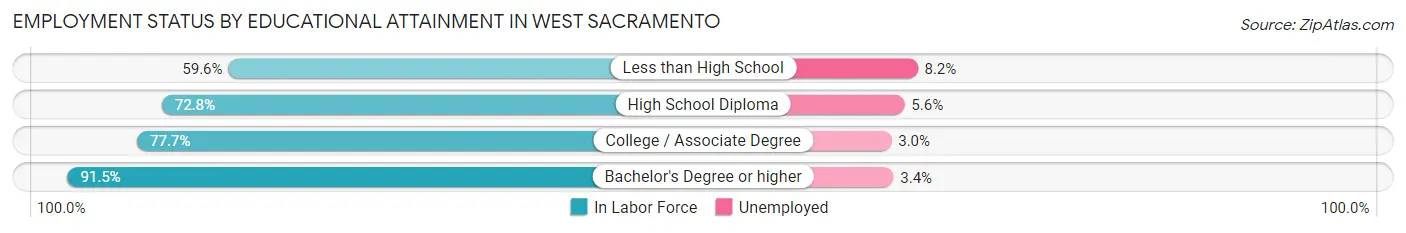
Employment Status by Educational Attainment in West Sacramento
According to labor force statistics for West Sacramento, 78.9% of individuals (22,756) out of the total population between 25 and 64 years of age (28,841) are in the labor force, with 4.2% or 956 of them being unemployed. The group with the highest labor force participation rate are those with the educational attainment of bachelor's degree or higher, with 91.5% or 8,992 individuals in the labor force. Within the labor force, individuals with less than high school education have the highest percentage of unemployment, with 8.2% or 191 of them being unemployed.
| Educational Attainment | In Labor Force | Unemployed |
| Less than High School | 2,331 (59.6%) | 321 (8.2%) |
| High School Diploma | 4,283 (72.8%) | 329 (5.6%) |
| College / Associate Degree | 7,164 (77.7%) | 277 (3.0%) |
| Bachelor's Degree or higher | 8,992 (91.5%) | 334 (3.4%) |
| Total | 22,756 (78.9%) | 1,211 (4.2%) |
Employment Occupations by Sex in West Sacramento
Management, Business, Science and Arts Occupations
The most common Management, Business, Science and Arts occupations in West Sacramento are Management (3,080 | 11.9%), Computers, Engineering & Science (2,729 | 10.5%), Community & Social Service (2,458 | 9.5%), Business & Financial (1,584 | 6.1%), and Health Diagnosing & Treating (1,523 | 5.9%).
Management, Business, Science and Arts Occupations by Sex
Within the Management, Business, Science and Arts occupations in West Sacramento, the most male-oriented occupations are Architecture & Engineering (77.3%), Computers & Mathematics (69.6%), and Computers, Engineering & Science (67.8%), while the most female-oriented occupations are Education Instruction & Library (85.8%), Health Technologists (79.0%), and Health Diagnosing & Treating (77.7%).
| Occupation | Male | Female |
| Management | 1,479 (48.0%) | 1,601 (52.0%) |
| Business & Financial | 627 (39.6%) | 957 (60.4%) |
| Computers, Engineering & Science | 1,850 (67.8%) | 879 (32.2%) |
| Computers & Mathematics | 981 (69.6%) | 428 (30.4%) |
| Architecture & Engineering | 566 (77.3%) | 166 (22.7%) |
| Life, Physical & Social Science | 303 (51.5%) | 285 (48.5%) |
| Community & Social Service | 913 (37.1%) | 1,545 (62.9%) |
| Education, Arts & Media | 203 (55.3%) | 164 (44.7%) |
| Legal Services & Support | 343 (57.2%) | 257 (42.8%) |
| Education Instruction & Library | 157 (14.2%) | 950 (85.8%) |
| Arts, Media & Entertainment | 210 (54.7%) | 174 (45.3%) |
| Health Diagnosing & Treating | 340 (22.3%) | 1,183 (77.7%) |
| Health Technologists | 221 (21.0%) | 831 (79.0%) |
| Total (Category) | 5,209 (45.8%) | 6,165 (54.2%) |
| Total (Overall) | 13,266 (51.1%) | 12,689 (48.9%) |
Services Occupations
The most common Services occupations in West Sacramento are Food Preparation & Serving (1,397 | 5.4%), Cleaning & Maintenance (1,099 | 4.2%), Healthcare Support (925 | 3.6%), Personal Care & Service (632 | 2.4%), and Security & Protection (496 | 1.9%).
Services Occupations by Sex
Within the Services occupations in West Sacramento, the most male-oriented occupations are Law Enforcement (96.6%), Security & Protection (93.3%), and Firefighting & Prevention (85.6%), while the most female-oriented occupations are Personal Care & Service (91.3%), Healthcare Support (79.8%), and Cleaning & Maintenance (61.0%).
| Occupation | Male | Female |
| Healthcare Support | 187 (20.2%) | 738 (79.8%) |
| Security & Protection | 463 (93.3%) | 33 (6.7%) |
| Firefighting & Prevention | 125 (85.6%) | 21 (14.4%) |
| Law Enforcement | 338 (96.6%) | 12 (3.4%) |
| Food Preparation & Serving | 656 (47.0%) | 741 (53.0%) |
| Cleaning & Maintenance | 429 (39.0%) | 670 (61.0%) |
| Personal Care & Service | 55 (8.7%) | 577 (91.3%) |
| Total (Category) | 1,790 (39.4%) | 2,759 (60.7%) |
| Total (Overall) | 13,266 (51.1%) | 12,689 (48.9%) |
Sales and Office Occupations
The most common Sales and Office occupations in West Sacramento are Office & Administration (2,545 | 9.8%), and Sales & Related (2,032 | 7.8%).
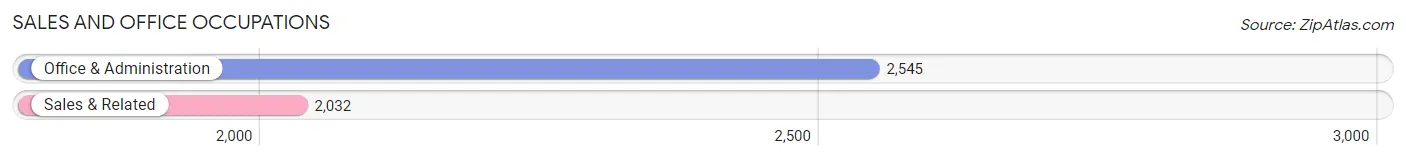
Sales and Office Occupations by Sex
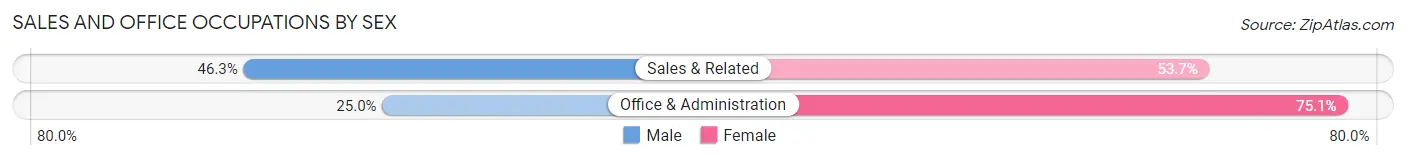
| Occupation | Male | Female |
| Sales & Related | 941 (46.3%) | 1,091 (53.7%) |
| Office & Administration | 635 (24.9%) | 1,910 (75.0%) |
| Total (Category) | 1,576 (34.4%) | 3,001 (65.6%) |
| Total (Overall) | 13,266 (51.1%) | 12,689 (48.9%) |
Natural Resources, Construction and Maintenance Occupations
The most common Natural Resources, Construction and Maintenance occupations in West Sacramento are Construction & Extraction (1,721 | 6.6%), Installation, Maintenance & Repair (701 | 2.7%), and Farming, Fishing & Forestry (117 | 0.4%).
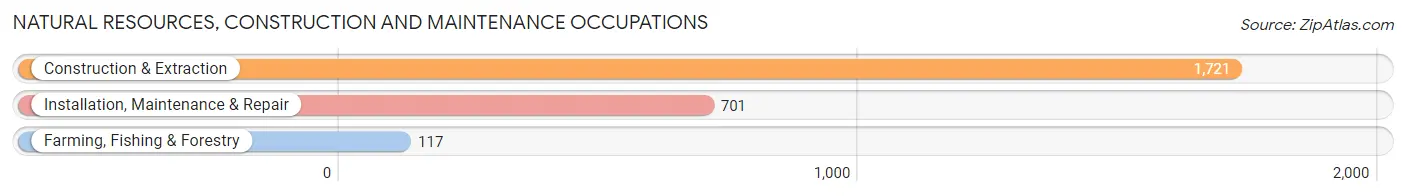
Natural Resources, Construction and Maintenance Occupations by Sex
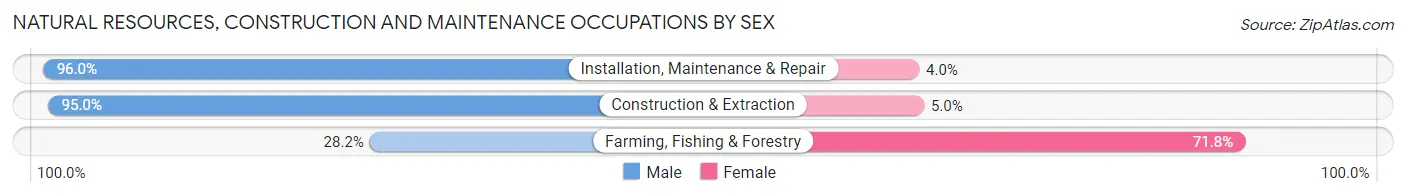
| Occupation | Male | Female |
| Farming, Fishing & Forestry | 33 (28.2%) | 84 (71.8%) |
| Construction & Extraction | 1,635 (95.0%) | 86 (5.0%) |
| Installation, Maintenance & Repair | 673 (96.0%) | 28 (4.0%) |
| Total (Category) | 2,341 (92.2%) | 198 (7.8%) |
| Total (Overall) | 13,266 (51.1%) | 12,689 (48.9%) |
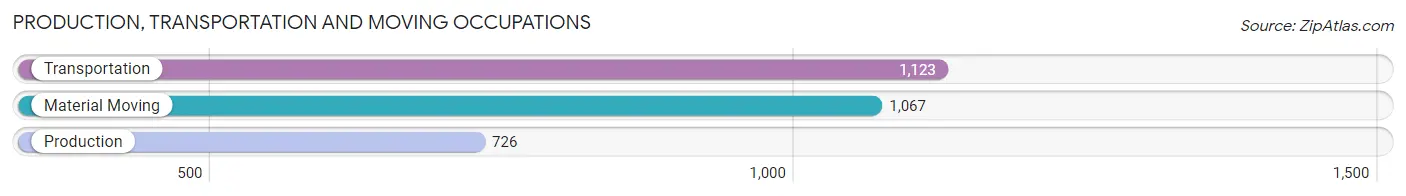
Production, Transportation and Moving Occupations
The most common Production, Transportation and Moving occupations in West Sacramento are Transportation (1,123 | 4.3%), Material Moving (1,067 | 4.1%), and Production (726 | 2.8%).
Production, Transportation and Moving Occupations by Sex
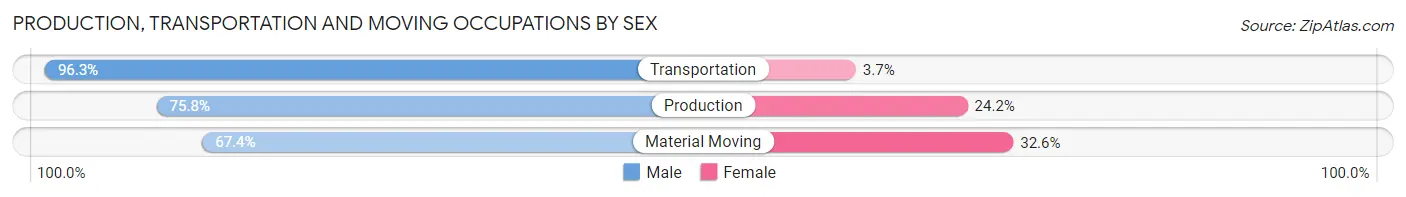
| Occupation | Male | Female |
| Production | 550 (75.8%) | 176 (24.2%) |
| Transportation | 1,081 (96.3%) | 42 (3.7%) |
| Material Moving | 719 (67.4%) | 348 (32.6%) |
| Total (Category) | 2,350 (80.6%) | 566 (19.4%) |
| Total (Overall) | 13,266 (51.1%) | 12,689 (48.9%) |
Employment Industries by Sex in West Sacramento
Employment Industries in West Sacramento
The major employment industries in West Sacramento include Public Administration (3,546 | 13.7%), Health Care & Social Assistance (3,204 | 12.3%), Retail Trade (2,326 | 9.0%), Professional & Scientific (1,995 | 7.7%), and Construction (1,969 | 7.6%).
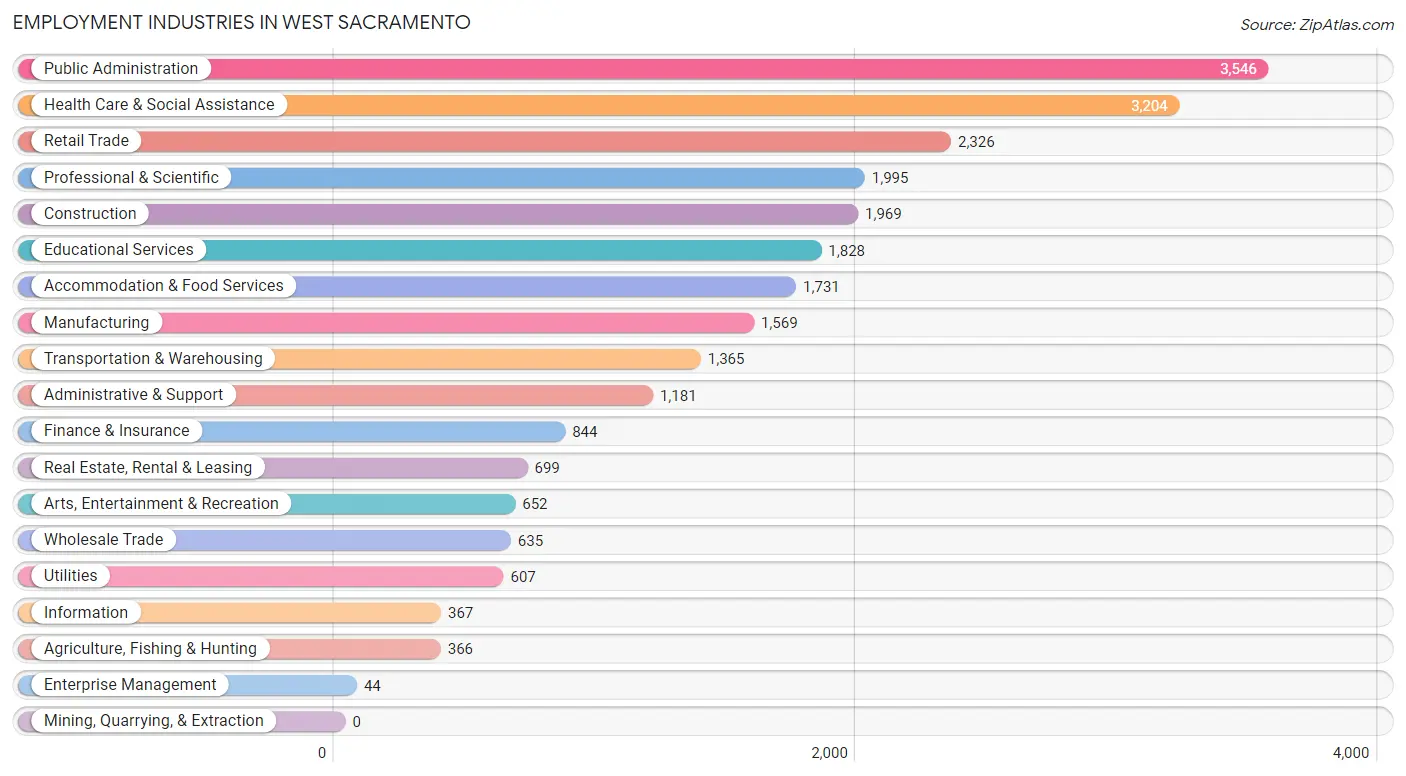
Employment Industries by Sex in West Sacramento
The West Sacramento industries that see more men than women are Construction (94.2%), Transportation & Warehousing (80.4%), and Manufacturing (69.7%), whereas the industries that tend to have a higher number of women are Enterprise Management (100.0%), Health Care & Social Assistance (74.5%), and Educational Services (67.5%).
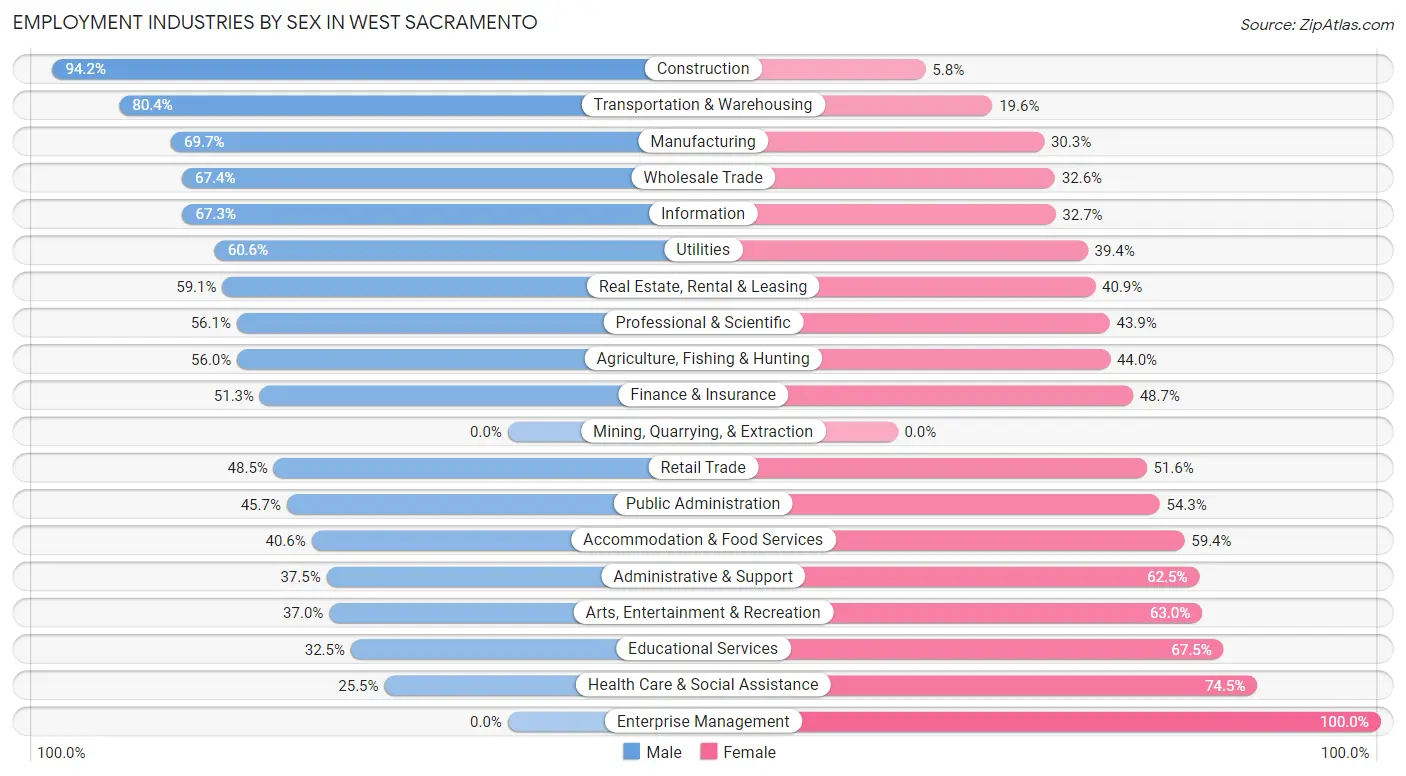
| Industry | Male | Female |
| Agriculture, Fishing & Hunting | 205 (56.0%) | 161 (44.0%) |
| Mining, Quarrying, & Extraction | 0 (0.0%) | 0 (0.0%) |
| Construction | 1,855 (94.2%) | 114 (5.8%) |
| Manufacturing | 1,093 (69.7%) | 476 (30.3%) |
| Wholesale Trade | 428 (67.4%) | 207 (32.6%) |
| Retail Trade | 1,127 (48.4%) | 1,199 (51.5%) |
| Transportation & Warehousing | 1,097 (80.4%) | 268 (19.6%) |
| Utilities | 368 (60.6%) | 239 (39.4%) |
| Information | 247 (67.3%) | 120 (32.7%) |
| Finance & Insurance | 433 (51.3%) | 411 (48.7%) |
| Real Estate, Rental & Leasing | 413 (59.1%) | 286 (40.9%) |
| Professional & Scientific | 1,119 (56.1%) | 876 (43.9%) |
| Enterprise Management | 0 (0.0%) | 44 (100.0%) |
| Administrative & Support | 443 (37.5%) | 738 (62.5%) |
| Educational Services | 594 (32.5%) | 1,234 (67.5%) |
| Health Care & Social Assistance | 818 (25.5%) | 2,386 (74.5%) |
| Arts, Entertainment & Recreation | 241 (37.0%) | 411 (63.0%) |
| Accommodation & Food Services | 703 (40.6%) | 1,028 (59.4%) |
| Public Administration | 1,622 (45.7%) | 1,924 (54.3%) |
| Total | 13,266 (51.1%) | 12,689 (48.9%) |
Education in West Sacramento
School Enrollment in West Sacramento
The most common levels of schooling among the 15,577 students in West Sacramento are college / undergraduate (3,450 | 22.2%), middle school (3,295 | 21.1%), and high school (3,272 | 21.0%).
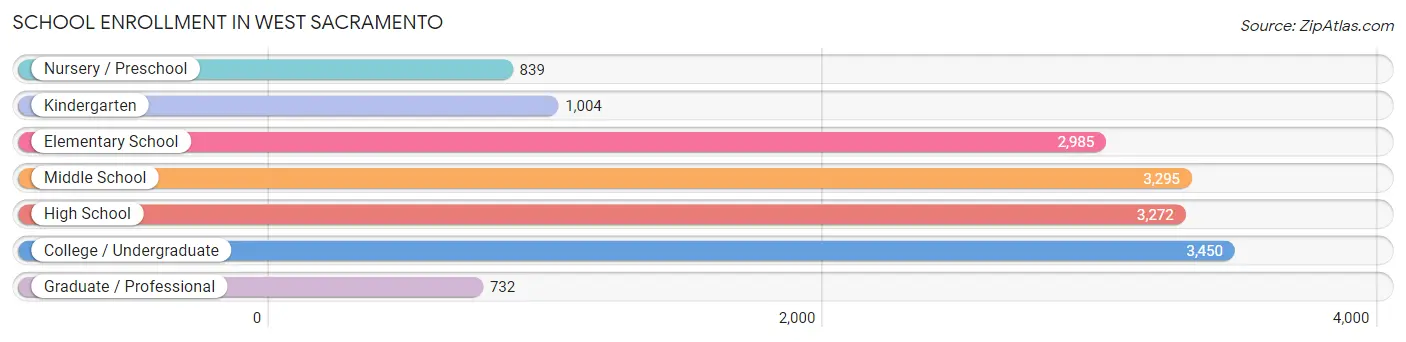
| School Level | # Students | % Students |
| Nursery / Preschool | 839 | 5.4% |
| Kindergarten | 1,004 | 6.5% |
| Elementary School | 2,985 | 19.2% |
| Middle School | 3,295 | 21.1% |
| High School | 3,272 | 21.0% |
| College / Undergraduate | 3,450 | 22.2% |
| Graduate / Professional | 732 | 4.7% |
| Total | 15,577 | 100.0% |
School Enrollment by Age by Funding Source in West Sacramento
Out of a total of 15,577 students who are enrolled in schools in West Sacramento, 2,072 (13.3%) attend a private institution, while the remaining 13,505 (86.7%) are enrolled in public schools. The age group of 3 to 4 year olds has the highest likelihood of being enrolled in private schools, with 357 (47.2% in the age bracket) enrolled. Conversely, the age group of 18 to 19 year olds has the lowest likelihood of being enrolled in a private school, with 1,301 (97.1% in the age bracket) attending a public institution.
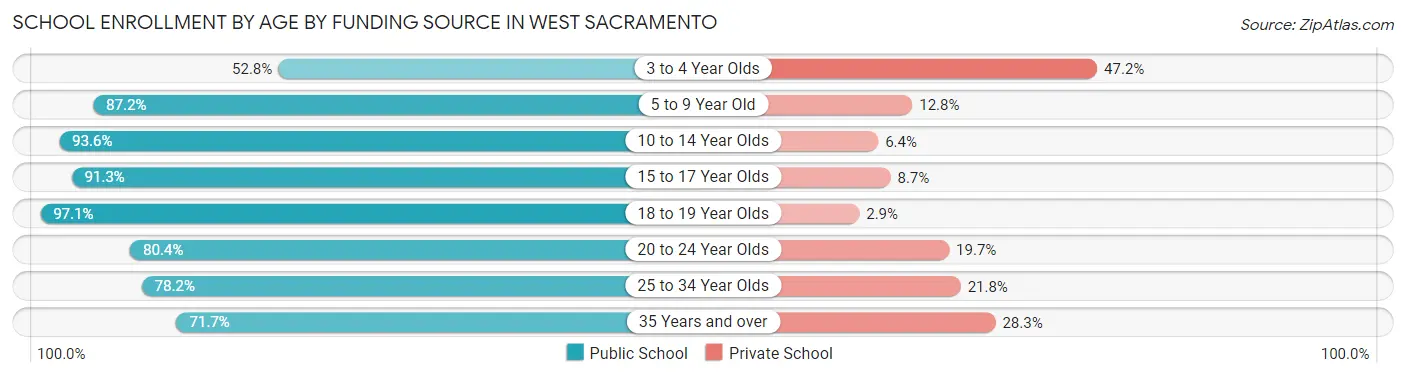
| Age Bracket | Public School | Private School |
| 3 to 4 Year Olds | 399 (52.8%) | 357 (47.2%) |
| 5 to 9 Year Old | 3,058 (87.2%) | 448 (12.8%) |
| 10 to 14 Year Olds | 4,320 (93.6%) | 297 (6.4%) |
| 15 to 17 Year Olds | 1,882 (91.3%) | 180 (8.7%) |
| 18 to 19 Year Olds | 1,301 (97.1%) | 39 (2.9%) |
| 20 to 24 Year Olds | 1,116 (80.3%) | 273 (19.7%) |
| 25 to 34 Year Olds | 800 (78.2%) | 223 (21.8%) |
| 35 Years and over | 634 (71.7%) | 250 (28.3%) |
| Total | 13,505 (86.7%) | 2,072 (13.3%) |
Educational Attainment by Field of Study in West Sacramento
Business (1,721 | 14.1%), social sciences (1,576 | 12.9%), bio, nature & agricultural (1,389 | 11.4%), science & technology (1,092 | 8.9%), and arts & humanities (865 | 7.1%) are the most common fields of study among 12,241 individuals in West Sacramento who have obtained a bachelor's degree or higher.
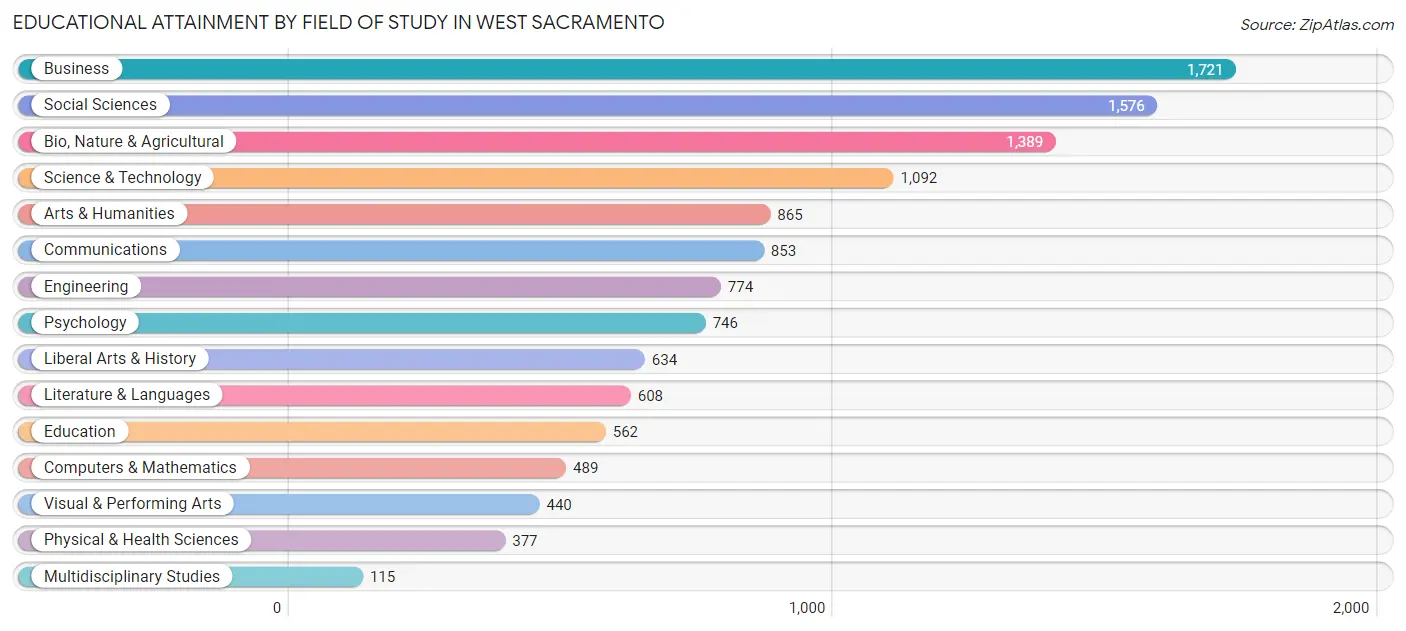
| Field of Study | # Graduates | % Graduates |
| Computers & Mathematics | 489 | 4.0% |
| Bio, Nature & Agricultural | 1,389 | 11.4% |
| Physical & Health Sciences | 377 | 3.1% |
| Psychology | 746 | 6.1% |
| Social Sciences | 1,576 | 12.9% |
| Engineering | 774 | 6.3% |
| Multidisciplinary Studies | 115 | 0.9% |
| Science & Technology | 1,092 | 8.9% |
| Business | 1,721 | 14.1% |
| Education | 562 | 4.6% |
| Literature & Languages | 608 | 5.0% |
| Liberal Arts & History | 634 | 5.2% |
| Visual & Performing Arts | 440 | 3.6% |
| Communications | 853 | 7.0% |
| Arts & Humanities | 865 | 7.1% |
| Total | 12,241 | 100.0% |
Transportation & Commute in West Sacramento
Vehicle Availability by Sex in West Sacramento
The most prevalent vehicle ownership categories in West Sacramento are males with 2 vehicles (5,314, accounting for 41.4%) and females with 2 vehicles (4,925, making up 43.6%).
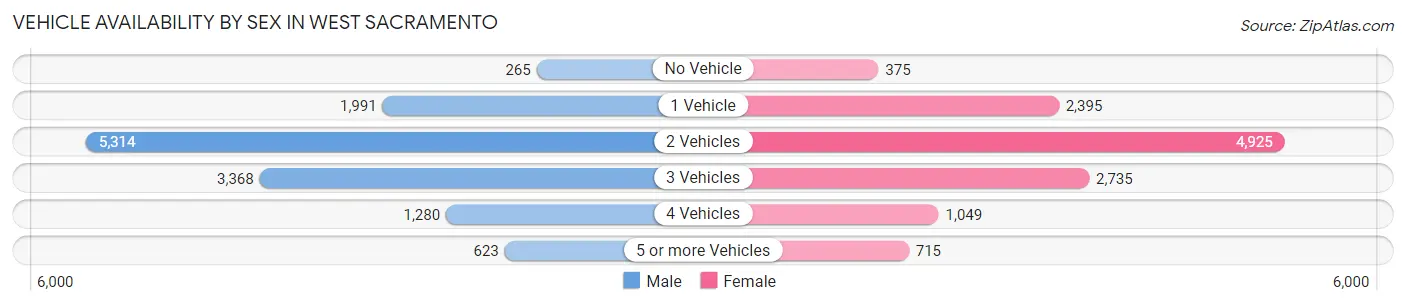
| Vehicles Available | Male | Female |
| No Vehicle | 265 (2.1%) | 375 (3.1%) |
| 1 Vehicle | 1,991 (15.5%) | 2,395 (19.6%) |
| 2 Vehicles | 5,314 (41.4%) | 4,925 (40.4%) |
| 3 Vehicles | 3,368 (26.2%) | 2,735 (22.4%) |
| 4 Vehicles | 1,280 (10.0%) | 1,049 (8.6%) |
| 5 or more Vehicles | 623 (4.9%) | 715 (5.9%) |
| Total | 12,841 (100.0%) | 12,194 (100.0%) |
Commute Time in West Sacramento
The most frequently occuring commute durations in West Sacramento are 15 to 19 minutes (4,156 commuters, 19.1%), 20 to 24 minutes (4,000 commuters, 18.4%), and 10 to 14 minutes (3,826 commuters, 17.6%).
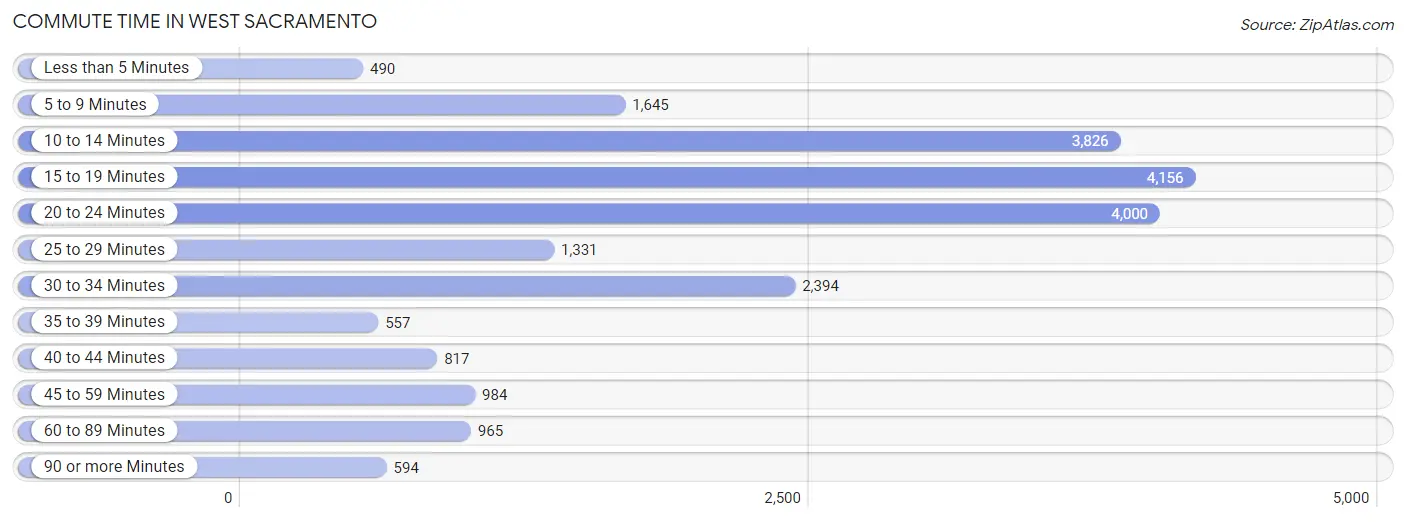
| Commute Time | # Commuters | % Commuters |
| Less than 5 Minutes | 490 | 2.2% |
| 5 to 9 Minutes | 1,645 | 7.6% |
| 10 to 14 Minutes | 3,826 | 17.6% |
| 15 to 19 Minutes | 4,156 | 19.1% |
| 20 to 24 Minutes | 4,000 | 18.4% |
| 25 to 29 Minutes | 1,331 | 6.1% |
| 30 to 34 Minutes | 2,394 | 11.0% |
| 35 to 39 Minutes | 557 | 2.6% |
| 40 to 44 Minutes | 817 | 3.7% |
| 45 to 59 Minutes | 984 | 4.5% |
| 60 to 89 Minutes | 965 | 4.4% |
| 90 or more Minutes | 594 | 2.7% |
Commute Time by Sex in West Sacramento
The most common commute times in West Sacramento are 20 to 24 minutes (2,190 commuters, 19.0%) for males and 15 to 19 minutes (2,349 commuters, 23.0%) for females.
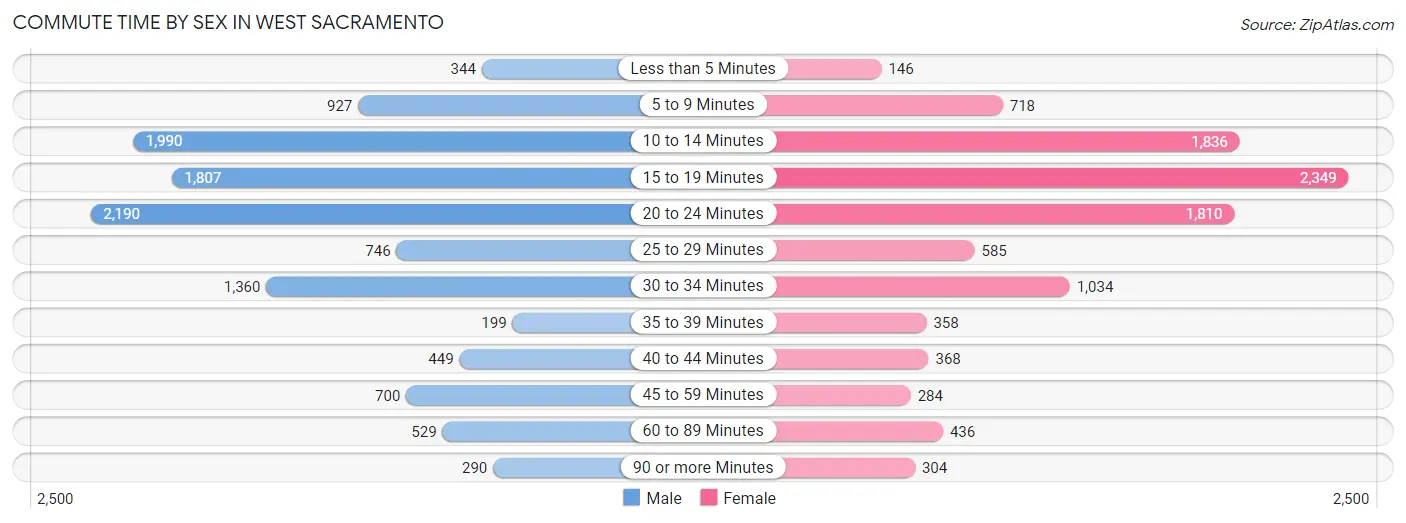
| Commute Time | Male | Female |
| Less than 5 Minutes | 344 (3.0%) | 146 (1.4%) |
| 5 to 9 Minutes | 927 (8.0%) | 718 (7.0%) |
| 10 to 14 Minutes | 1,990 (17.3%) | 1,836 (17.9%) |
| 15 to 19 Minutes | 1,807 (15.7%) | 2,349 (23.0%) |
| 20 to 24 Minutes | 2,190 (19.0%) | 1,810 (17.7%) |
| 25 to 29 Minutes | 746 (6.5%) | 585 (5.7%) |
| 30 to 34 Minutes | 1,360 (11.8%) | 1,034 (10.1%) |
| 35 to 39 Minutes | 199 (1.7%) | 358 (3.5%) |
| 40 to 44 Minutes | 449 (3.9%) | 368 (3.6%) |
| 45 to 59 Minutes | 700 (6.1%) | 284 (2.8%) |
| 60 to 89 Minutes | 529 (4.6%) | 436 (4.3%) |
| 90 or more Minutes | 290 (2.5%) | 304 (3.0%) |
Time of Departure to Work by Sex in West Sacramento
The most frequent times of departure to work in West Sacramento are 7:30 AM to 7:59 AM (1,627, 14.1%) for males and 7:30 AM to 7:59 AM (1,526, 14.9%) for females.
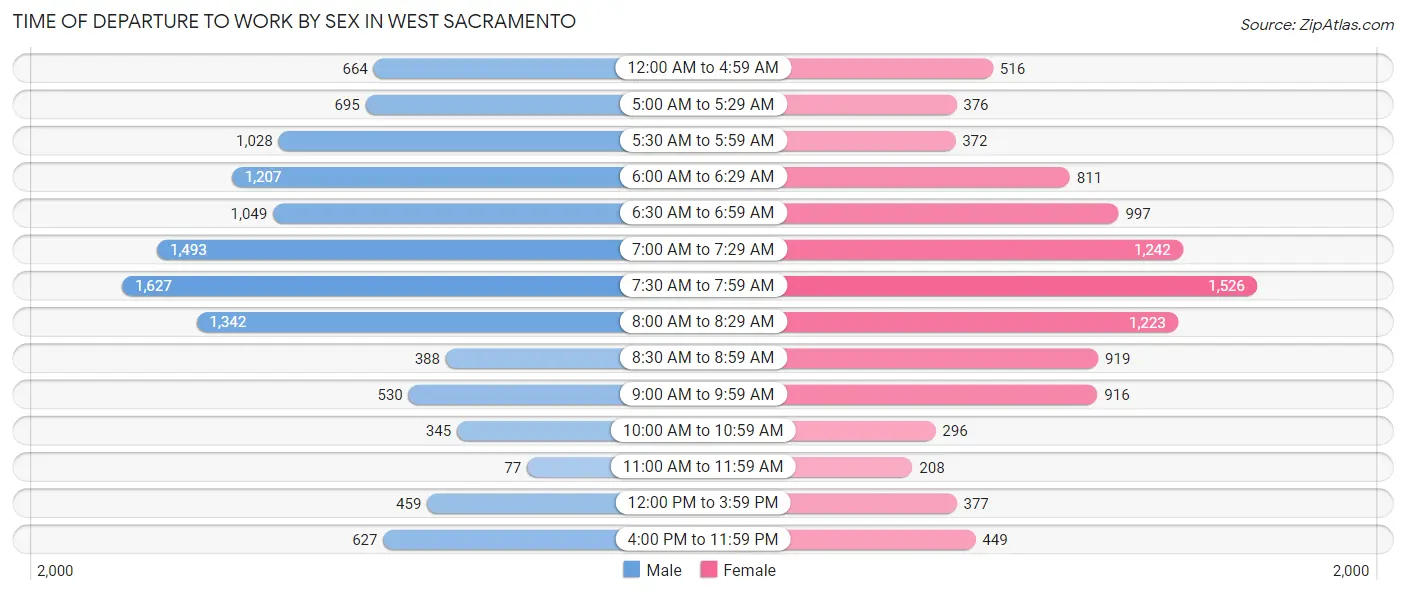
| Time of Departure | Male | Female |
| 12:00 AM to 4:59 AM | 664 (5.8%) | 516 (5.0%) |
| 5:00 AM to 5:29 AM | 695 (6.0%) | 376 (3.7%) |
| 5:30 AM to 5:59 AM | 1,028 (8.9%) | 372 (3.6%) |
| 6:00 AM to 6:29 AM | 1,207 (10.5%) | 811 (7.9%) |
| 6:30 AM to 6:59 AM | 1,049 (9.1%) | 997 (9.8%) |
| 7:00 AM to 7:29 AM | 1,493 (13.0%) | 1,242 (12.1%) |
| 7:30 AM to 7:59 AM | 1,627 (14.1%) | 1,526 (14.9%) |
| 8:00 AM to 8:29 AM | 1,342 (11.6%) | 1,223 (12.0%) |
| 8:30 AM to 8:59 AM | 388 (3.4%) | 919 (9.0%) |
| 9:00 AM to 9:59 AM | 530 (4.6%) | 916 (9.0%) |
| 10:00 AM to 10:59 AM | 345 (3.0%) | 296 (2.9%) |
| 11:00 AM to 11:59 AM | 77 (0.7%) | 208 (2.0%) |
| 12:00 PM to 3:59 PM | 459 (4.0%) | 377 (3.7%) |
| 4:00 PM to 11:59 PM | 627 (5.4%) | 449 (4.4%) |
| Total | 11,531 (100.0%) | 10,228 (100.0%) |
Housing Occupancy in West Sacramento
Occupancy by Ownership in West Sacramento
Of the total 18,979 dwellings in West Sacramento, owner-occupied units account for 10,988 (57.9%), while renter-occupied units make up 7,991 (42.1%).
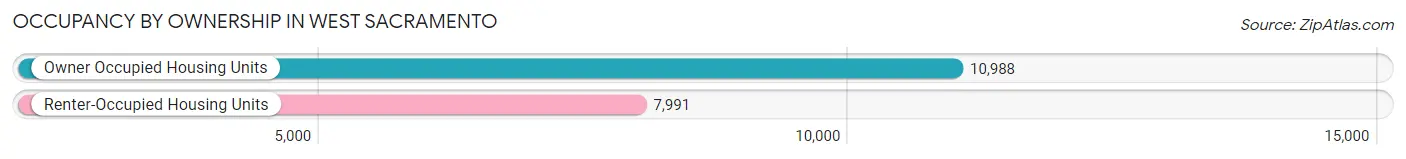
| Occupancy | # Housing Units | % Housing Units |
| Owner Occupied Housing Units | 10,988 | 57.9% |
| Renter-Occupied Housing Units | 7,991 | 42.1% |
| Total Occupied Housing Units | 18,979 | 100.0% |
Occupancy by Household Size in West Sacramento
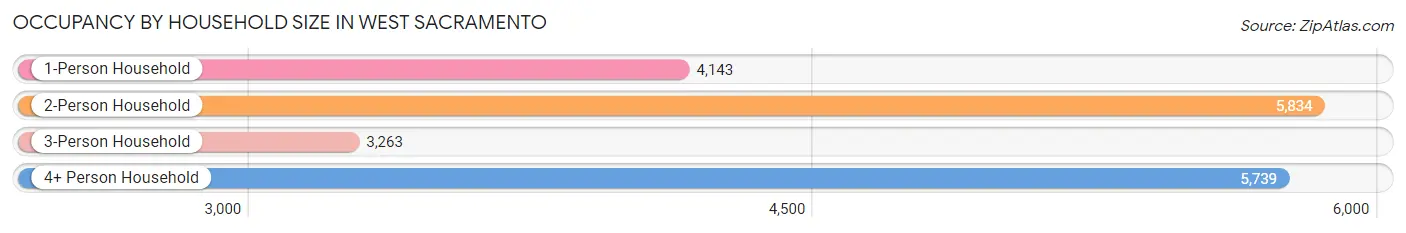
| Household Size | # Housing Units | % Housing Units |
| 1-Person Household | 4,143 | 21.8% |
| 2-Person Household | 5,834 | 30.7% |
| 3-Person Household | 3,263 | 17.2% |
| 4+ Person Household | 5,739 | 30.2% |
| Total Housing Units | 18,979 | 100.0% |
Occupancy by Ownership by Household Size in West Sacramento
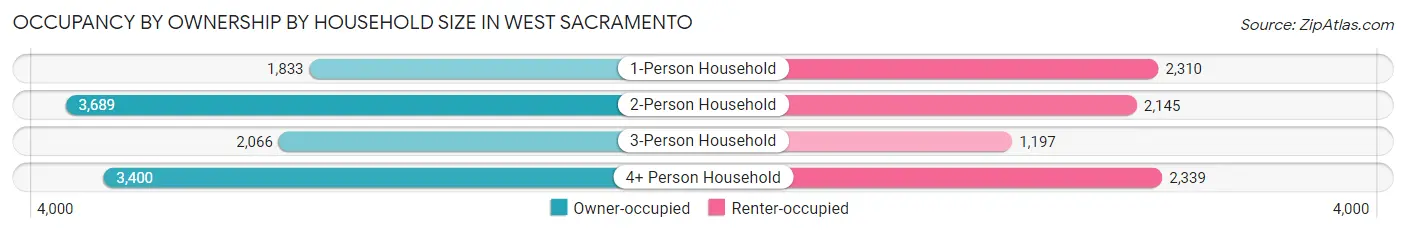
| Household Size | Owner-occupied | Renter-occupied |
| 1-Person Household | 1,833 (44.2%) | 2,310 (55.8%) |
| 2-Person Household | 3,689 (63.2%) | 2,145 (36.8%) |
| 3-Person Household | 2,066 (63.3%) | 1,197 (36.7%) |
| 4+ Person Household | 3,400 (59.2%) | 2,339 (40.8%) |
| Total Housing Units | 10,988 (57.9%) | 7,991 (42.1%) |
Occupancy by Educational Attainment in West Sacramento
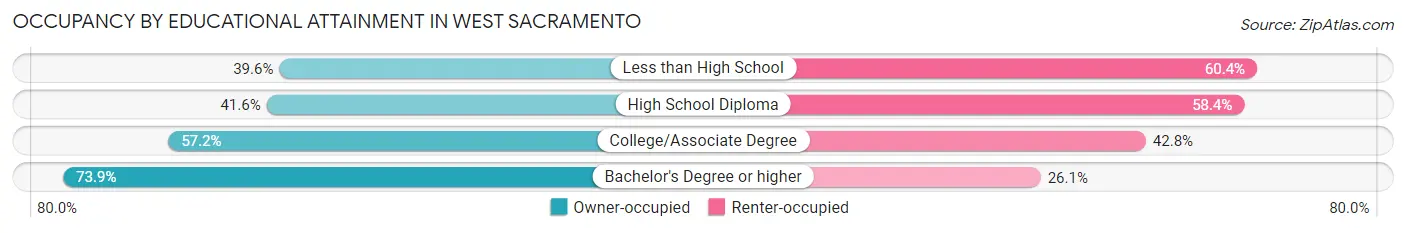
| Household Size | Owner-occupied | Renter-occupied |
| Less than High School | 917 (39.6%) | 1,398 (60.4%) |
| High School Diploma | 1,433 (41.6%) | 2,009 (58.4%) |
| College/Associate Degree | 3,889 (57.2%) | 2,907 (42.8%) |
| Bachelor's Degree or higher | 4,749 (73.9%) | 1,677 (26.1%) |
Occupancy by Age of Householder in West Sacramento
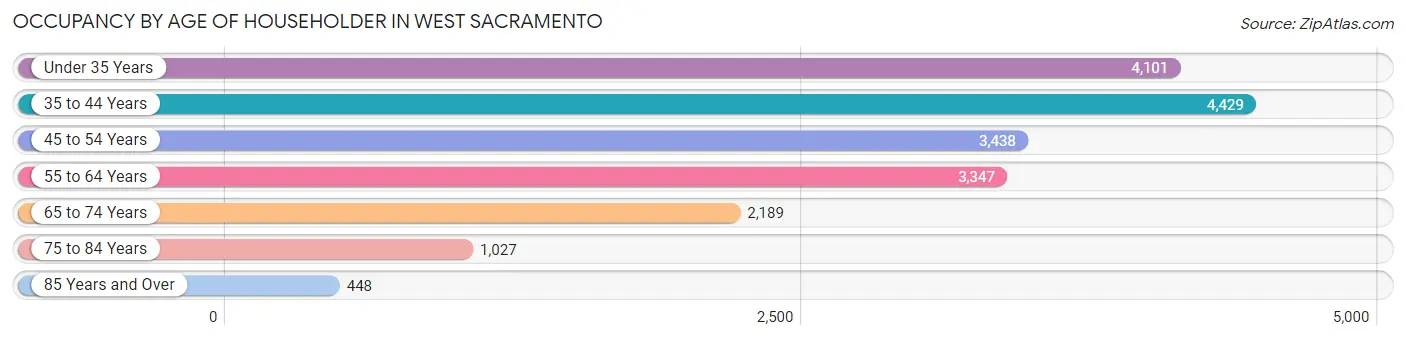
| Age Bracket | # Households | % Households |
| Under 35 Years | 4,101 | 21.6% |
| 35 to 44 Years | 4,429 | 23.3% |
| 45 to 54 Years | 3,438 | 18.1% |
| 55 to 64 Years | 3,347 | 17.6% |
| 65 to 74 Years | 2,189 | 11.5% |
| 75 to 84 Years | 1,027 | 5.4% |
| 85 Years and Over | 448 | 2.4% |
| Total | 18,979 | 100.0% |
Housing Finances in West Sacramento
Median Income by Occupancy in West Sacramento
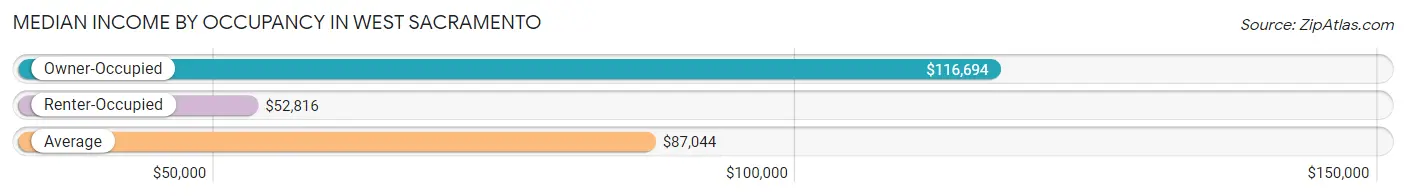
| Occupancy Type | # Households | Median Income |
| Owner-Occupied | 10,988 (57.9%) | $116,694 |
| Renter-Occupied | 7,991 (42.1%) | $52,816 |
| Average | 18,979 (100.0%) | $87,044 |
Occupancy by Householder Income Bracket in West Sacramento
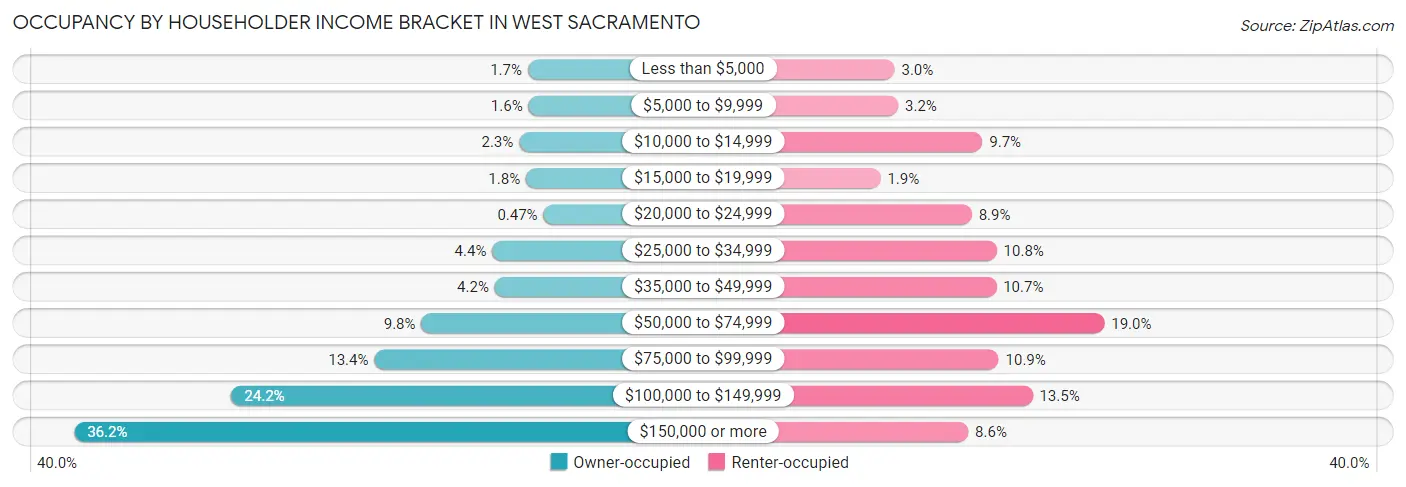
| Income Bracket | Owner-occupied | Renter-occupied |
| Less than $5,000 | 182 (1.7%) | 237 (3.0%) |
| $5,000 to $9,999 | 177 (1.6%) | 259 (3.2%) |
| $10,000 to $14,999 | 255 (2.3%) | 772 (9.7%) |
| $15,000 to $19,999 | 198 (1.8%) | 152 (1.9%) |
| $20,000 to $24,999 | 52 (0.5%) | 707 (8.8%) |
| $25,000 to $34,999 | 480 (4.4%) | 859 (10.7%) |
| $35,000 to $49,999 | 459 (4.2%) | 857 (10.7%) |
| $50,000 to $74,999 | 1,074 (9.8%) | 1,514 (19.0%) |
| $75,000 to $99,999 | 1,468 (13.4%) | 871 (10.9%) |
| $100,000 to $149,999 | 2,663 (24.2%) | 1,077 (13.5%) |
| $150,000 or more | 3,980 (36.2%) | 686 (8.6%) |
| Total | 10,988 (100.0%) | 7,991 (100.0%) |
Monthly Housing Cost Tiers in West Sacramento
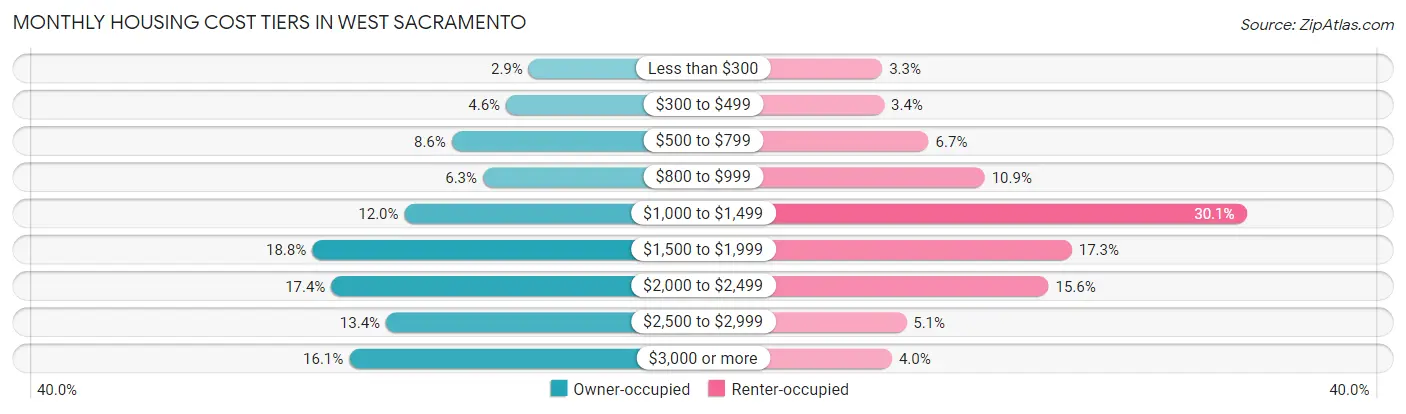
| Monthly Cost | Owner-occupied | Renter-occupied |
| Less than $300 | 317 (2.9%) | 264 (3.3%) |
| $300 to $499 | 500 (4.5%) | 275 (3.4%) |
| $500 to $799 | 939 (8.6%) | 537 (6.7%) |
| $800 to $999 | 687 (6.2%) | 867 (10.8%) |
| $1,000 to $1,499 | 1,322 (12.0%) | 2,406 (30.1%) |
| $1,500 to $1,999 | 2,069 (18.8%) | 1,379 (17.3%) |
| $2,000 to $2,499 | 1,914 (17.4%) | 1,243 (15.5%) |
| $2,500 to $2,999 | 1,471 (13.4%) | 405 (5.1%) |
| $3,000 or more | 1,769 (16.1%) | 321 (4.0%) |
| Total | 10,988 (100.0%) | 7,991 (100.0%) |
Physical Housing Characteristics in West Sacramento
Housing Structures in West Sacramento
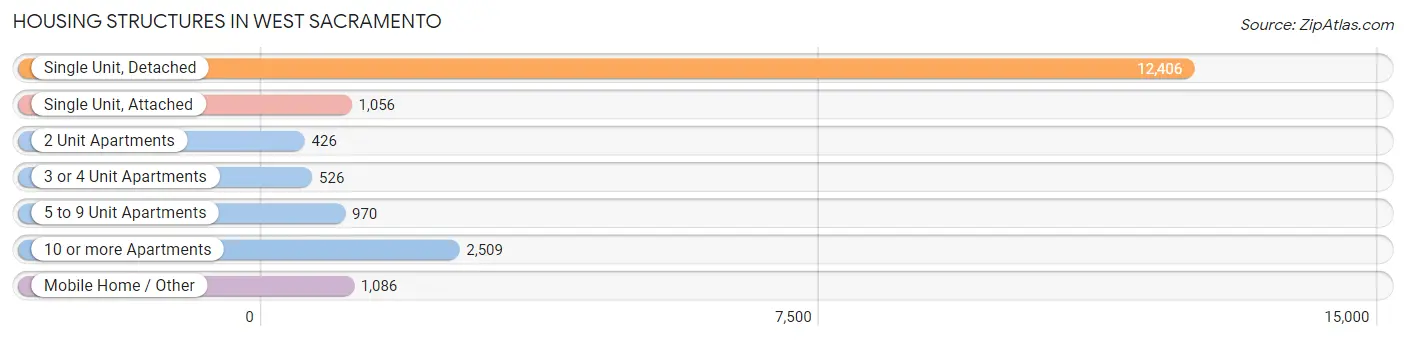
| Structure Type | # Housing Units | % Housing Units |
| Single Unit, Detached | 12,406 | 65.4% |
| Single Unit, Attached | 1,056 | 5.6% |
| 2 Unit Apartments | 426 | 2.2% |
| 3 or 4 Unit Apartments | 526 | 2.8% |
| 5 to 9 Unit Apartments | 970 | 5.1% |
| 10 or more Apartments | 2,509 | 13.2% |
| Mobile Home / Other | 1,086 | 5.7% |
| Total | 18,979 | 100.0% |
Housing Structures by Occupancy in West Sacramento
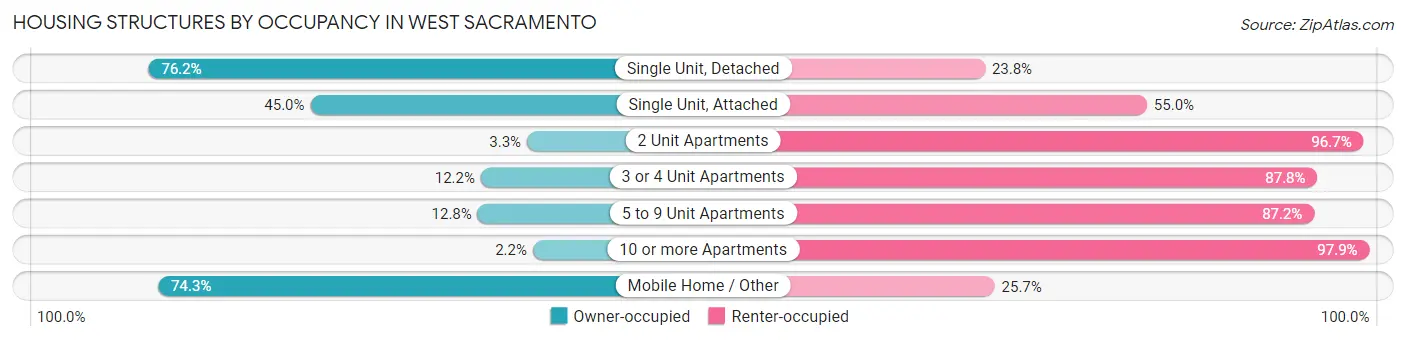
| Structure Type | Owner-occupied | Renter-occupied |
| Single Unit, Detached | 9,450 (76.2%) | 2,956 (23.8%) |
| Single Unit, Attached | 475 (45.0%) | 581 (55.0%) |
| 2 Unit Apartments | 14 (3.3%) | 412 (96.7%) |
| 3 or 4 Unit Apartments | 64 (12.2%) | 462 (87.8%) |
| 5 to 9 Unit Apartments | 124 (12.8%) | 846 (87.2%) |
| 10 or more Apartments | 54 (2.1%) | 2,455 (97.9%) |
| Mobile Home / Other | 807 (74.3%) | 279 (25.7%) |
| Total | 10,988 (57.9%) | 7,991 (42.1%) |
Housing Structures by Number of Rooms in West Sacramento
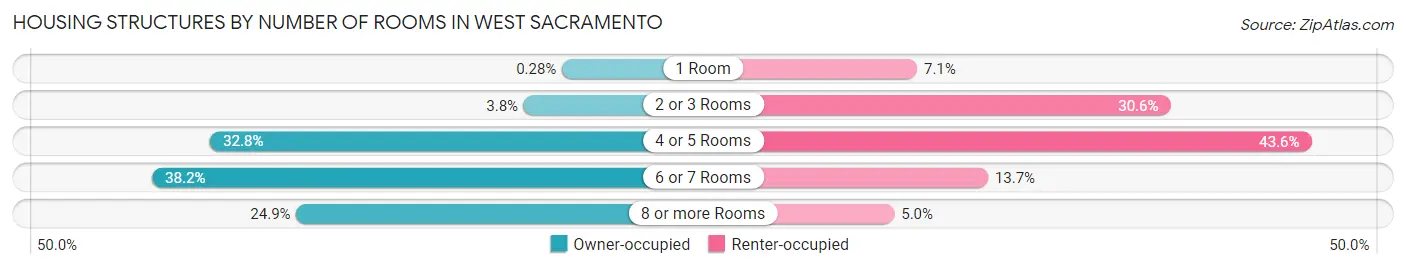
| Number of Rooms | Owner-occupied | Renter-occupied |
| 1 Room | 31 (0.3%) | 570 (7.1%) |
| 2 or 3 Rooms | 420 (3.8%) | 2,441 (30.5%) |
| 4 or 5 Rooms | 3,608 (32.8%) | 3,484 (43.6%) |
| 6 or 7 Rooms | 4,197 (38.2%) | 1,094 (13.7%) |
| 8 or more Rooms | 2,732 (24.9%) | 402 (5.0%) |
| Total | 10,988 (100.0%) | 7,991 (100.0%) |
Housing Structure by Heating Type in West Sacramento
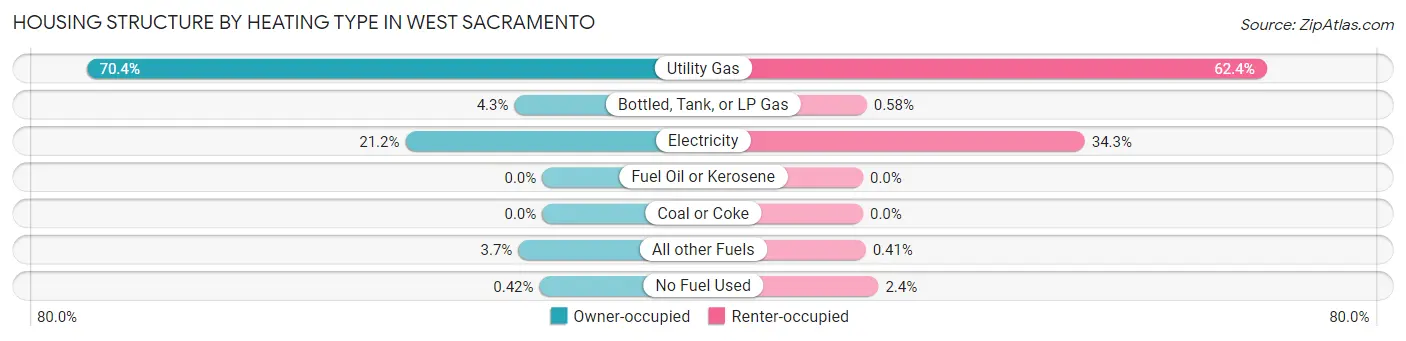
| Heating Type | Owner-occupied | Renter-occupied |
| Utility Gas | 7,738 (70.4%) | 4,983 (62.4%) |
| Bottled, Tank, or LP Gas | 473 (4.3%) | 46 (0.6%) |
| Electricity | 2,324 (21.1%) | 2,739 (34.3%) |
| Fuel Oil or Kerosene | 0 (0.0%) | 0 (0.0%) |
| Coal or Coke | 0 (0.0%) | 0 (0.0%) |
| All other Fuels | 407 (3.7%) | 33 (0.4%) |
| No Fuel Used | 46 (0.4%) | 190 (2.4%) |
| Total | 10,988 (100.0%) | 7,991 (100.0%) |
Household Vehicle Usage in West Sacramento
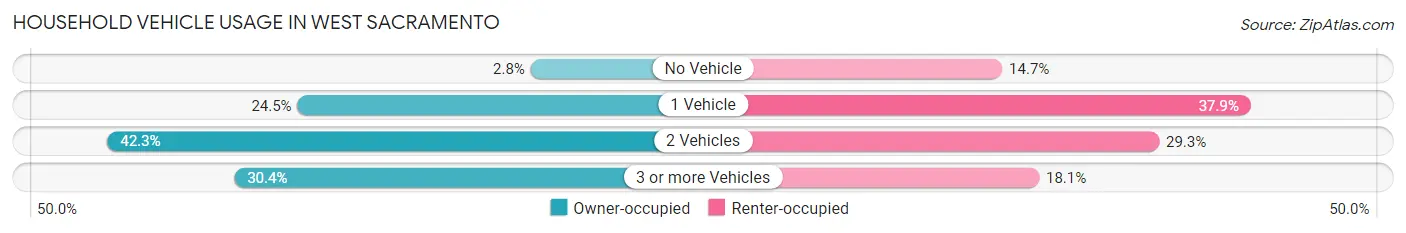
| Vehicles per Household | Owner-occupied | Renter-occupied |
| No Vehicle | 303 (2.8%) | 1,173 (14.7%) |
| 1 Vehicle | 2,695 (24.5%) | 3,027 (37.9%) |
| 2 Vehicles | 4,646 (42.3%) | 2,343 (29.3%) |
| 3 or more Vehicles | 3,344 (30.4%) | 1,448 (18.1%) |
| Total | 10,988 (100.0%) | 7,991 (100.0%) |
Real Estate & Mortgages in West Sacramento
Real Estate and Mortgage Overview in West Sacramento
| Characteristic | Without Mortgage | With Mortgage |
| Housing Units | 2,812 | 8,176 |
| Median Property Value | $359,200 | $480,300 |
| Median Household Income | $86,059 | $3,337 |
| Monthly Housing Costs | $676 | $1,769 |
| Real Estate Taxes | $2,405 | $159 |
Property Value by Mortgage Status in West Sacramento
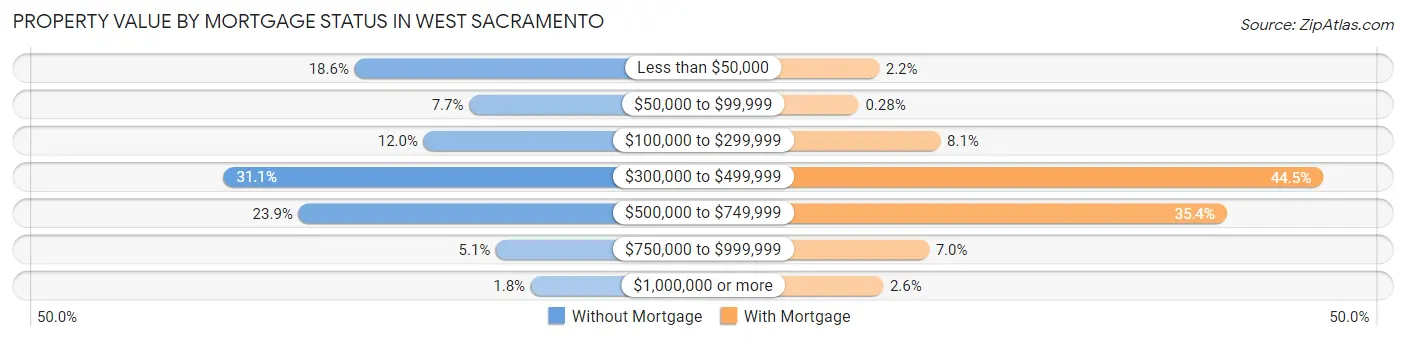
| Property Value | Without Mortgage | With Mortgage |
| Less than $50,000 | 522 (18.6%) | 181 (2.2%) |
| $50,000 to $99,999 | 215 (7.6%) | 23 (0.3%) |
| $100,000 to $299,999 | 337 (12.0%) | 658 (8.1%) |
| $300,000 to $499,999 | 873 (31.0%) | 3,640 (44.5%) |
| $500,000 to $749,999 | 672 (23.9%) | 2,891 (35.4%) |
| $750,000 to $999,999 | 143 (5.1%) | 570 (7.0%) |
| $1,000,000 or more | 50 (1.8%) | 213 (2.6%) |
| Total | 2,812 (100.0%) | 8,176 (100.0%) |
Household Income by Mortgage Status in West Sacramento
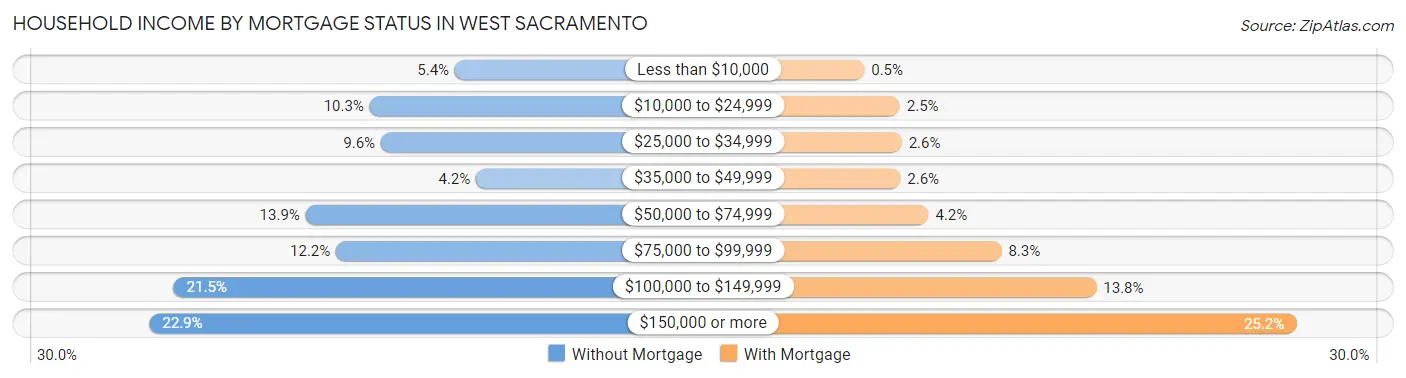
| Household Income | Without Mortgage | With Mortgage |
| Less than $10,000 | 152 (5.4%) | 41 (0.5%) |
| $10,000 to $24,999 | 289 (10.3%) | 207 (2.5%) |
| $25,000 to $34,999 | 271 (9.6%) | 216 (2.6%) |
| $35,000 to $49,999 | 118 (4.2%) | 209 (2.6%) |
| $50,000 to $74,999 | 392 (13.9%) | 341 (4.2%) |
| $75,000 to $99,999 | 343 (12.2%) | 682 (8.3%) |
| $100,000 to $149,999 | 604 (21.5%) | 1,125 (13.8%) |
| $150,000 or more | 643 (22.9%) | 2,059 (25.2%) |
| Total | 2,812 (100.0%) | 8,176 (100.0%) |
Property Value to Household Income Ratio in West Sacramento
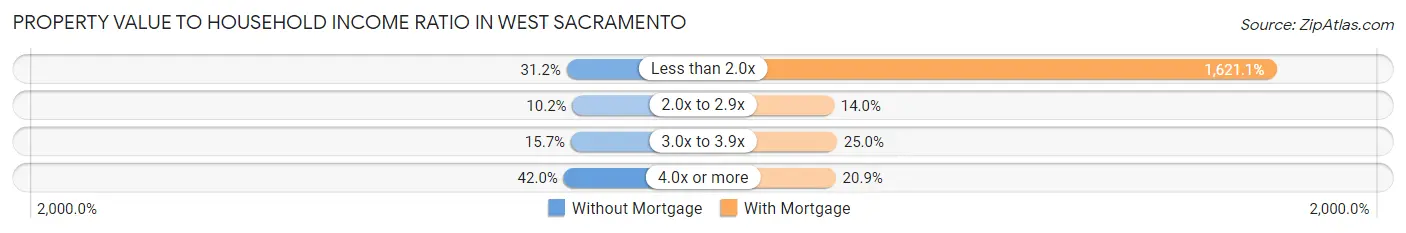
| Value-to-Income Ratio | Without Mortgage | With Mortgage |
| Less than 2.0x | 876 (31.1%) | 132,537 (1,621.0%) |
| 2.0x to 2.9x | 287 (10.2%) | 1,145 (14.0%) |
| 3.0x to 3.9x | 441 (15.7%) | 2,043 (25.0%) |
| 4.0x or more | 1,181 (42.0%) | 1,706 (20.9%) |
| Total | 2,812 (100.0%) | 8,176 (100.0%) |
Real Estate Taxes by Mortgage Status in West Sacramento
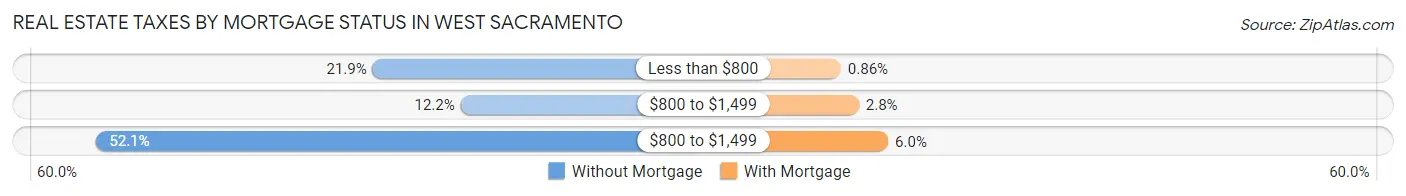
| Property Taxes | Without Mortgage | With Mortgage |
| Less than $800 | 615 (21.9%) | 70 (0.9%) |
| $800 to $1,499 | 344 (12.2%) | 231 (2.8%) |
| $800 to $1,499 | 1,466 (52.1%) | 494 (6.0%) |
| Total | 2,812 (100.0%) | 8,176 (100.0%) |
Health & Disability in West Sacramento
Health Insurance Coverage by Age in West Sacramento
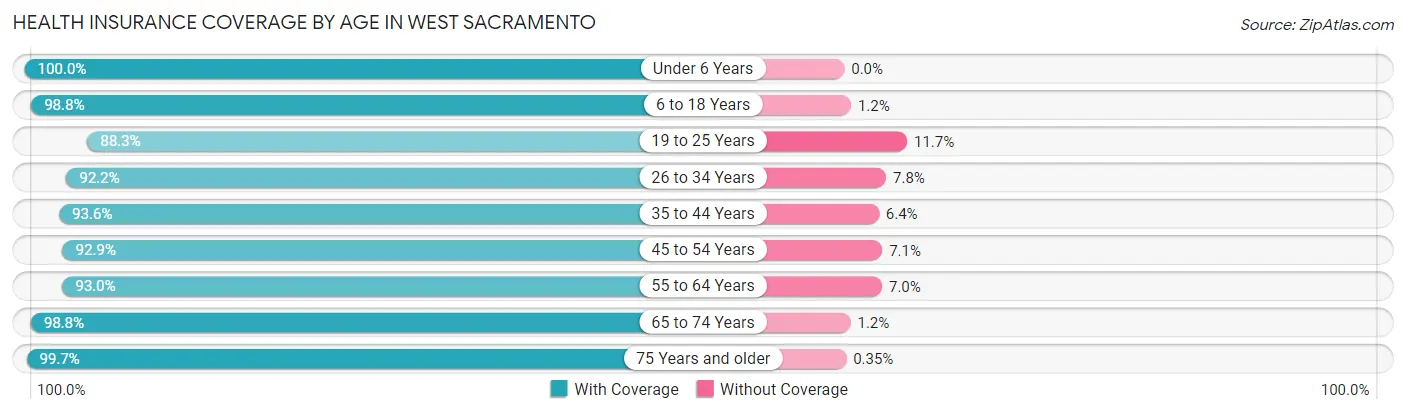
| Age Bracket | With Coverage | Without Coverage |
| Under 6 Years | 4,083 (100.0%) | 0 (0.0%) |
| 6 to 18 Years | 10,477 (98.8%) | 132 (1.2%) |
| 19 to 25 Years | 4,858 (88.3%) | 644 (11.7%) |
| 26 to 34 Years | 6,852 (92.2%) | 579 (7.8%) |
| 35 to 44 Years | 7,775 (93.6%) | 535 (6.4%) |
| 45 to 54 Years | 5,497 (92.9%) | 419 (7.1%) |
| 55 to 64 Years | 5,786 (93.0%) | 438 (7.0%) |
| 65 to 74 Years | 3,579 (98.8%) | 42 (1.2%) |
| 75 Years and older | 2,288 (99.7%) | 8 (0.4%) |
| Total | 51,195 (94.8%) | 2,797 (5.2%) |
Health Insurance Coverage by Citizenship Status in West Sacramento
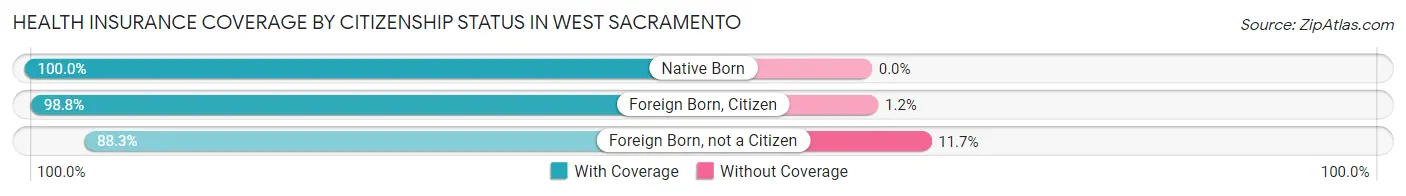
| Citizenship Status | With Coverage | Without Coverage |
| Native Born | 4,083 (100.0%) | 0 (0.0%) |
| Foreign Born, Citizen | 10,477 (98.8%) | 132 (1.2%) |
| Foreign Born, not a Citizen | 4,858 (88.3%) | 644 (11.7%) |
Health Insurance Coverage by Household Income in West Sacramento
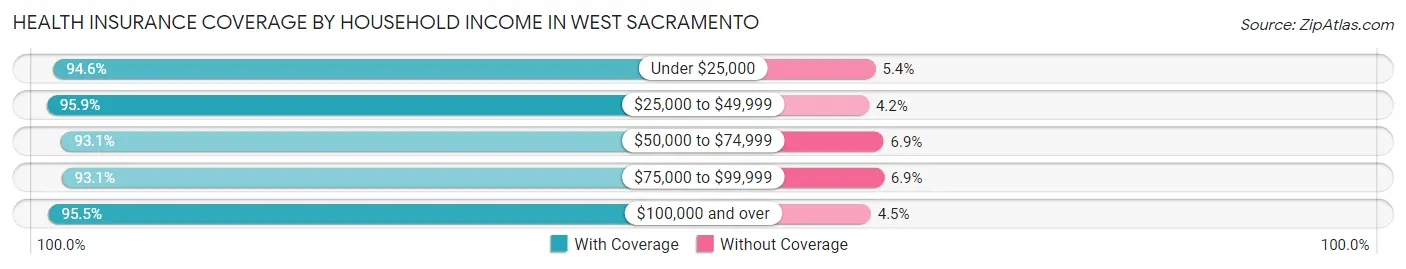
| Household Income | With Coverage | Without Coverage |
| Under $25,000 | 5,369 (94.6%) | 306 (5.4%) |
| $25,000 to $49,999 | 6,418 (95.9%) | 278 (4.2%) |
| $50,000 to $74,999 | 7,478 (93.1%) | 553 (6.9%) |
| $75,000 to $99,999 | 5,805 (93.1%) | 432 (6.9%) |
| $100,000 and over | 25,756 (95.5%) | 1,210 (4.5%) |
Public vs Private Health Insurance Coverage by Age in West Sacramento
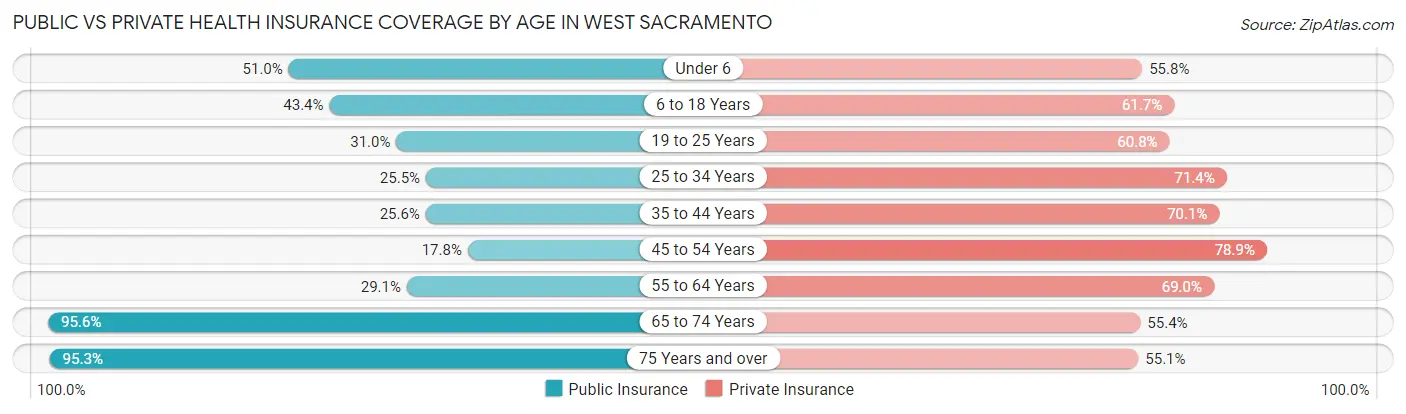
| Age Bracket | Public Insurance | Private Insurance |
| Under 6 | 2,082 (51.0%) | 2,277 (55.8%) |
| 6 to 18 Years | 4,607 (43.4%) | 6,540 (61.7%) |
| 19 to 25 Years | 1,706 (31.0%) | 3,346 (60.8%) |
| 25 to 34 Years | 1,896 (25.5%) | 5,307 (71.4%) |
| 35 to 44 Years | 2,123 (25.6%) | 5,821 (70.1%) |
| 45 to 54 Years | 1,050 (17.7%) | 4,666 (78.9%) |
| 55 to 64 Years | 1,809 (29.1%) | 4,297 (69.0%) |
| 65 to 74 Years | 3,463 (95.6%) | 2,007 (55.4%) |
| 75 Years and over | 2,189 (95.3%) | 1,264 (55.0%) |
| Total | 20,925 (38.8%) | 35,525 (65.8%) |
Disability Status by Sex by Age in West Sacramento
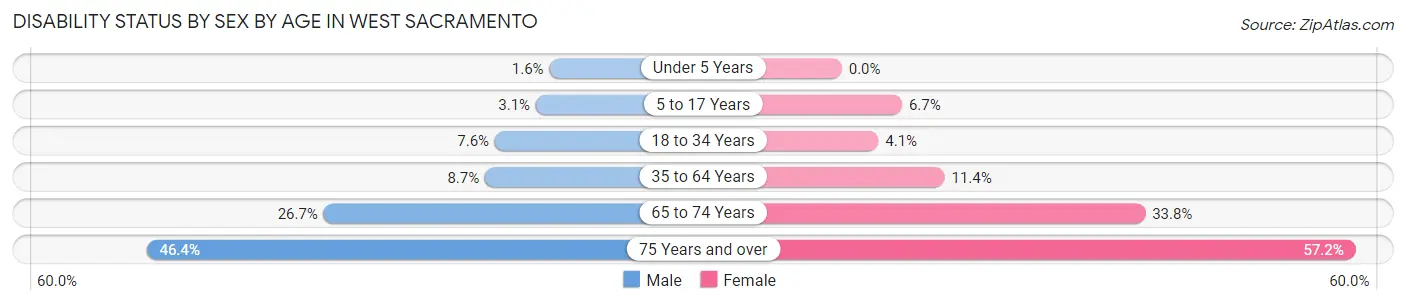
| Age Bracket | Male | Female |
| Under 5 Years | 29 (1.5%) | 0 (0.0%) |
| 5 to 17 Years | 168 (3.0%) | 344 (6.7%) |
| 18 to 34 Years | 501 (7.6%) | 287 (4.1%) |
| 35 to 64 Years | 855 (8.7%) | 1,218 (11.4%) |
| 65 to 74 Years | 415 (26.7%) | 698 (33.8%) |
| 75 Years and over | 441 (46.4%) | 770 (57.2%) |
Disability Class by Sex by Age in West Sacramento
Disability Class: Hearing Difficulty
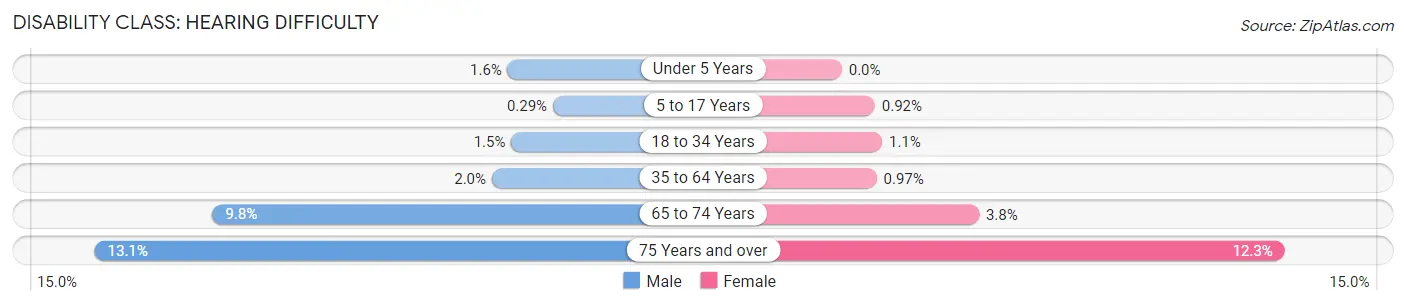
| Age Bracket | Male | Female |
| Under 5 Years | 29 (1.5%) | 0 (0.0%) |
| 5 to 17 Years | 16 (0.3%) | 47 (0.9%) |
| 18 to 34 Years | 95 (1.5%) | 79 (1.1%) |
| 35 to 64 Years | 195 (2.0%) | 103 (1.0%) |
| 65 to 74 Years | 152 (9.8%) | 79 (3.8%) |
| 75 Years and over | 124 (13.1%) | 166 (12.3%) |
Disability Class: Vision Difficulty
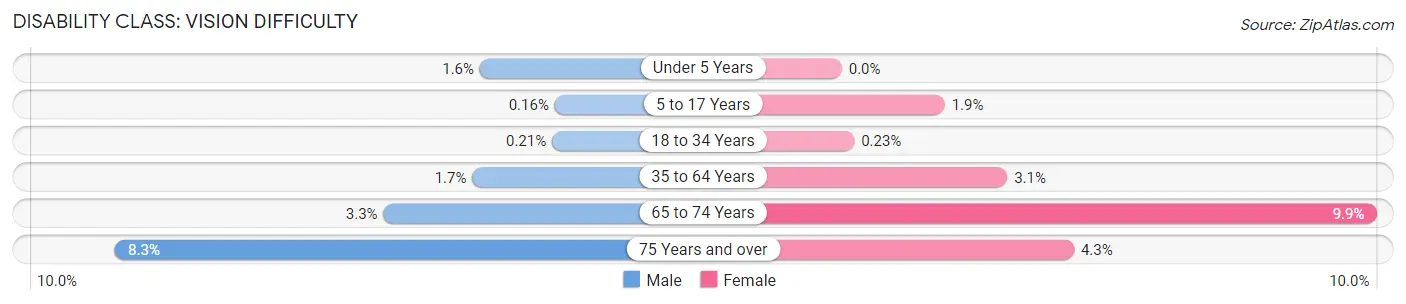
| Age Bracket | Male | Female |
| Under 5 Years | 29 (1.5%) | 0 (0.0%) |
| 5 to 17 Years | 9 (0.2%) | 98 (1.9%) |
| 18 to 34 Years | 14 (0.2%) | 16 (0.2%) |
| 35 to 64 Years | 166 (1.7%) | 327 (3.1%) |
| 65 to 74 Years | 52 (3.3%) | 205 (9.9%) |
| 75 Years and over | 79 (8.3%) | 58 (4.3%) |
Disability Class: Cognitive Difficulty
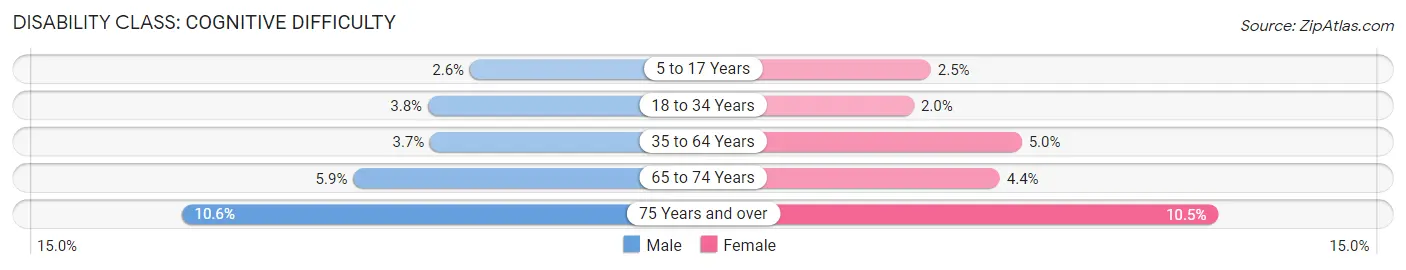
| Age Bracket | Male | Female |
| 5 to 17 Years | 143 (2.6%) | 127 (2.5%) |
| 18 to 34 Years | 248 (3.8%) | 142 (2.0%) |
| 35 to 64 Years | 364 (3.7%) | 533 (5.0%) |
| 65 to 74 Years | 91 (5.9%) | 91 (4.4%) |
| 75 Years and over | 101 (10.6%) | 141 (10.5%) |
Disability Class: Ambulatory Difficulty
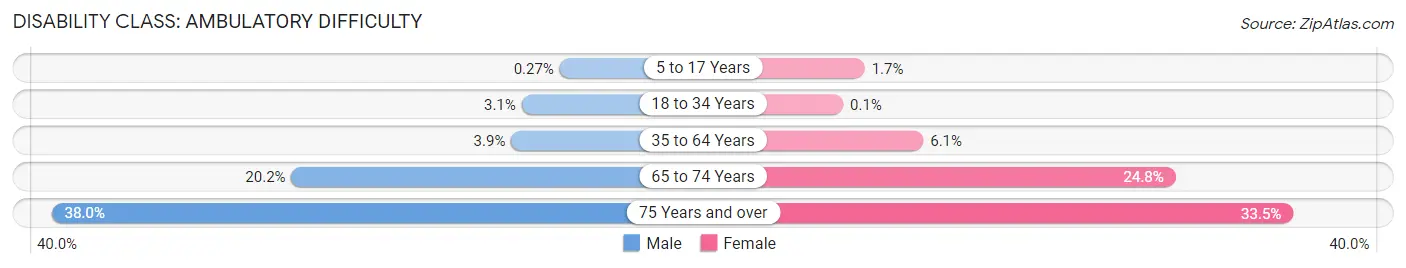
| Age Bracket | Male | Female |
| 5 to 17 Years | 15 (0.3%) | 87 (1.7%) |
| 18 to 34 Years | 204 (3.1%) | 7 (0.1%) |
| 35 to 64 Years | 379 (3.9%) | 644 (6.0%) |
| 65 to 74 Years | 314 (20.2%) | 512 (24.8%) |
| 75 Years and over | 361 (38.0%) | 451 (33.5%) |
Disability Class: Self-Care Difficulty
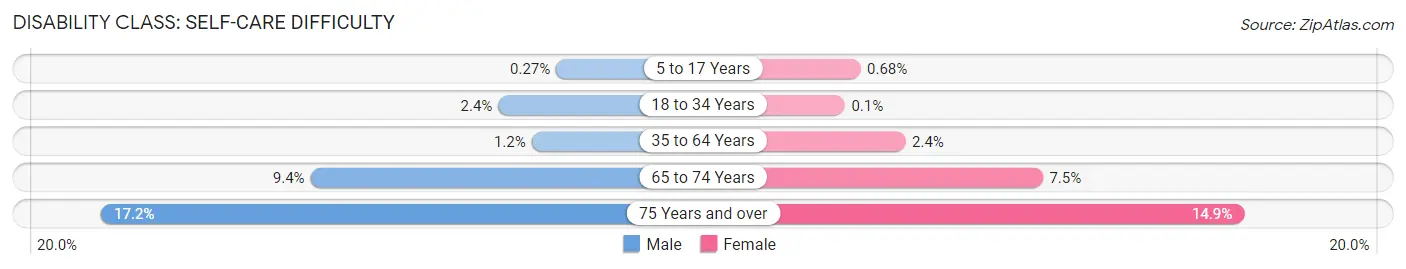
| Age Bracket | Male | Female |
| 5 to 17 Years | 15 (0.3%) | 35 (0.7%) |
| 18 to 34 Years | 159 (2.4%) | 7 (0.1%) |
| 35 to 64 Years | 116 (1.2%) | 250 (2.4%) |
| 65 to 74 Years | 146 (9.4%) | 154 (7.4%) |
| 75 Years and over | 163 (17.2%) | 201 (14.9%) |
Technology Access in West Sacramento
Computing Device Access in West Sacramento
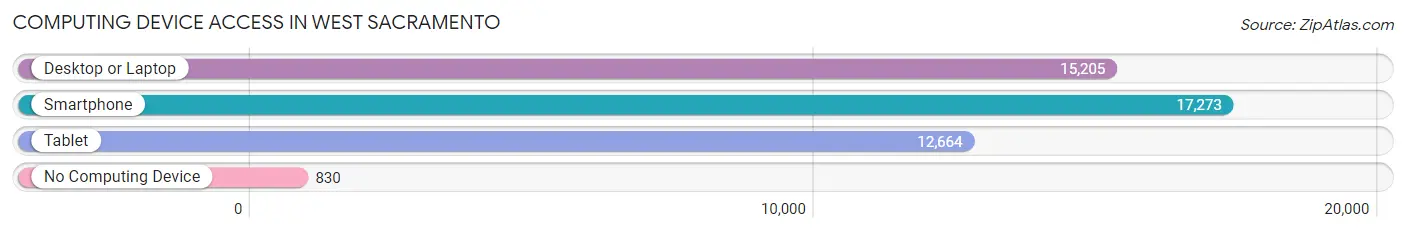
| Device Type | # Households | % Households |
| Desktop or Laptop | 15,205 | 80.1% |
| Smartphone | 17,273 | 91.0% |
| Tablet | 12,664 | 66.7% |
| No Computing Device | 830 | 4.4% |
| Total | 18,979 | 100.0% |
Internet Access in West Sacramento
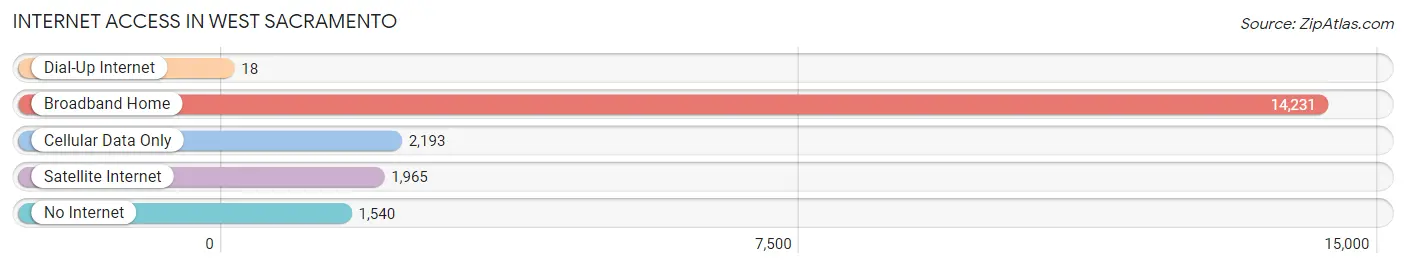
| Internet Type | # Households | % Households |
| Dial-Up Internet | 18 | 0.1% |
| Broadband Home | 14,231 | 75.0% |
| Cellular Data Only | 2,193 | 11.6% |
| Satellite Internet | 1,965 | 10.3% |
| No Internet | 1,540 | 8.1% |
| Total | 18,979 | 100.0% |
West Sacramento Summary
History
West Sacramento is a city located in Yolo County, California, United States. It is part of the Sacramento–Arden-Arcade–Roseville Metropolitan Statistical Area. The city is located just west of the state capital of Sacramento, and is separated from it by the Sacramento River. It is a fast-growing community, with a population of approximately 55,000 as of the 2010 census.
West Sacramento was founded in the late 19th century as a result of the construction of the Sacramento River Deep Water Ship Channel. The city was incorporated in 1987, and has since grown to become a major hub for business and industry in the region.
Geography
West Sacramento is located in the Central Valley of California, approximately 20 miles (32 km) northwest of the state capital of Sacramento. It is bordered by the Sacramento River to the east, the cities of Davis and Woodland to the north, and the cities of Dixon and Vacaville to the south. The city covers an area of approximately 10 square miles (26 km2).
The city is situated at an elevation of approximately 20 feet (6 m) above sea level. The climate is characterized by hot, dry summers and mild, wet winters. The average annual temperature is approximately 68 °F (20 °C).
Economy
West Sacramento is a major hub for business and industry in the region. The city is home to a number of large companies, including Raley's, a regional grocery store chain; Sutter Health, a healthcare provider; and the California State Teachers' Retirement System.
The city is also home to a number of smaller businesses, including a number of restaurants, retail stores, and professional services. The city is also home to a number of industrial parks, which provide employment opportunities for many of the city's residents.
Demographics
As of the 2010 census, West Sacramento had a population of 55,274. The racial makeup of the city was 44.3% White, 16.2% African American, 0.7% Native American, 15.2% Asian, 0.3% Pacific Islander, and 22.3% from other races. Hispanic or Latino of any race were 33.2% of the population.
The median income for a household in the city was $50,945, and the median income for a family was $60,945. The per capita income for the city was $25,945. About 14.2% of families and 17.7% of the population were below the poverty line, including 25.2% of those under age 18 and 8.2% of those age 65 or over.
Common Questions
What is Per Capita Income in West Sacramento?
Per Capita income in West Sacramento is $40,553.
What is the Median Family Income in West Sacramento?
Median Family Income in West Sacramento is $102,674.
What is the Median Household income in West Sacramento?
Median Household Income in West Sacramento is $87,044.
What is Income or Wage Gap in West Sacramento?
Income or Wage Gap in West Sacramento is 14.4%.
Women in West Sacramento earn 85.6 cents for every dollar earned by a man.
What is Family Income Deficit in West Sacramento?
Family Income Deficit in West Sacramento is $12,232.
Families that are below poverty line in West Sacramento earn $12,232 less on average than the poverty threshold level.
What is Inequality or Gini Index in West Sacramento?
Inequality or Gini Index in West Sacramento is 0.47.
What is the Total Population of West Sacramento?
Total Population of West Sacramento is 54,163.
What is the Total Male Population of West Sacramento?
Total Male Population of West Sacramento is 26,370.
What is the Total Female Population of West Sacramento?
Total Female Population of West Sacramento is 27,793.
What is the Ratio of Males per 100 Females in West Sacramento?
There are 94.88 Males per 100 Females in West Sacramento.
What is the Ratio of Females per 100 Males in West Sacramento?
There are 105.40 Females per 100 Males in West Sacramento.
What is the Median Population Age in West Sacramento?
Median Population Age in West Sacramento is 34.5 Years.
What is the Average Family Size in West Sacramento
Average Family Size in West Sacramento is 3.4 People.
What is the Average Household Size in West Sacramento
Average Household Size in West Sacramento is 2.8 People.
How Large is the Labor Force in West Sacramento?
There are 27,487 People in the Labor Forcein in West Sacramento.
What is the Percentage of People in the Labor Force in West Sacramento?
65.8% of People are in the Labor Force in West Sacramento.
What is the Unemployment Rate in West Sacramento?
Unemployment Rate in West Sacramento is 5.4%.