Cities with the Highest Percentage of Mexican American Indian Population in Ohio
RELATED REPORTS & OPTIONS
Mexican American Indian
Ohio
Compare Cities
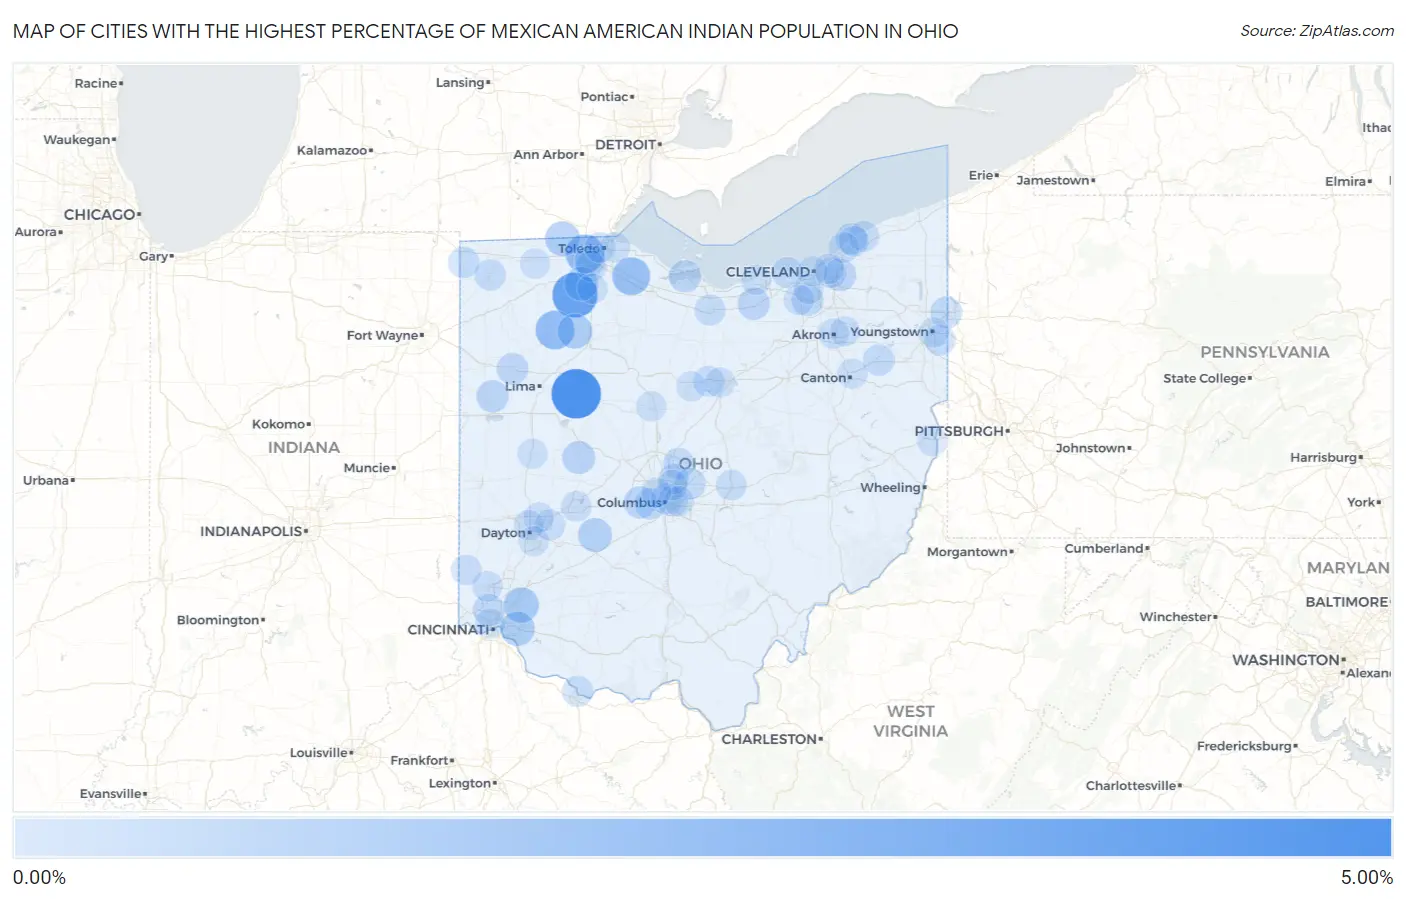
Map of Cities with the Highest Percentage of Mexican American Indian Population in Ohio
0.00%
5.00%
Cities with the Highest Percentage of Mexican American Indian Population in Ohio
| City | Mexican American Indian | vs State | vs National | |
| 1. | Mcguffey | 4.21% | 0.025%(+4.19)#1 | 0.16%(+4.05)#87 |
| 2. | Weston | 3.24% | 0.025%(+3.22)#2 | 0.16%(+3.09)#125 |
| 3. | Leipsic | 1.81% | 0.025%(+1.78)#3 | 0.16%(+1.65)#277 |
| 4. | Holland | 1.79% | 0.025%(+1.77)#4 | 0.16%(+1.64)#279 |
| 5. | Elmore | 1.62% | 0.025%(+1.60)#5 | 0.16%(+1.47)#319 |
| 6. | Loveland | 1.04% | 0.025%(+1.02)#6 | 0.16%(+0.886)#543 |
| 7. | Metamora | 0.96% | 0.025%(+0.935)#7 | 0.16%(+0.804)#592 |
| 8. | Mccomb | 0.96% | 0.025%(+0.932)#8 | 0.16%(+0.801)#595 |
| 9. | Mount Carmel | 0.89% | 0.025%(+0.868)#9 | 0.16%(+0.737)#643 |
| 10. | South Solon | 0.78% | 0.025%(+0.754)#10 | 0.16%(+0.623)#727 |
| 11. | Tontogany | 0.75% | 0.025%(+0.729)#11 | 0.16%(+0.598)#754 |
| 12. | West Liberty | 0.57% | 0.025%(+0.546)#12 | 0.16%(+0.415)#970 |
| 13. | Lake Darby | 0.46% | 0.025%(+0.434)#13 | 0.16%(+0.303)#1,163 |
| 14. | Pepper Pike | 0.46% | 0.025%(+0.432)#14 | 0.16%(+0.301)#1,171 |
| 15. | Mendon | 0.46% | 0.025%(+0.432)#15 | 0.16%(+0.301)#1,172 |
| 16. | Oberlin | 0.44% | 0.025%(+0.414)#16 | 0.16%(+0.283)#1,221 |
| 17. | Bay View | 0.42% | 0.025%(+0.397)#17 | 0.16%(+0.266)#1,243 |
| 18. | West Hill | 0.36% | 0.025%(+0.333)#18 | 0.16%(+0.202)#1,375 |
| 19. | North Royalton | 0.36% | 0.025%(+0.331)#19 | 0.16%(+0.200)#1,379 |
| 20. | Delphos | 0.35% | 0.025%(+0.324)#20 | 0.16%(+0.193)#1,394 |
| 21. | Mount Healthy | 0.33% | 0.025%(+0.306)#21 | 0.16%(+0.175)#1,449 |
| 22. | Mentor On The Lake | 0.28% | 0.025%(+0.254)#22 | 0.16%(+0.123)#1,571 |
| 23. | Lincoln Village | 0.26% | 0.025%(+0.236)#23 | 0.16%(+0.105)#1,639 |
| 24. | Alliance | 0.25% | 0.025%(+0.225)#24 | 0.16%(+0.094)#1,676 |
| 25. | Galena | 0.25% | 0.025%(+0.224)#25 | 0.16%(+0.093)#1,678 |
| 26. | Bay Village | 0.23% | 0.025%(+0.205)#26 | 0.16%(+0.074)#1,752 |
| 27. | New Albany | 0.23% | 0.025%(+0.203)#27 | 0.16%(+0.072)#1,763 |
| 28. | Edon | 0.22% | 0.025%(+0.197)#28 | 0.16%(+0.066)#1,787 |
| 29. | Bryan | 0.20% | 0.025%(+0.171)#29 | 0.16%(+0.040)#1,893 |
| 30. | Norwalk | 0.18% | 0.025%(+0.157)#30 | 0.16%(+0.026)#1,971 |
| 31. | Struthers | 0.18% | 0.025%(+0.154)#31 | 0.16%(+0.023)#1,989 |
| 32. | Perrysburg | 0.16% | 0.025%(+0.132)#32 | 0.16%(+0.001)#2,101 |
| 33. | Aberdeen | 0.15% | 0.025%(+0.129)#33 | 0.16%(-0.002)#2,127 |
| 34. | Ontario | 0.15% | 0.025%(+0.125)#34 | 0.16%(-0.006)#2,144 |
| 35. | University Heights | 0.12% | 0.025%(+0.099)#35 | 0.16%(-0.032)#2,275 |
| 36. | Maumee | 0.12% | 0.025%(+0.091)#36 | 0.16%(-0.040)#2,319 |
| 37. | Newark | 0.11% | 0.025%(+0.089)#37 | 0.16%(-0.042)#2,328 |
| 38. | Painesville | 0.11% | 0.025%(+0.088)#38 | 0.16%(-0.043)#2,333 |
| 39. | Springfield | 0.10% | 0.025%(+0.075)#39 | 0.16%(-0.056)#2,420 |
| 40. | Akron | 0.093% | 0.025%(+0.068)#40 | 0.16%(-0.063)#2,472 |
| 41. | Hamilton | 0.092% | 0.025%(+0.067)#41 | 0.16%(-0.064)#2,475 |
| 42. | Columbus | 0.091% | 0.025%(+0.066)#42 | 0.16%(-0.065)#2,485 |
| 43. | Oxford | 0.082% | 0.025%(+0.056)#43 | 0.16%(-0.075)#2,567 |
| 44. | Bexley | 0.081% | 0.025%(+0.056)#44 | 0.16%(-0.075)#2,570 |
| 45. | Eastlake | 0.074% | 0.025%(+0.049)#45 | 0.16%(-0.082)#2,627 |
| 46. | Westerville | 0.067% | 0.025%(+0.042)#46 | 0.16%(-0.089)#2,681 |
| 47. | Toledo | 0.064% | 0.025%(+0.039)#47 | 0.16%(-0.093)#2,701 |
| 48. | Fairborn | 0.058% | 0.025%(+0.033)#48 | 0.16%(-0.098)#2,741 |
| 49. | Mentor | 0.053% | 0.025%(+0.028)#49 | 0.16%(-0.103)#2,783 |
| 50. | Minerva Park | 0.053% | 0.025%(+0.028)#50 | 0.16%(-0.103)#2,784 |
| 51. | Whitehall | 0.040% | 0.025%(+0.015)#51 | 0.16%(-0.116)#2,877 |
| 52. | Huber Heights | 0.039% | 0.025%(+0.014)#52 | 0.16%(-0.117)#2,883 |
| 53. | Strongsville | 0.039% | 0.025%(+0.014)#53 | 0.16%(-0.117)#2,886 |
| 54. | Marion | 0.036% | 0.025%(+0.011)#54 | 0.16%(-0.120)#2,912 |
| 55. | Parma | 0.032% | 0.025%(+0.007)#55 | 0.16%(-0.124)#2,947 |
| 56. | Oregon | 0.030% | 0.025%(+0.005)#56 | 0.16%(-0.126)#2,971 |
| 57. | Sidney | 0.029% | 0.025%(+0.004)#57 | 0.16%(-0.127)#2,981 |
| 58. | Canton | 0.027% | 0.025%(+0.002)#58 | 0.16%(-0.129)#3,005 |
| 59. | Lorain | 0.026% | 0.025%(+0.001)#59 | 0.16%(-0.130)#3,015 |
| 60. | Cleveland | 0.026% | 0.025%(+0.000)#60 | 0.16%(-0.131)#3,017 |
| 61. | Tallmadge | 0.022% | 0.025%(-0.003)#61 | 0.16%(-0.134)#3,062 |
| 62. | Bowling Green | 0.017% | 0.025%(-0.009)#62 | 0.16%(-0.140)#3,116 |
| 63. | Steubenville | 0.017% | 0.025%(-0.009)#63 | 0.16%(-0.140)#3,117 |
| 64. | Mansfield | 0.015% | 0.025%(-0.011)#64 | 0.16%(-0.142)#3,141 |
| 65. | Dayton | 0.015% | 0.025%(-0.011)#65 | 0.16%(-0.142)#3,144 |
| 66. | Upper Arlington | 0.014% | 0.025%(-0.011)#66 | 0.16%(-0.143)#3,151 |
| 67. | Wauseon | 0.014% | 0.025%(-0.012)#67 | 0.16%(-0.143)#3,152 |
| 68. | Kettering | 0.010% | 0.025%(-0.015)#68 | 0.16%(-0.146)#3,171 |
| 69. | Galion | 0.0096% | 0.025%(-0.016)#69 | 0.16%(-0.147)#3,178 |
| 70. | Cleveland Heights | 0.0089% | 0.025%(-0.016)#70 | 0.16%(-0.147)#3,181 |
| 71. | Cincinnati | 0.0032% | 0.025%(-0.022)#71 | 0.16%(-0.153)#3,215 |
| 72. | Youngstown | 0.0017% | 0.025%(-0.024)#72 | 0.16%(-0.155)#3,221 |
Common Questions
What are the Top 10 Cities with the Highest Percentage of Mexican American Indian Population in Ohio?
Top 10 Cities with the Highest Percentage of Mexican American Indian Population in Ohio are:
#1
4.21%
#2
3.24%
#3
1.81%
#4
1.79%
#5
1.62%
#6
1.04%
#7
0.96%
#8
0.96%
#9
0.89%
#10
0.78%
What city has the Highest Percentage of Mexican American Indian Population in Ohio?
McGuffey has the Highest Percentage of Mexican American Indian Population in Ohio with 4.21%.
What is the Percentage of Mexican American Indian Population in the State of Ohio?
Percentage of Mexican American Indian Population in Ohio is 0.025%.
What is the Percentage of Mexican American Indian Population in the United States?
Percentage of Mexican American Indian Population in the United States is 0.16%.