Cities with the Highest Percentage of Mexican American Indian Population in Indiana
RELATED REPORTS & OPTIONS
Mexican American Indian
Indiana
Compare Cities
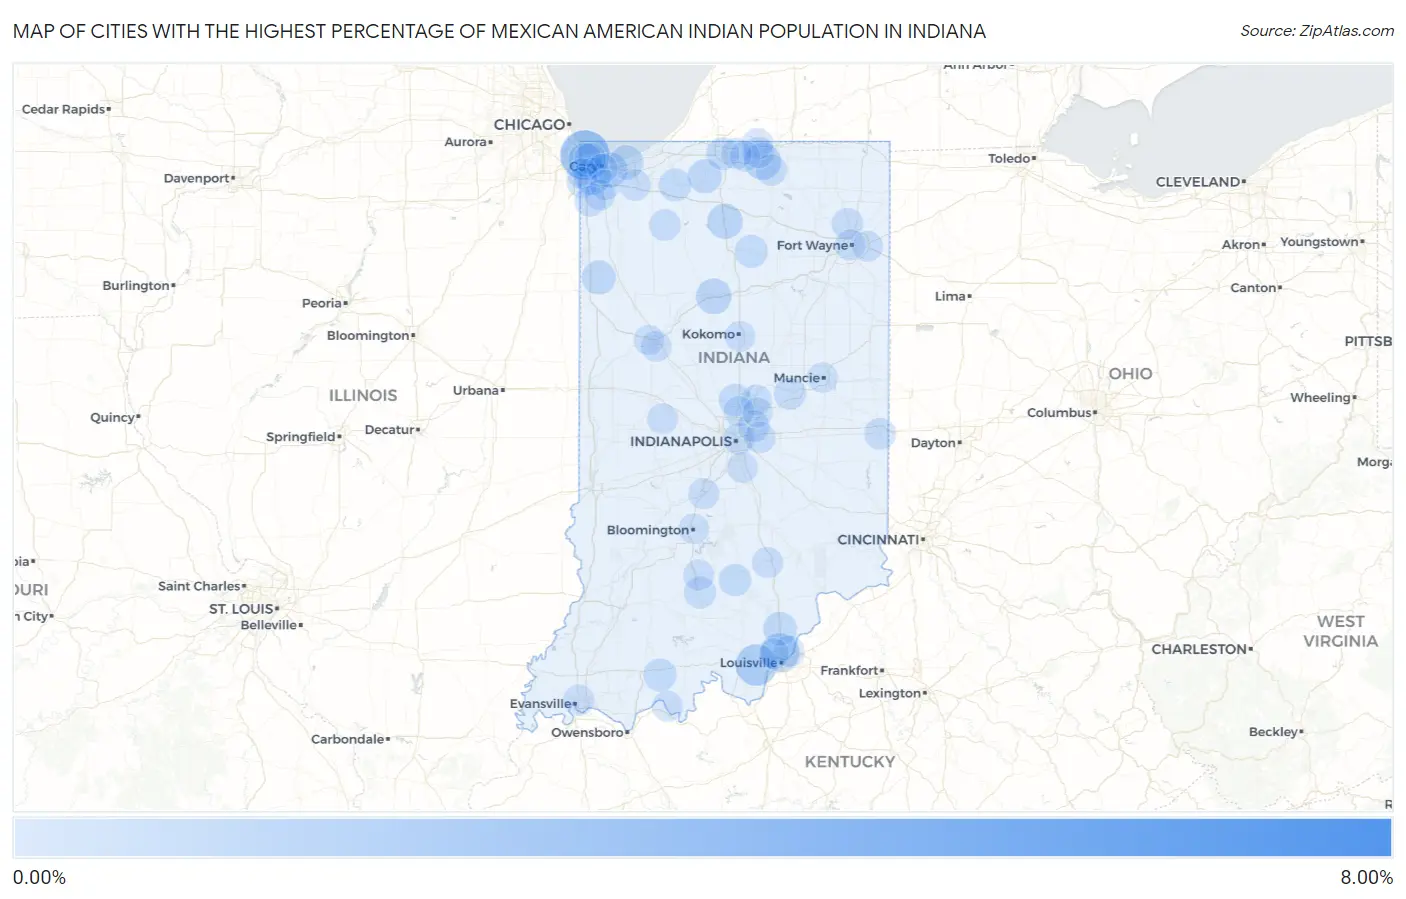
Map of Cities with the Highest Percentage of Mexican American Indian Population in Indiana
0.00%
8.00%
Cities with the Highest Percentage of Mexican American Indian Population in Indiana
| City | Mexican American Indian | vs State | vs National | |
| 1. | Romney | 6.71% | 0.084%(+6.62)#1 | 0.16%(+6.55)#44 |
| 2. | Whiting | 2.58% | 0.084%(+2.50)#2 | 0.16%(+2.42)#169 |
| 3. | Lanesville | 1.48% | 0.084%(+1.39)#3 | 0.16%(+1.32)#357 |
| 4. | Clarksville | 1.14% | 0.084%(+1.05)#4 | 0.16%(+0.980)#488 |
| 5. | Dunlap | 0.91% | 0.084%(+0.828)#5 | 0.16%(+0.756)#628 |
| 6. | Griffith | 0.89% | 0.084%(+0.806)#6 | 0.16%(+0.734)#646 |
| 7. | Logansport | 0.73% | 0.084%(+0.648)#7 | 0.16%(+0.576)#778 |
| 8. | Argos | 0.68% | 0.084%(+0.597)#8 | 0.16%(+0.525)#827 |
| 9. | Lake Station | 0.65% | 0.084%(+0.567)#9 | 0.16%(+0.495)#863 |
| 10. | Burns Harbor | 0.54% | 0.084%(+0.456)#10 | 0.16%(+0.383)#1,012 |
| 11. | North Liberty | 0.52% | 0.084%(+0.437)#11 | 0.16%(+0.365)#1,043 |
| 12. | Brook | 0.52% | 0.084%(+0.437)#12 | 0.16%(+0.365)#1,045 |
| 13. | Hammond | 0.51% | 0.084%(+0.424)#13 | 0.16%(+0.352)#1,066 |
| 14. | Memphis | 0.46% | 0.084%(+0.378)#14 | 0.16%(+0.306)#1,158 |
| 15. | St Meinrad | 0.38% | 0.084%(+0.298)#15 | 0.16%(+0.225)#1,324 |
| 16. | Akron | 0.38% | 0.084%(+0.293)#16 | 0.16%(+0.220)#1,338 |
| 17. | Kingsford Heights | 0.36% | 0.084%(+0.275)#17 | 0.16%(+0.203)#1,371 |
| 18. | Westfield | 0.32% | 0.084%(+0.237)#18 | 0.16%(+0.165)#1,470 |
| 19. | Medora | 0.32% | 0.084%(+0.232)#19 | 0.16%(+0.160)#1,489 |
| 20. | South Bend | 0.30% | 0.084%(+0.217)#20 | 0.16%(+0.145)#1,523 |
| 21. | Mitchell | 0.28% | 0.084%(+0.195)#21 | 0.16%(+0.122)#1,580 |
| 22. | Anderson | 0.27% | 0.084%(+0.183)#22 | 0.16%(+0.111)#1,622 |
| 23. | North Judson | 0.19% | 0.084%(+0.106)#23 | 0.16%(+0.034)#1,922 |
| 24. | Indianapolis | 0.19% | 0.084%(+0.106)#24 | 0.16%(+0.033)#1,925 |
| 25. | Richmond | 0.19% | 0.084%(+0.104)#25 | 0.16%(+0.032)#1,941 |
| 26. | Huntertown | 0.19% | 0.084%(+0.103)#26 | 0.16%(+0.031)#1,945 |
| 27. | Lawrence | 0.18% | 0.084%(+0.101)#27 | 0.16%(+0.029)#1,959 |
| 28. | Goshen | 0.18% | 0.084%(+0.097)#28 | 0.16%(+0.025)#1,972 |
| 29. | Cumberland | 0.17% | 0.084%(+0.083)#29 | 0.16%(+0.011)#2,046 |
| 30. | East Chicago | 0.17% | 0.084%(+0.083)#30 | 0.16%(+0.011)#2,047 |
| 31. | Jeffersonville | 0.16% | 0.084%(+0.079)#31 | 0.16%(+0.007)#2,073 |
| 32. | Valparaiso | 0.16% | 0.084%(+0.072)#32 | 0.16%(-0.000)#2,108 |
| 33. | Simonton Lake | 0.15% | 0.084%(+0.071)#33 | 0.16%(-0.002)#2,120 |
| 34. | Elkhart | 0.15% | 0.084%(+0.070)#34 | 0.16%(-0.002)#2,124 |
| 35. | Seymour | 0.15% | 0.084%(+0.061)#35 | 0.16%(-0.011)#2,167 |
| 36. | Bedford | 0.12% | 0.084%(+0.032)#36 | 0.16%(-0.040)#2,318 |
| 37. | Tell City | 0.11% | 0.084%(+0.023)#37 | 0.16%(-0.049)#2,378 |
| 38. | Evansville | 0.10% | 0.084%(+0.017)#38 | 0.16%(-0.055)#2,418 |
| 39. | Martinsville | 0.10% | 0.084%(+0.017)#39 | 0.16%(-0.056)#2,419 |
| 40. | Munster | 0.097% | 0.084%(+0.013)#40 | 0.16%(-0.059)#2,445 |
| 41. | Lafayette | 0.093% | 0.084%(+0.009)#41 | 0.16%(-0.063)#2,470 |
| 42. | Dyer | 0.091% | 0.084%(+0.007)#42 | 0.16%(-0.065)#2,480 |
| 43. | Ladoga | 0.087% | 0.084%(+0.003)#43 | 0.16%(-0.069)#2,507 |
| 44. | Fort Wayne | 0.085% | 0.084%(+0.001)#44 | 0.16%(-0.071)#2,527 |
| 45. | Cedar Lake | 0.084% | 0.084%(+0.000)#45 | 0.16%(-0.072)#2,536 |
| 46. | Mishawaka | 0.081% | 0.084%(-0.004)#46 | 0.16%(-0.076)#2,574 |
| 47. | Osceola | 0.077% | 0.084%(-0.007)#47 | 0.16%(-0.079)#2,596 |
| 48. | New Albany | 0.074% | 0.084%(-0.010)#48 | 0.16%(-0.082)#2,620 |
| 49. | Kokomo | 0.074% | 0.084%(-0.010)#49 | 0.16%(-0.082)#2,626 |
| 50. | Noblesville | 0.071% | 0.084%(-0.013)#50 | 0.16%(-0.085)#2,648 |
| 51. | New Haven | 0.071% | 0.084%(-0.013)#51 | 0.16%(-0.085)#2,652 |
| 52. | Greenwood | 0.068% | 0.084%(-0.016)#52 | 0.16%(-0.089)#2,674 |
| 53. | Crown Point | 0.065% | 0.084%(-0.019)#53 | 0.16%(-0.091)#2,691 |
| 54. | Bloomington | 0.051% | 0.084%(-0.033)#54 | 0.16%(-0.106)#2,799 |
| 55. | Carmel | 0.048% | 0.084%(-0.036)#55 | 0.16%(-0.108)#2,811 |
| 56. | Muncie | 0.038% | 0.084%(-0.046)#56 | 0.16%(-0.118)#2,892 |
| 57. | Merrillville | 0.025% | 0.084%(-0.059)#57 | 0.16%(-0.131)#3,023 |
| 58. | West Lafayette | 0.018% | 0.084%(-0.066)#58 | 0.16%(-0.138)#3,106 |
| 59. | Fishers | 0.016% | 0.084%(-0.068)#59 | 0.16%(-0.140)#3,122 |
| 60. | Gary | 0.0072% | 0.084%(-0.077)#60 | 0.16%(-0.149)#3,190 |
Common Questions
What are the Top 10 Cities with the Highest Percentage of Mexican American Indian Population in Indiana?
Top 10 Cities with the Highest Percentage of Mexican American Indian Population in Indiana are:
#1
2.58%
#2
1.48%
#3
1.14%
#4
0.91%
#5
0.89%
#6
0.73%
#7
0.68%
#8
0.65%
#9
0.54%
#10
0.52%
What city has the Highest Percentage of Mexican American Indian Population in Indiana?
Whiting has the Highest Percentage of Mexican American Indian Population in Indiana with 2.58%.
What is the Percentage of Mexican American Indian Population in the State of Indiana?
Percentage of Mexican American Indian Population in Indiana is 0.084%.
What is the Percentage of Mexican American Indian Population in the United States?
Percentage of Mexican American Indian Population in the United States is 0.16%.