Cities with the Highest Percentage of Mexican American Indian Population in Texas
RELATED REPORTS & OPTIONS
Mexican American Indian
Texas
Compare Cities
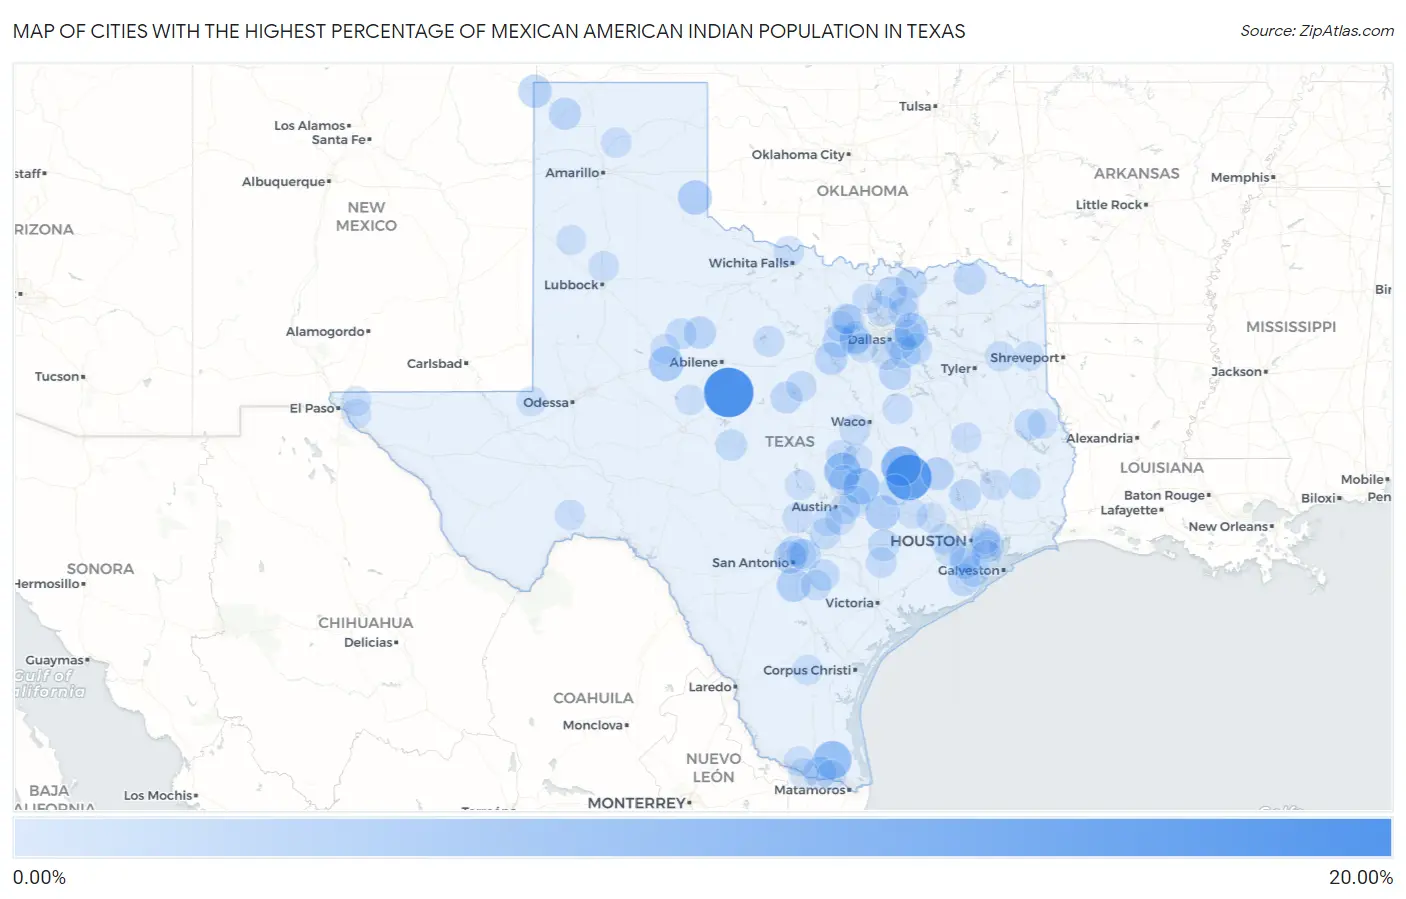
Map of Cities with the Highest Percentage of Mexican American Indian Population in Texas
0.00%
20.00%
Cities with the Highest Percentage of Mexican American Indian Population in Texas
| City | Mexican American Indian | vs State | vs National | |
| 1. | Novice | 19.77% | 0.23%(+19.5)#1 | 0.16%(+19.6)#6 |
| 2. | Lake Bryan | 15.65% | 0.23%(+15.4)#2 | 0.16%(+15.5)#8 |
| 3. | Hearne | 10.05% | 0.23%(+9.82)#3 | 0.16%(+9.90)#20 |
| 4. | Sebastian | 8.15% | 0.23%(+7.92)#4 | 0.16%(+7.99)#30 |
| 5. | Jarrell | 6.94% | 0.23%(+6.71)#5 | 0.16%(+6.79)#41 |
| 6. | Thrall | 6.40% | 0.23%(+6.17)#6 | 0.16%(+6.24)#45 |
| 7. | Loraine | 5.05% | 0.23%(+4.81)#7 | 0.16%(+4.89)#69 |
| 8. | Wellington | 4.59% | 0.23%(+4.36)#8 | 0.16%(+4.43)#77 |
| 9. | Giddings | 4.44% | 0.23%(+4.21)#9 | 0.16%(+4.29)#81 |
| 10. | Mobile City | 4.33% | 0.23%(+4.10)#10 | 0.16%(+4.18)#84 |
| 11. | Leming | 4.28% | 0.23%(+4.05)#11 | 0.16%(+4.12)#85 |
| 12. | Texline | 3.51% | 0.23%(+3.27)#12 | 0.16%(+3.35)#114 |
| 13. | Bedias | 3.21% | 0.23%(+2.98)#13 | 0.16%(+3.06)#127 |
| 14. | Lingleville | 3.16% | 0.23%(+2.93)#14 | 0.16%(+3.01)#130 |
| 15. | Balcones Heights | 3.08% | 0.23%(+2.85)#15 | 0.16%(+2.92)#133 |
| 16. | Hudson Oaks | 2.84% | 0.23%(+2.61)#16 | 0.16%(+2.68)#150 |
| 17. | Oak Trail Shores | 2.82% | 0.23%(+2.59)#17 | 0.16%(+2.67)#152 |
| 18. | Dalhart | 2.68% | 0.23%(+2.45)#18 | 0.16%(+2.53)#160 |
| 19. | Hamlin | 2.66% | 0.23%(+2.43)#19 | 0.16%(+2.51)#164 |
| 20. | Midway South | 2.56% | 0.23%(+2.33)#20 | 0.16%(+2.41)#171 |
| 21. | Bardwell | 2.54% | 0.23%(+2.31)#21 | 0.16%(+2.39)#174 |
| 22. | Gunter | 2.50% | 0.23%(+2.27)#22 | 0.16%(+2.34)#179 |
| 23. | Blossom | 2.38% | 0.23%(+2.15)#23 | 0.16%(+2.22)#192 |
| 24. | Bailey S Prairie | 2.36% | 0.23%(+2.13)#24 | 0.16%(+2.20)#198 |
| 25. | Willis | 2.32% | 0.23%(+2.08)#25 | 0.16%(+2.16)#202 |
| 26. | Comanche | 2.21% | 0.23%(+1.98)#26 | 0.16%(+2.05)#216 |
| 27. | Bells | 2.13% | 0.23%(+1.90)#27 | 0.16%(+1.97)#227 |
| 28. | Chireno | 2.08% | 0.23%(+1.84)#28 | 0.16%(+1.92)#232 |
| 29. | Schulenburg | 2.05% | 0.23%(+1.82)#29 | 0.16%(+1.90)#236 |
| 30. | Melvin | 1.99% | 0.23%(+1.75)#30 | 0.16%(+1.83)#242 |
| 31. | Combine | 1.95% | 0.23%(+1.72)#31 | 0.16%(+1.80)#249 |
| 32. | Post Oak Bend City | 1.92% | 0.23%(+1.69)#32 | 0.16%(+1.76)#252 |
| 33. | Alvin | 1.90% | 0.23%(+1.67)#33 | 0.16%(+1.74)#256 |
| 34. | Randolph Afb | 1.84% | 0.23%(+1.61)#34 | 0.16%(+1.68)#267 |
| 35. | Stockdale | 1.84% | 0.23%(+1.61)#35 | 0.16%(+1.68)#268 |
| 36. | Sansom Park | 1.84% | 0.23%(+1.61)#36 | 0.16%(+1.68)#269 |
| 37. | Balch Springs | 1.83% | 0.23%(+1.60)#37 | 0.16%(+1.67)#273 |
| 38. | Sandy Point | 1.68% | 0.23%(+1.44)#38 | 0.16%(+1.52)#305 |
| 39. | San Marcos | 1.67% | 0.23%(+1.44)#39 | 0.16%(+1.51)#307 |
| 40. | Warren | 1.64% | 0.23%(+1.41)#40 | 0.16%(+1.49)#316 |
| 41. | La Porte | 1.57% | 0.23%(+1.34)#41 | 0.16%(+1.41)#333 |
| 42. | Elgin | 1.52% | 0.23%(+1.29)#42 | 0.16%(+1.37)#344 |
| 43. | Rotan | 1.50% | 0.23%(+1.26)#43 | 0.16%(+1.34)#351 |
| 44. | Caldwell | 1.48% | 0.23%(+1.25)#44 | 0.16%(+1.32)#355 |
| 45. | Hallettsville | 1.39% | 0.23%(+1.16)#45 | 0.16%(+1.24)#387 |
| 46. | Breckenridge | 1.38% | 0.23%(+1.14)#46 | 0.16%(+1.22)#390 |
| 47. | River Oaks | 1.37% | 0.23%(+1.14)#47 | 0.16%(+1.21)#393 |
| 48. | Mcgregor | 1.28% | 0.23%(+1.05)#48 | 0.16%(+1.12)#429 |
| 49. | Heath | 1.27% | 0.23%(+1.04)#49 | 0.16%(+1.11)#430 |
| 50. | The Homesteads | 1.24% | 0.23%(+1.01)#50 | 0.16%(+1.08)#439 |
| 51. | Poth | 1.23% | 0.23%(+0.996)#51 | 0.16%(+1.07)#445 |
| 52. | Burkburnett | 1.21% | 0.23%(+0.979)#52 | 0.16%(+1.06)#451 |
| 53. | Harker Heights | 1.20% | 0.23%(+0.969)#53 | 0.16%(+1.05)#458 |
| 54. | Katy | 1.18% | 0.23%(+0.946)#54 | 0.16%(+1.02)#467 |
| 55. | Dublin | 1.18% | 0.23%(+0.945)#55 | 0.16%(+1.02)#468 |
| 56. | Little Elm | 1.17% | 0.23%(+0.937)#56 | 0.16%(+1.01)#476 |
| 57. | Aurora | 1.16% | 0.23%(+0.927)#57 | 0.16%(+1.00)#483 |
| 58. | Hollywood Park | 1.15% | 0.23%(+0.920)#58 | 0.16%(+0.997)#484 |
| 59. | Arcola | 1.15% | 0.23%(+0.920)#59 | 0.16%(+0.996)#485 |
| 60. | Fritch | 1.09% | 0.23%(+0.860)#60 | 0.16%(+0.936)#514 |
| 61. | Deer Park | 1.08% | 0.23%(+0.846)#61 | 0.16%(+0.922)#523 |
| 62. | Goodrich | 1.06% | 0.23%(+0.832)#62 | 0.16%(+0.908)#532 |
| 63. | Coolidge | 1.06% | 0.23%(+0.827)#63 | 0.16%(+0.903)#535 |
| 64. | Springtown | 1.05% | 0.23%(+0.820)#64 | 0.16%(+0.896)#537 |
| 65. | White Oak | 1.03% | 0.23%(+0.795)#65 | 0.16%(+0.872)#553 |
| 66. | Blanco | 1.02% | 0.23%(+0.792)#66 | 0.16%(+0.868)#555 |
| 67. | Granjeno | 1.01% | 0.23%(+0.781)#67 | 0.16%(+0.857)#561 |
| 68. | Abernathy | 0.95% | 0.23%(+0.717)#68 | 0.16%(+0.793)#601 |
| 69. | Sanderson | 0.95% | 0.23%(+0.714)#69 | 0.16%(+0.790)#605 |
| 70. | Hornsby Bend | 0.93% | 0.23%(+0.701)#70 | 0.16%(+0.778)#613 |
| 71. | Crockett | 0.93% | 0.23%(+0.695)#71 | 0.16%(+0.771)#622 |
| 72. | Channelview | 0.91% | 0.23%(+0.673)#72 | 0.16%(+0.749)#631 |
| 73. | Lowry Crossing | 0.90% | 0.23%(+0.670)#73 | 0.16%(+0.746)#635 |
| 74. | San Diego | 0.89% | 0.23%(+0.662)#74 | 0.16%(+0.738)#642 |
| 75. | Boyd | 0.85% | 0.23%(+0.622)#75 | 0.16%(+0.698)#670 |
| 76. | Mountain City | 0.83% | 0.23%(+0.594)#76 | 0.16%(+0.670)#692 |
| 77. | Glenn Heights | 0.81% | 0.23%(+0.583)#77 | 0.16%(+0.659)#700 |
| 78. | Earth | 0.80% | 0.23%(+0.568)#78 | 0.16%(+0.645)#704 |
| 79. | Little River Academy | 0.80% | 0.23%(+0.568)#79 | 0.16%(+0.644)#706 |
| 80. | Brenham | 0.78% | 0.23%(+0.549)#80 | 0.16%(+0.625)#722 |
| 81. | La Feria | 0.77% | 0.23%(+0.542)#81 | 0.16%(+0.618)#736 |
| 82. | Hempstead | 0.77% | 0.23%(+0.542)#82 | 0.16%(+0.618)#737 |
| 83. | Live Oak | 0.77% | 0.23%(+0.537)#83 | 0.16%(+0.613)#741 |
| 84. | San Augustine | 0.76% | 0.23%(+0.527)#84 | 0.16%(+0.603)#749 |
| 85. | Granite Shoals | 0.76% | 0.23%(+0.523)#85 | 0.16%(+0.599)#751 |
| 86. | Horizon City | 0.75% | 0.23%(+0.522)#86 | 0.16%(+0.598)#753 |
| 87. | Kermit | 0.75% | 0.23%(+0.520)#87 | 0.16%(+0.596)#758 |
| 88. | Belterra | 0.75% | 0.23%(+0.516)#88 | 0.16%(+0.593)#761 |
| 89. | Sanger | 0.74% | 0.23%(+0.509)#89 | 0.16%(+0.585)#770 |
| 90. | Nassau Bay | 0.73% | 0.23%(+0.496)#90 | 0.16%(+0.572)#781 |
| 91. | Citrus City | 0.72% | 0.23%(+0.487)#91 | 0.16%(+0.563)#788 |
| 92. | Homestead Meadows North | 0.72% | 0.23%(+0.483)#92 | 0.16%(+0.559)#793 |
| 93. | Bronte | 0.71% | 0.23%(+0.475)#93 | 0.16%(+0.552)#805 |
| 94. | Forest Hill | 0.70% | 0.23%(+0.470)#94 | 0.16%(+0.546)#811 |
| 95. | Hermleigh | 0.70% | 0.23%(+0.467)#95 | 0.16%(+0.543)#812 |
| 96. | Richmond | 0.70% | 0.23%(+0.463)#96 | 0.16%(+0.539)#815 |
| 97. | Weir | 0.69% | 0.23%(+0.461)#97 | 0.16%(+0.537)#819 |
| 98. | Mustang Ridge | 0.68% | 0.23%(+0.446)#98 | 0.16%(+0.522)#830 |
| 99. | Marshall | 0.68% | 0.23%(+0.444)#99 | 0.16%(+0.520)#833 |
| 100. | Anna | 0.67% | 0.23%(+0.440)#100 | 0.16%(+0.516)#837 |
Common Questions
What are the Top 10 Cities with the Highest Percentage of Mexican American Indian Population in Texas?
Top 10 Cities with the Highest Percentage of Mexican American Indian Population in Texas are:
#1
19.77%
#2
15.65%
#3
10.05%
#4
8.15%
#5
6.94%
#6
6.40%
#7
5.05%
#8
4.59%
#9
4.44%
#10
4.33%
What city has the Highest Percentage of Mexican American Indian Population in Texas?
Novice has the Highest Percentage of Mexican American Indian Population in Texas with 19.77%.
What is the Percentage of Mexican American Indian Population in the State of Texas?
Percentage of Mexican American Indian Population in Texas is 0.23%.
What is the Percentage of Mexican American Indian Population in the United States?
Percentage of Mexican American Indian Population in the United States is 0.16%.