Cities with the Highest Percentage of Mexican American Indian Population in Illinois
RELATED REPORTS & OPTIONS
Mexican American Indian
Illinois
Compare Cities
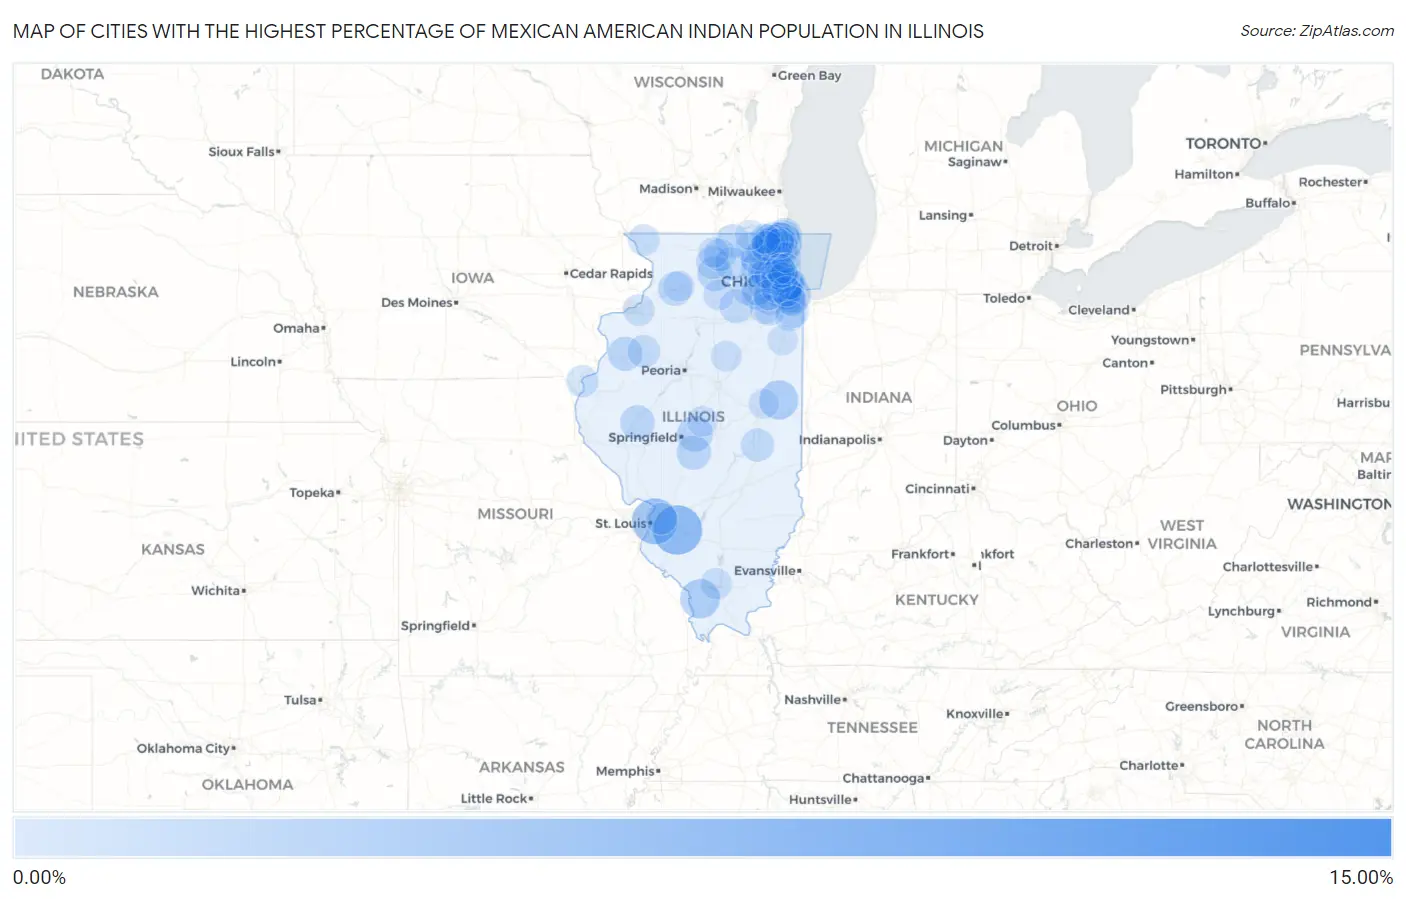
Map of Cities with the Highest Percentage of Mexican American Indian Population in Illinois
0.00%
15.00%
Cities with the Highest Percentage of Mexican American Indian Population in Illinois
| City | Mexican American Indian | vs State | vs National | |
| 1. | Ridgewood | 13.17% | 0.29%(+12.9)#1 | 0.16%(+13.0)#10 |
| 2. | New Baden | 6.18% | 0.29%(+5.89)#2 | 0.16%(+6.03)#48 |
| 3. | Fairmont City | 5.08% | 0.29%(+4.79)#3 | 0.16%(+4.93)#68 |
| 4. | Park City | 3.77% | 0.29%(+3.47)#4 | 0.16%(+3.61)#103 |
| 5. | Third Lake | 3.38% | 0.29%(+3.09)#5 | 0.16%(+3.22)#121 |
| 6. | Alto Pass | 3.15% | 0.29%(+2.86)#6 | 0.16%(+2.99)#131 |
| 7. | Indian Head Park | 3.03% | 0.29%(+2.74)#7 | 0.16%(+2.88)#137 |
| 8. | Penfield | 3.03% | 0.29%(+2.74)#8 | 0.16%(+2.87)#138 |
| 9. | Round Lake Park | 2.67% | 0.29%(+2.38)#9 | 0.16%(+2.52)#162 |
| 10. | Stickney | 2.63% | 0.29%(+2.34)#10 | 0.16%(+2.47)#166 |
| 11. | Merrionette Park | 2.38% | 0.29%(+2.09)#11 | 0.16%(+2.23)#190 |
| 12. | Buffalo | 2.02% | 0.29%(+1.72)#12 | 0.16%(+1.86)#238 |
| 13. | Franklin Park | 1.89% | 0.29%(+1.60)#13 | 0.16%(+1.73)#261 |
| 14. | Hickory Hills | 1.82% | 0.29%(+1.53)#14 | 0.16%(+1.66)#276 |
| 15. | Bulpitt | 1.68% | 0.29%(+1.39)#15 | 0.16%(+1.52)#303 |
| 16. | Hillcrest | 1.65% | 0.29%(+1.36)#16 | 0.16%(+1.50)#313 |
| 17. | Beardstown | 1.63% | 0.29%(+1.34)#17 | 0.16%(+1.48)#317 |
| 18. | Mundelein | 1.61% | 0.29%(+1.32)#18 | 0.16%(+1.46)#321 |
| 19. | Monmouth | 1.59% | 0.29%(+1.30)#19 | 0.16%(+1.43)#326 |
| 20. | Como | 1.50% | 0.29%(+1.21)#20 | 0.16%(+1.34)#350 |
| 21. | Winthrop Harbor | 1.46% | 0.29%(+1.17)#21 | 0.16%(+1.31)#361 |
| 22. | Sheridan | 1.41% | 0.29%(+1.12)#22 | 0.16%(+1.25)#381 |
| 23. | Capron | 1.39% | 0.29%(+1.10)#23 | 0.16%(+1.24)#386 |
| 24. | Sugar Grove | 1.33% | 0.29%(+1.04)#24 | 0.16%(+1.17)#410 |
| 25. | Arcola | 1.28% | 0.29%(+0.994)#25 | 0.16%(+1.13)#427 |
| 26. | Carpentersville | 1.24% | 0.29%(+0.952)#26 | 0.16%(+1.09)#437 |
| 27. | Davis Junction | 1.22% | 0.29%(+0.933)#27 | 0.16%(+1.07)#447 |
| 28. | Summit | 1.21% | 0.29%(+0.915)#28 | 0.16%(+1.05)#454 |
| 29. | Kingston | 1.18% | 0.29%(+0.885)#29 | 0.16%(+1.02)#471 |
| 30. | East Galesburg | 1.13% | 0.29%(+0.842)#30 | 0.16%(+0.976)#490 |
| 31. | Park Forest | 1.13% | 0.29%(+0.836)#31 | 0.16%(+0.970)#495 |
| 32. | Bonnie Brae | 1.12% | 0.29%(+0.831)#32 | 0.16%(+0.965)#501 |
| 33. | Forest View | 1.11% | 0.29%(+0.823)#33 | 0.16%(+0.957)#504 |
| 34. | Glendale Heights | 1.11% | 0.29%(+0.816)#34 | 0.16%(+0.950)#507 |
| 35. | Hainesville | 1.10% | 0.29%(+0.809)#35 | 0.16%(+0.943)#509 |
| 36. | Cherry Valley | 1.08% | 0.29%(+0.794)#36 | 0.16%(+0.928)#518 |
| 37. | Addison | 1.04% | 0.29%(+0.749)#37 | 0.16%(+0.883)#545 |
| 38. | Streamwood | 0.99% | 0.29%(+0.698)#38 | 0.16%(+0.832)#580 |
| 39. | Romeoville | 0.96% | 0.29%(+0.669)#39 | 0.16%(+0.803)#593 |
| 40. | Warrenville | 0.93% | 0.29%(+0.642)#40 | 0.16%(+0.776)#614 |
| 41. | Nauvoo | 0.93% | 0.29%(+0.639)#41 | 0.16%(+0.773)#617 |
| 42. | Zion | 0.93% | 0.29%(+0.638)#42 | 0.16%(+0.772)#620 |
| 43. | North Chicago | 0.87% | 0.29%(+0.577)#43 | 0.16%(+0.711)#663 |
| 44. | Round Lake | 0.85% | 0.29%(+0.556)#44 | 0.16%(+0.690)#675 |
| 45. | Wheeling | 0.84% | 0.29%(+0.555)#45 | 0.16%(+0.689)#677 |
| 46. | Boulder Hill | 0.82% | 0.29%(+0.527)#46 | 0.16%(+0.661)#696 |
| 47. | Bensenville | 0.80% | 0.29%(+0.508)#47 | 0.16%(+0.642)#709 |
| 48. | Collinsville | 0.79% | 0.29%(+0.496)#48 | 0.16%(+0.630)#718 |
| 49. | Berwyn | 0.78% | 0.29%(+0.488)#49 | 0.16%(+0.622)#730 |
| 50. | Waukegan | 0.77% | 0.29%(+0.478)#50 | 0.16%(+0.612)#742 |
| 51. | Elgin | 0.77% | 0.29%(+0.475)#51 | 0.16%(+0.609)#745 |
| 52. | The Galena Territory | 0.75% | 0.29%(+0.457)#52 | 0.16%(+0.591)#762 |
| 53. | Cicero | 0.75% | 0.29%(+0.457)#53 | 0.16%(+0.591)#763 |
| 54. | Carbon Cliff | 0.75% | 0.29%(+0.455)#54 | 0.16%(+0.589)#767 |
| 55. | Alsip | 0.73% | 0.29%(+0.436)#55 | 0.16%(+0.570)#782 |
| 56. | Bartlett | 0.72% | 0.29%(+0.432)#56 | 0.16%(+0.566)#786 |
| 57. | Herrin | 0.71% | 0.29%(+0.423)#57 | 0.16%(+0.557)#799 |
| 58. | Island Lake | 0.70% | 0.29%(+0.406)#58 | 0.16%(+0.540)#813 |
| 59. | Stone Park | 0.68% | 0.29%(+0.389)#59 | 0.16%(+0.523)#829 |
| 60. | Hillside | 0.67% | 0.29%(+0.379)#60 | 0.16%(+0.513)#842 |
| 61. | Oak Lawn | 0.66% | 0.29%(+0.365)#61 | 0.16%(+0.499)#854 |
| 62. | Bloomingdale | 0.64% | 0.29%(+0.347)#62 | 0.16%(+0.481)#882 |
| 63. | Algonquin | 0.62% | 0.29%(+0.332)#63 | 0.16%(+0.466)#903 |
| 64. | Cary | 0.62% | 0.29%(+0.331)#64 | 0.16%(+0.465)#905 |
| 65. | Hanover Park | 0.62% | 0.29%(+0.330)#65 | 0.16%(+0.464)#906 |
| 66. | Preston Heights | 0.58% | 0.29%(+0.290)#66 | 0.16%(+0.424)#960 |
| 67. | Burbank | 0.58% | 0.29%(+0.287)#67 | 0.16%(+0.421)#964 |
| 68. | Sterling | 0.57% | 0.29%(+0.282)#68 | 0.16%(+0.416)#968 |
| 69. | Aurora | 0.57% | 0.29%(+0.278)#69 | 0.16%(+0.412)#974 |
| 70. | Mount Pulaski | 0.55% | 0.29%(+0.260)#70 | 0.16%(+0.394)#997 |
| 71. | Chicago | 0.55% | 0.29%(+0.258)#71 | 0.16%(+0.392)#999 |
| 72. | Midlothian | 0.54% | 0.29%(+0.245)#72 | 0.16%(+0.379)#1,024 |
| 73. | Flanagan | 0.53% | 0.29%(+0.243)#73 | 0.16%(+0.377)#1,027 |
| 74. | Vernon Hills | 0.53% | 0.29%(+0.237)#74 | 0.16%(+0.371)#1,036 |
| 75. | Paw Paw | 0.51% | 0.29%(+0.219)#75 | 0.16%(+0.353)#1,062 |
| 76. | Joliet | 0.51% | 0.29%(+0.216)#76 | 0.16%(+0.350)#1,069 |
| 77. | Fox Lake Hills | 0.50% | 0.29%(+0.210)#77 | 0.16%(+0.344)#1,081 |
| 78. | Wadsworth | 0.49% | 0.29%(+0.203)#78 | 0.16%(+0.337)#1,096 |
| 79. | Wood Dale | 0.47% | 0.29%(+0.184)#79 | 0.16%(+0.319)#1,130 |
| 80. | Rockford | 0.47% | 0.29%(+0.183)#80 | 0.16%(+0.318)#1,134 |
| 81. | Round Lake Beach | 0.46% | 0.29%(+0.172)#81 | 0.16%(+0.307)#1,155 |
| 82. | Lindenhurst | 0.46% | 0.29%(+0.168)#82 | 0.16%(+0.302)#1,168 |
| 83. | Villa Park | 0.46% | 0.29%(+0.167)#83 | 0.16%(+0.301)#1,174 |
| 84. | Bolingbrook | 0.46% | 0.29%(+0.167)#84 | 0.16%(+0.301)#1,175 |
| 85. | River Grove | 0.45% | 0.29%(+0.156)#85 | 0.16%(+0.290)#1,202 |
| 86. | Woodstock | 0.44% | 0.29%(+0.151)#86 | 0.16%(+0.285)#1,216 |
| 87. | Westmont | 0.44% | 0.29%(+0.151)#87 | 0.16%(+0.285)#1,217 |
| 88. | Niles | 0.41% | 0.29%(+0.124)#88 | 0.16%(+0.258)#1,255 |
| 89. | Rosemont | 0.41% | 0.29%(+0.124)#89 | 0.16%(+0.258)#1,256 |
| 90. | Highland Park | 0.41% | 0.29%(+0.117)#90 | 0.16%(+0.251)#1,266 |
| 91. | Gurnee | 0.40% | 0.29%(+0.105)#91 | 0.16%(+0.239)#1,299 |
| 92. | Kankakee | 0.39% | 0.29%(+0.101)#92 | 0.16%(+0.235)#1,312 |
| 93. | Thomasboro | 0.39% | 0.29%(+0.101)#93 | 0.16%(+0.235)#1,313 |
| 94. | Markham | 0.37% | 0.29%(+0.081)#94 | 0.16%(+0.215)#1,348 |
| 95. | Bridgeview | 0.37% | 0.29%(+0.076)#95 | 0.16%(+0.210)#1,357 |
| 96. | Volo | 0.36% | 0.29%(+0.071)#96 | 0.16%(+0.205)#1,365 |
| 97. | Fox Lake | 0.36% | 0.29%(+0.071)#97 | 0.16%(+0.205)#1,366 |
| 98. | Des Plaines | 0.36% | 0.29%(+0.068)#98 | 0.16%(+0.202)#1,377 |
| 99. | Monee | 0.35% | 0.29%(+0.061)#99 | 0.16%(+0.195)#1,388 |
| 100. | Hebron | 0.34% | 0.29%(+0.053)#100 | 0.16%(+0.187)#1,416 |
Common Questions
What are the Top 10 Cities with the Highest Percentage of Mexican American Indian Population in Illinois?
Top 10 Cities with the Highest Percentage of Mexican American Indian Population in Illinois are:
#1
6.18%
#2
5.08%
#3
3.77%
#4
3.38%
#5
3.15%
#6
3.03%
#7
3.03%
#8
2.67%
#9
2.63%
#10
2.38%
What city has the Highest Percentage of Mexican American Indian Population in Illinois?
New Baden has the Highest Percentage of Mexican American Indian Population in Illinois with 6.18%.
What is the Percentage of Mexican American Indian Population in the State of Illinois?
Percentage of Mexican American Indian Population in Illinois is 0.29%.
What is the Percentage of Mexican American Indian Population in the United States?
Percentage of Mexican American Indian Population in the United States is 0.16%.