Cities with the Highest Percentage of Immigrants from Eastern Europe in Vermont
RELATED REPORTS & OPTIONS
Eastern Europe
Vermont
Compare Cities
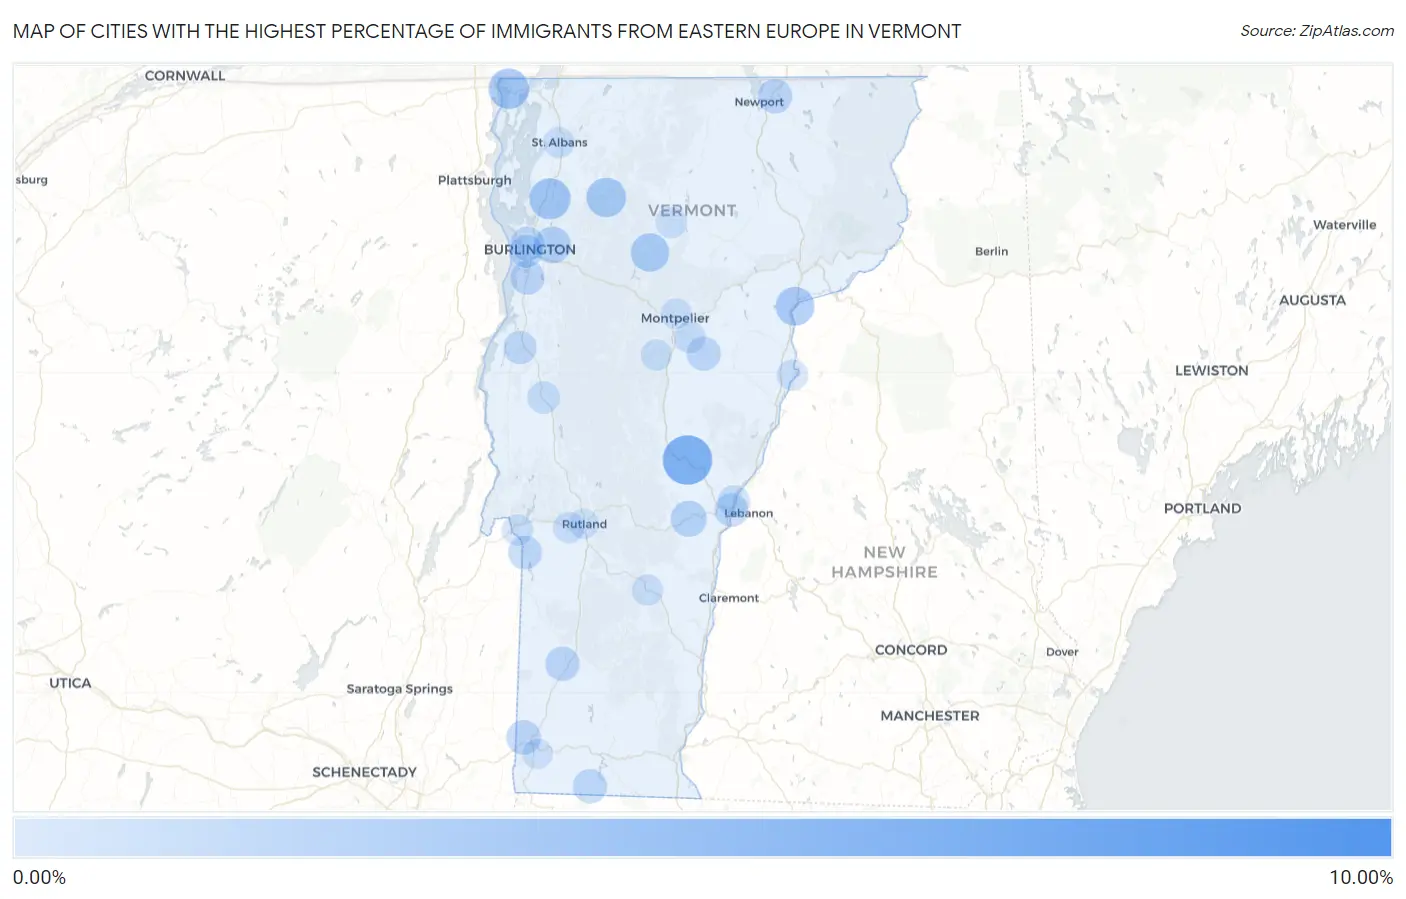
Map of Cities with the Highest Percentage of Immigrants from Eastern Europe in Vermont
0.00%
10.00%
Cities with the Highest Percentage of Immigrants from Eastern Europe in Vermont
| City | Eastern Europe | vs State | vs National | |
| 1. | Harmonyville | 8.72% | 0.43%(+8.29)#1 | 0.67%(+8.05)#95 |
| 2. | South Lincoln | 7.19% | 0.43%(+6.76)#2 | 0.67%(+6.52)#131 |
| 3. | South Royalton | 5.26% | 0.43%(+4.83)#3 | 0.67%(+4.60)#237 |
| 4. | Milton | 2.91% | 0.43%(+2.48)#4 | 0.67%(+2.24)#632 |
| 5. | Alburgh | 2.71% | 0.43%(+2.28)#5 | 0.67%(+2.04)#701 |
| 6. | Cambridge | 2.53% | 0.43%(+2.10)#6 | 0.67%(+1.86)#784 |
| 7. | Barnet | 2.29% | 0.43%(+1.86)#7 | 0.67%(+1.62)#919 |
| 8. | Stowe | 2.22% | 0.43%(+1.79)#8 | 0.67%(+1.55)#955 |
| 9. | North Clarendon | 2.12% | 0.43%(+1.69)#9 | 0.67%(+1.46)#1,014 |
| 10. | Essex Junction | 1.74% | 0.43%(+1.31)#10 | 0.67%(+1.07)#1,331 |
| 11. | Woodstock | 1.55% | 0.43%(+1.12)#11 | 0.67%(+0.882)#1,542 |
| 12. | North Bennington | 1.20% | 0.43%(+0.767)#12 | 0.67%(+0.530)#2,063 |
| 13. | Manchester | 1.14% | 0.43%(+0.708)#13 | 0.67%(+0.471)#2,163 |
| 14. | Danby | 1.12% | 0.43%(+0.694)#14 | 0.67%(+0.456)#2,196 |
| 15. | Derby Center | 1.12% | 0.43%(+0.692)#15 | 0.67%(+0.455)#2,199 |
| 16. | Shelburne | 1.10% | 0.43%(+0.668)#16 | 0.67%(+0.431)#2,254 |
| 17. | East Barre | 1.06% | 0.43%(+0.626)#17 | 0.67%(+0.389)#2,339 |
| 18. | Readsboro | 1.06% | 0.43%(+0.626)#18 | 0.67%(+0.389)#2,340 |
| 19. | Burlington | 1.03% | 0.43%(+0.603)#19 | 0.67%(+0.365)#2,393 |
| 20. | Poultney | 0.96% | 0.43%(+0.530)#20 | 0.67%(+0.293)#2,565 |
| 21. | White River Junction | 0.94% | 0.43%(+0.510)#21 | 0.67%(+0.273)#2,610 |
| 22. | Killington | 0.85% | 0.43%(+0.425)#22 | 0.67%(+0.188)#2,863 |
| 23. | South Burlington | 0.83% | 0.43%(+0.400)#23 | 0.67%(+0.163)#2,927 |
| 24. | Vergennes | 0.82% | 0.43%(+0.390)#24 | 0.67%(+0.153)#2,956 |
| 25. | Middlebury | 0.61% | 0.43%(+0.178)#25 | 0.67%(-0.060)#3,750 |
| 26. | Wilder | 0.52% | 0.43%(+0.093)#26 | 0.67%(-0.144)#4,124 |
| 27. | Barre | 0.38% | 0.43%(-0.053)#27 | 0.67%(-0.290)#4,972 |
| 28. | Morrisville | 0.35% | 0.43%(-0.081)#28 | 0.67%(-0.318)#5,155 |
| 29. | Fair Haven | 0.33% | 0.43%(-0.100)#29 | 0.67%(-0.337)#5,273 |
| 30. | West Rutland | 0.32% | 0.43%(-0.115)#30 | 0.67%(-0.352)#5,370 |
| 31. | Ludlow | 0.28% | 0.43%(-0.149)#31 | 0.67%(-0.386)#5,664 |
| 32. | Northfield | 0.27% | 0.43%(-0.157)#32 | 0.67%(-0.394)#5,748 |
| 33. | St Albans | 0.25% | 0.43%(-0.183)#33 | 0.67%(-0.420)#6,002 |
| 34. | Newbury | 0.23% | 0.43%(-0.197)#34 | 0.67%(-0.434)#6,139 |
| 35. | Montpelier | 0.16% | 0.43%(-0.268)#35 | 0.67%(-0.505)#6,831 |
| 36. | Bennington | 0.069% | 0.43%(-0.361)#36 | 0.67%(-0.599)#7,683 |
| 37. | Rutland | 0.063% | 0.43%(-0.367)#37 | 0.67%(-0.604)#7,727 |
1
2Common Questions
What are the Top 10 Cities with the Highest Percentage of Immigrants from Eastern Europe in Vermont?
Top 10 Cities with the Highest Percentage of Immigrants from Eastern Europe in Vermont are:
#1
5.26%
#2
2.91%
#3
2.71%
#4
2.53%
#5
2.29%
#6
2.22%
#7
1.74%
#8
1.55%
#9
1.20%
#10
1.14%
What city has the Highest Percentage of Immigrants from Eastern Europe in Vermont?
South Royalton has the Highest Percentage of Immigrants from Eastern Europe in Vermont with 5.26%.
What is the Percentage of Immigrants from Eastern Europe in the State of Vermont?
Percentage of Immigrants from Eastern Europe in Vermont is 0.43%.
What is the Percentage of Immigrants from Eastern Europe in the United States?
Percentage of Immigrants from Eastern Europe in the United States is 0.67%.