Cities with the Highest Percentage of Immigrants from Eastern Europe in Kansas
RELATED REPORTS & OPTIONS
Eastern Europe
Kansas
Compare Cities
Map of Cities with the Highest Percentage of Immigrants from Eastern Europe in Kansas
0.00%
2.00%
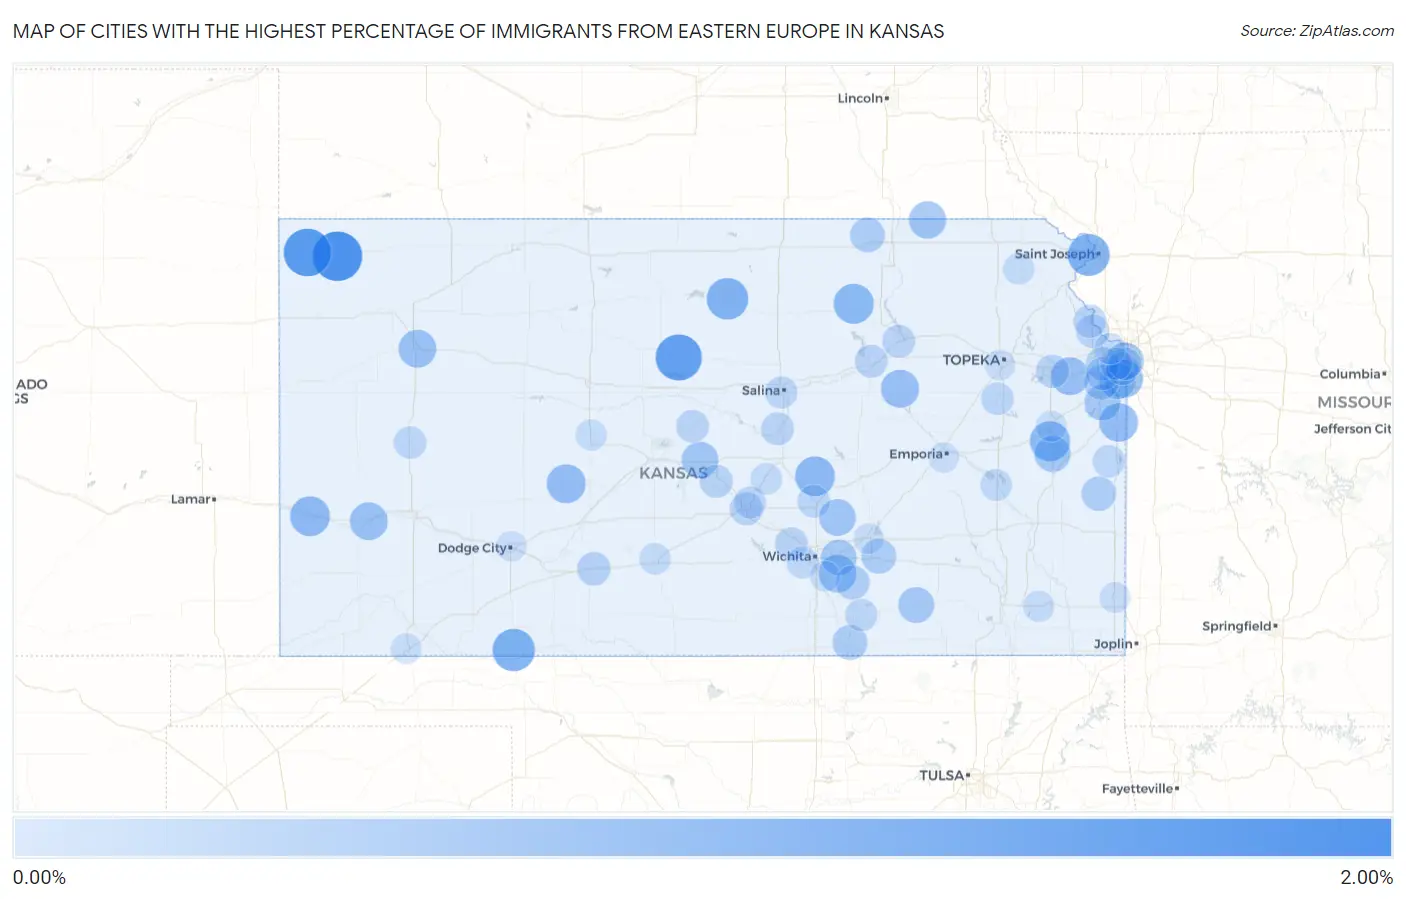
Cities with the Highest Percentage of Immigrants from Eastern Europe in Kansas
| City | Eastern Europe | vs State | vs National | |
| 1. | Bird City | 1.90% | 0.17%(+1.73)#1 | 0.67%(+1.24)#1,169 |
| 2. | St Francis | 1.71% | 0.17%(+1.54)#2 | 0.67%(+1.04)#1,359 |
| 3. | Lucas | 1.56% | 0.17%(+1.39)#3 | 0.67%(+0.895)#1,521 |
| 4. | Englewood | 1.18% | 0.17%(+1.01)#4 | 0.67%(+0.509)#2,091 |
| 5. | Wathena | 1.13% | 0.17%(+0.964)#5 | 0.67%(+0.467)#2,167 |
| 6. | Beloit | 1.10% | 0.17%(+0.933)#6 | 0.67%(+0.436)#2,240 |
| 7. | Princeton | 0.96% | 0.17%(+0.791)#7 | 0.67%(+0.294)#2,556 |
| 8. | Green | 0.95% | 0.17%(+0.782)#8 | 0.67%(+0.285)#2,580 |
| 9. | Syracuse | 0.93% | 0.17%(+0.756)#9 | 0.67%(+0.259)#2,651 |
| 10. | Goessel | 0.92% | 0.17%(+0.747)#10 | 0.67%(+0.250)#2,679 |
| 11. | Burdett | 0.83% | 0.17%(+0.663)#11 | 0.67%(+0.166)#2,917 |
| 12. | Louisburg | 0.81% | 0.17%(+0.640)#12 | 0.67%(+0.143)#2,977 |
| 13. | Leawood | 0.80% | 0.17%(+0.626)#13 | 0.67%(+0.129)#3,034 |
| 14. | Eudora | 0.75% | 0.17%(+0.577)#14 | 0.67%(+0.080)#3,198 |
| 15. | Dwight | 0.75% | 0.17%(+0.576)#15 | 0.67%(+0.079)#3,200 |
| 16. | Oakley | 0.73% | 0.17%(+0.557)#16 | 0.67%(+0.060)#3,258 |
| 17. | Lakin | 0.73% | 0.17%(+0.556)#17 | 0.67%(+0.059)#3,261 |
| 18. | Rose Hill | 0.71% | 0.17%(+0.541)#18 | 0.67%(+0.044)#3,320 |
| 19. | Summerfield | 0.68% | 0.17%(+0.510)#19 | 0.67%(+0.013)#3,448 |
| 20. | Westwood Hills | 0.68% | 0.17%(+0.506)#20 | 0.67%(+0.009)#3,465 |
| 21. | Whitewater | 0.62% | 0.17%(+0.453)#21 | 0.67%(-0.044)#3,683 |
| 22. | Chase | 0.62% | 0.17%(+0.446)#22 | 0.67%(-0.051)#3,710 |
| 23. | Richmond | 0.58% | 0.17%(+0.414)#23 | 0.67%(-0.083)#3,855 |
| 24. | Spring Hill | 0.56% | 0.17%(+0.385)#24 | 0.67%(-0.111)#3,973 |
| 25. | Overland Park | 0.55% | 0.17%(+0.379)#25 | 0.67%(-0.118)#4,009 |
| 26. | Grenola | 0.54% | 0.17%(+0.370)#26 | 0.67%(-0.127)#4,047 |
| 27. | Andover | 0.54% | 0.17%(+0.367)#27 | 0.67%(-0.130)#4,064 |
| 28. | Arkansas City | 0.45% | 0.17%(+0.280)#28 | 0.67%(-0.217)#4,506 |
| 29. | Leon | 0.44% | 0.17%(+0.270)#29 | 0.67%(-0.227)#4,554 |
| 30. | Hanover | 0.43% | 0.17%(+0.263)#30 | 0.67%(-0.234)#4,600 |
| 31. | Olathe | 0.42% | 0.17%(+0.246)#31 | 0.67%(-0.251)#4,707 |
| 32. | Mound City | 0.41% | 0.17%(+0.241)#32 | 0.67%(-0.256)#4,734 |
| 33. | Douglass | 0.38% | 0.17%(+0.208)#33 | 0.67%(-0.289)#4,963 |
| 34. | Greensburg | 0.32% | 0.17%(+0.148)#34 | 0.67%(-0.349)#5,352 |
| 35. | Shawnee | 0.31% | 0.17%(+0.145)#35 | 0.67%(-0.352)#5,372 |
| 36. | Lawrence | 0.28% | 0.17%(+0.115)#36 | 0.67%(-0.382)#5,625 |
| 37. | South Hutchinson | 0.28% | 0.17%(+0.114)#37 | 0.67%(-0.383)#5,640 |
| 38. | Sterling | 0.28% | 0.17%(+0.109)#38 | 0.67%(-0.388)#5,688 |
| 39. | Lenexa | 0.27% | 0.17%(+0.105)#39 | 0.67%(-0.392)#5,734 |
| 40. | Lansing | 0.27% | 0.17%(+0.096)#40 | 0.67%(-0.401)#5,809 |
| 41. | Leavenworth | 0.27% | 0.17%(+0.096)#41 | 0.67%(-0.401)#5,812 |
| 42. | Lindsborg | 0.27% | 0.17%(+0.096)#42 | 0.67%(-0.401)#5,816 |
| 43. | Manhattan | 0.27% | 0.17%(+0.095)#43 | 0.67%(-0.402)#5,822 |
| 44. | Colwich | 0.26% | 0.17%(+0.094)#44 | 0.67%(-0.403)#5,832 |
| 45. | Junction City | 0.26% | 0.17%(+0.085)#45 | 0.67%(-0.412)#5,922 |
| 46. | Holyrood | 0.24% | 0.17%(+0.070)#46 | 0.67%(-0.427)#6,066 |
| 47. | Prairie Village | 0.24% | 0.17%(+0.070)#47 | 0.67%(-0.427)#6,072 |
| 48. | North Newton | 0.24% | 0.17%(+0.067)#48 | 0.67%(-0.430)#6,095 |
| 49. | Scranton | 0.23% | 0.17%(+0.060)#49 | 0.67%(-0.437)#6,164 |
| 50. | Mission Hills | 0.22% | 0.17%(+0.054)#50 | 0.67%(-0.443)#6,224 |
| 51. | Scott City | 0.22% | 0.17%(+0.048)#51 | 0.67%(-0.449)#6,282 |
| 52. | La Cygne | 0.21% | 0.17%(+0.040)#52 | 0.67%(-0.457)#6,360 |
| 53. | Winfield | 0.19% | 0.17%(+0.025)#53 | 0.67%(-0.472)#6,520 |
| 54. | Salina | 0.19% | 0.17%(+0.022)#54 | 0.67%(-0.475)#6,536 |
| 55. | Hutchinson | 0.18% | 0.17%(+0.005)#55 | 0.67%(-0.492)#6,709 |
| 56. | Wichita | 0.17% | 0.17%(-0.004)#56 | 0.67%(-0.501)#6,783 |
| 57. | Merriam | 0.16% | 0.17%(-0.008)#57 | 0.67%(-0.505)#6,824 |
| 58. | Burlington | 0.15% | 0.17%(-0.017)#58 | 0.67%(-0.514)#6,921 |
| 59. | Inman | 0.14% | 0.17%(-0.029)#59 | 0.67%(-0.526)#7,048 |
| 60. | Pratt | 0.14% | 0.17%(-0.034)#60 | 0.67%(-0.530)#7,097 |
| 61. | Horton | 0.12% | 0.17%(-0.053)#61 | 0.67%(-0.550)#7,251 |
| 62. | Kansas City | 0.10% | 0.17%(-0.068)#62 | 0.67%(-0.565)#7,380 |
| 63. | La Crosse | 0.086% | 0.17%(-0.084)#63 | 0.67%(-0.581)#7,527 |
| 64. | Parsons | 0.084% | 0.17%(-0.086)#64 | 0.67%(-0.583)#7,543 |
| 65. | Ottawa | 0.079% | 0.17%(-0.091)#65 | 0.67%(-0.588)#7,576 |
| 66. | Pittsburg | 0.063% | 0.17%(-0.107)#66 | 0.67%(-0.604)#7,730 |
| 67. | Liberal | 0.058% | 0.17%(-0.113)#67 | 0.67%(-0.610)#7,773 |
| 68. | Emporia | 0.041% | 0.17%(-0.129)#68 | 0.67%(-0.626)#7,891 |
| 69. | Topeka | 0.038% | 0.17%(-0.132)#69 | 0.67%(-0.629)#7,924 |
| 70. | Dodge City | 0.036% | 0.17%(-0.134)#70 | 0.67%(-0.631)#7,941 |
| 71. | El Dorado | 0.031% | 0.17%(-0.139)#71 | 0.67%(-0.636)#7,980 |
| 72. | Derby | 0.023% | 0.17%(-0.147)#72 | 0.67%(-0.644)#8,019 |
Common Questions
What are the Top 10 Cities with the Highest Percentage of Immigrants from Eastern Europe in Kansas?
Top 10 Cities with the Highest Percentage of Immigrants from Eastern Europe in Kansas are:
What city has the Highest Percentage of Immigrants from Eastern Europe in Kansas?
Bird City has the Highest Percentage of Immigrants from Eastern Europe in Kansas with 1.90%.
What is the Percentage of Immigrants from Eastern Europe in the State of Kansas?
Percentage of Immigrants from Eastern Europe in Kansas is 0.17%.
What is the Percentage of Immigrants from Eastern Europe in the United States?
Percentage of Immigrants from Eastern Europe in the United States is 0.67%.