Cities with the Highest Percentage of Immigrants from Eastern Europe in Arkansas

RELATED REPORTS & OPTIONS

Eastern Europe
Population
Families and Households
Female Fertility
Female Fertility (Unmarried)
Race (Community Size)
Race (Percentage)
Ancestry (Community Size)
AfghanAfricanAlaska NativeAlaskan AthabascanAlbanianAleutAlsatianAmericanApacheArabArapahoArgentineanArmenianAssyrian / Chaldean / SyriacAustralianAustrianBahamianBangladeshiBarbadianBasqueBelgianBelizeanBermudanBhutaneseBlackfeetBolivianBrazilianBritishBritish West IndianBulgarianBurmeseCajunCambodianCanadianCape VerdeanCarpatho RusynCelticCentral AmericanCentral American IndianCherokeeCheyenneChickasawChileanChineseChippewaChoctawColombianColvilleComancheCosta RicanCreeCreekCroatianCrowCubanCypriotCzechCzechoslovakianDanishDelawareDominicanDutchDutch West IndianEastern EuropeanEcuadorianEgyptianEnglishEstonianEthiopianEuropeanFijianFilipinoFinnishFrenchFrench American IndianFrench CanadianGermanGerman RussianGhanaianGreekGuamanian / ChamorroGuatemalanGuyaneseHaitianHmongHonduranHopiHoumaHungarianIcelanderIndian (Asian)IndonesianInupiatIranianIraqiIrishIroquoisIsraeliItalianJamaicanJapaneseJordanianKenyanKiowaKoreanLaotianLatvianLebaneseLiberianLithuanianLumbeeLuxembourgerMacedonianMalaysianMalteseMarshalleseMenomineeMexicanMexican American IndianMongolianMoroccanNative HawaiianNavajoNepaleseNew ZealanderNicaraguanNigerianNorthern EuropeanNorwegianOkinawanOsageOttawaPaiutePakistaniPalestinianPanamanianParaguayanPennsylvania GermanPeruvianPimaPolishPortuguesePotawatomiPuebloPuerto RicanPuget Sound SalishRomanianRussianSalvadoranSamoanScandinavianScotch-IrishScottishSeminoleSenegaleseSerbianShoshoneSierra LeoneanSiouxSlavicSlovakSloveneSomaliSouth AfricanSouth AmericanSouth American IndianSoviet UnionSpaniardSpanishSpanish AmericanSpanish American IndianSri LankanSubsaharan AfricanSudaneseSwedishSwissSyrianTaiwaneseThaiTlingit-HaidaTohono O'OdhamTonganTrinidadian and TobagonianTsimshianTurkishU.S. Virgin IslanderUgandanUkrainianUruguayanUteVenezuelanVietnameseWelshWest IndianYakamaYaquiYugoslavianYumanYup'ikZimbabwean
Ancestry (Percentage)
AfghanAfricanAlaska NativeAlaskan AthabascanAlbanianAleutAlsatianAmericanApacheArabArapahoArgentineanArmenianAssyrian / Chaldean / SyriacAustralianAustrianBahamianBangladeshiBarbadianBasqueBelgianBelizeanBermudanBhutaneseBlackfeetBolivianBrazilianBritishBritish West IndianBulgarianBurmeseCajunCambodianCanadianCape VerdeanCarpatho RusynCelticCentral AmericanCentral American IndianCherokeeCheyenneChickasawChileanChineseChippewaChoctawColombianColvilleComancheCosta RicanCreeCreekCroatianCrowCubanCypriotCzechCzechoslovakianDanishDelawareDominicanDutchDutch West IndianEastern EuropeanEcuadorianEgyptianEnglishEstonianEthiopianEuropeanFijianFilipinoFinnishFrenchFrench American IndianFrench CanadianGermanGerman RussianGhanaianGreekGuamanian / ChamorroGuatemalanGuyaneseHaitianHmongHonduranHopiHoumaHungarianIcelanderIndian (Asian)IndonesianInupiatIranianIraqiIrishIroquoisIsraeliItalianJamaicanJapaneseJordanianKenyanKiowaKoreanLaotianLatvianLebaneseLiberianLithuanianLumbeeLuxembourgerMacedonianMalaysianMalteseMarshalleseMenomineeMexicanMexican American IndianMongolianMoroccanNative HawaiianNavajoNepaleseNew ZealanderNicaraguanNigerianNorthern EuropeanNorwegianOkinawanOsageOttawaPaiutePakistaniPalestinianPanamanianParaguayanPennsylvania GermanPeruvianPimaPolishPortuguesePotawatomiPuebloPuerto RicanPuget Sound SalishRomanianRussianSalvadoranSamoanScandinavianScotch-IrishScottishSeminoleSenegaleseSerbianShoshoneSierra LeoneanSiouxSlavicSlovakSloveneSomaliSouth AfricanSouth AmericanSouth American IndianSoviet UnionSpaniardSpanishSpanish AmericanSpanish American IndianSri LankanSubsaharan AfricanSudaneseSwedishSwissSyrianTaiwaneseThaiTlingit-HaidaTohono O'OdhamTonganTrinidadian and TobagonianTsimshianTurkishU.S. Virgin IslanderUgandanUkrainianUruguayanUteVenezuelanVietnameseWelshWest IndianYakamaYaquiYugoslavianYumanYup'ikZimbabwean
Immigrant Origin (Total)
AfghanistanAfricaAlbaniaArgentinaArmeniaAsiaAustraliaAustriaAzoresBahamasBangladeshBarbadosBelarusBelgiumBelizeBoliviaBosnia and HerzegovinaBrazilBulgariaBurma / MyanmarCabo VerdeCambodiaCameroonCanadaCaribbeanCentral AmericaChileChinaColombiaCongoCosta RicaCroatiaCubaCzechoslovakiaDenmarkDominicaDominican RepublicEastern AfricaEastern AsiaEastern EuropeEcuadorEgyptEl SalvadorEnglandEritreaEthiopiaEuropeFijiFranceGermanyGhanaGreeceGrenadaGuatemalaGuyanaHaitiHondurasHong KongHungaryIndiaIndonesiaIranIraqIrelandIsraelItalyJamaicaJapanJordanKazakhstanKenyaKoreaKuwaitLaosLatin AmericaLatviaLebanonLiberiaLithuaniaMalaysiaMexicoMicronesiaMiddle AfricaMoldovaMoroccoNepalNetherlandsNicaraguaNigeriaNorth MacedoniaNorthern AfricaNorthern EuropeNorwayOceaniaPakistanPanamaPeruPhilippinesPolandPortugalRomaniaRussiaSaudi ArabiaScotlandSenegalSerbiaSierra LeoneSingaporeSomaliaSouth AfricaSouth AmericaSouth Central AsiaSouth Eastern AsiaSouthern EuropeSpainSri LankaSt. Vincent and the GrenadinesSudanSwedenSwitzerlandSyriaTaiwanThailandTrinidad and TobagoTurkeyUgandaUkraineUruguayUzbekistanVenezuelaVietnamWest IndiesWestern AfricaWestern AsiaWestern EuropeYemenZaireZimbabwe
Immigrant Origin (Percentage)
AfghanistanAfricaAlbaniaArgentinaArmeniaAsiaAustraliaAustriaAzoresBahamasBangladeshBarbadosBelarusBelgiumBelizeBoliviaBosnia and HerzegovinaBrazilBulgariaBurma / MyanmarCabo VerdeCambodiaCameroonCanadaCaribbeanCentral AmericaChileChinaColombiaCongoCosta RicaCroatiaCubaCzechoslovakiaDenmarkDominicaDominican RepublicEastern AfricaEastern AsiaEastern EuropeEcuadorEgyptEl SalvadorEnglandEritreaEthiopiaEuropeFijiFranceGermanyGhanaGreeceGrenadaGuatemalaGuyanaHaitiHondurasHong KongHungaryIndiaIndonesiaIranIraqIrelandIsraelItalyJamaicaJapanJordanKazakhstanKenyaKoreaKuwaitLaosLatin AmericaLatviaLebanonLiberiaLithuaniaMalaysiaMexicoMicronesiaMiddle AfricaMoldovaMoroccoNepalNetherlandsNicaraguaNigeriaNorth MacedoniaNorthern AfricaNorthern EuropeNorwayOceaniaPakistanPanamaPeruPhilippinesPolandPortugalRomaniaRussiaSaudi ArabiaScotlandSenegalSerbiaSierra LeoneSingaporeSomaliaSouth AfricaSouth AmericaSouth Central AsiaSouth Eastern AsiaSouthern EuropeSpainSri LankaSt. Vincent and the GrenadinesSudanSwedenSwitzerlandSyriaTaiwanThailandTrinidad and TobagoTurkeyUgandaUkraineUruguayUzbekistanVenezuelaVietnamWest IndiesWestern AfricaWestern AsiaWestern EuropeYemenZaireZimbabwe
Income
Income (Families)
Income (Households)
Poverty
Poverty (Families)
Unemployment
Employment Occupations
Employment Industries
Employer Class
Commute Time
Commute Means
School Enrollment
Education by Degree Field
Occupancy
Finances
Physical Characteristics
Arkansas
Compare Cities
Comparison Subject

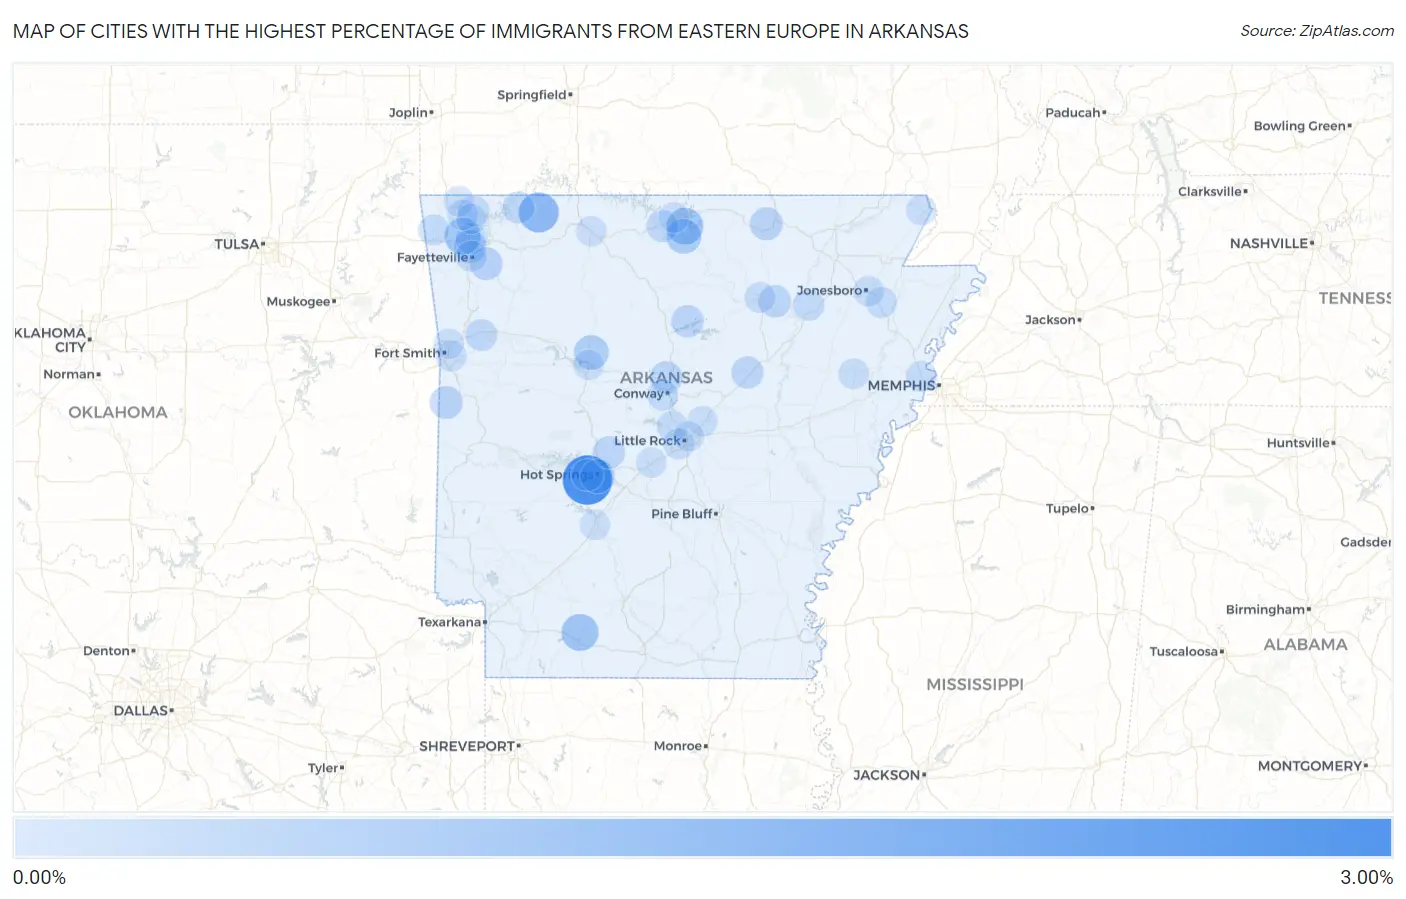
Map of Cities with the Highest Percentage of Immigrants from Eastern Europe in Arkansas

0.00%
3.00%
Cities with the Highest Percentage of Immigrants from Eastern Europe in Arkansas Map

Cities with the Highest Percentage of Immigrants from Eastern Europe in Arkansas

City Eastern Europe vs State vs National
1.Rockwell3.00%0.073%(+2.92)#10.67%(+2.33)#599
2.Berryville1.46%0.073%(+1.39)#20.67%(+0.798)#1,650
3.Mcneil1.02%0.073%(+0.950)#30.67%(+0.355)#2,418
4.Briarcliff0.96%0.073%(+0.884)#40.67%(+0.290)#2,572
5.Elm Springs0.93%0.073%(+0.854)#50.67%(+0.259)#2,652
6.Norfork0.72%0.073%(+0.650)#60.67%(+0.055)#3,278
7.Dover0.67%0.073%(+0.594)#70.67%(-0.000)#3,502
8.Hot Springs0.59%0.073%(+0.519)#80.67%(-0.075)#3,820
9.Cherokee Village0.41%0.073%(+0.342)#90.67%(-0.252)#4,716
10.Hartford0.40%0.073%(+0.327)#100.67%(-0.267)#4,805
11.Johnson0.39%0.073%(+0.316)#110.67%(-0.279)#4,885
12.Elkins0.39%0.073%(+0.313)#120.67%(-0.282)#4,904
13.Fairfield Bay0.35%0.073%(+0.277)#130.67%(-0.318)#5,157
14.Wooster0.35%0.073%(+0.274)#140.67%(-0.321)#5,174
15.Hot Springs Village0.33%0.073%(+0.254)#150.67%(-0.341)#5,301
16.Sulphur Rock0.32%0.073%(+0.243)#160.67%(-0.352)#5,367
17.Searcy0.31%0.073%(+0.237)#170.67%(-0.358)#5,417
18.Piney0.26%0.073%(+0.190)#180.67%(-0.404)#5,846
19.Mulberry0.25%0.073%(+0.175)#190.67%(-0.420)#5,999
20.Eureka Springs0.24%0.073%(+0.171)#200.67%(-0.424)#6,031
21.Gassville0.24%0.073%(+0.171)#210.67%(-0.424)#6,034
22.Tuckerman0.18%0.073%(+0.109)#220.67%(-0.486)#6,646
23.Springdale0.18%0.073%(+0.105)#230.67%(-0.489)#6,685
24.Little Flock0.17%0.073%(+0.093)#240.67%(-0.501)#6,791
25.Maumelle0.16%0.073%(+0.084)#250.67%(-0.511)#6,882
26.Fayetteville0.15%0.073%(+0.074)#260.67%(-0.521)#6,990
27.Gentry0.13%0.073%(+0.055)#270.67%(-0.539)#7,163
28.Conway0.13%0.073%(+0.055)#280.67%(-0.540)#7,169
29.Bay0.13%0.073%(+0.053)#290.67%(-0.542)#7,184
30.Little Rock0.11%0.073%(+0.041)#300.67%(-0.553)#7,284
31.Batesville0.099%0.073%(+0.026)#310.67%(-0.569)#7,415
32.Marion0.088%0.073%(+0.015)#320.67%(-0.579)#7,509
33.Wynne0.085%0.073%(+0.012)#330.67%(-0.583)#7,538
34.Jonesboro0.084%0.073%(+0.012)#340.67%(-0.583)#7,540
35.Bentonville0.077%0.073%(+0.005)#350.67%(-0.590)#7,599
36.Fort Smith0.073%0.073%(+0.000)#360.67%(-0.594)#7,644
37.Mountain Home0.070%0.073%(-0.003)#370.67%(-0.597)#7,669
38.Piggott0.055%0.073%(-0.017)#380.67%(-0.612)#7,792
39.Russellville0.052%0.073%(-0.021)#390.67%(-0.615)#7,817
40.Bella Vista0.046%0.073%(-0.026)#400.67%(-0.621)#7,854
41.Harrison0.046%0.073%(-0.027)#410.67%(-0.621)#7,856
42.Benton0.040%0.073%(-0.033)#420.67%(-0.627)#7,910
43.Jacksonville0.038%0.073%(-0.035)#430.67%(-0.630)#7,928
44.Van Buren0.034%0.073%(-0.038)#440.67%(-0.633)#7,952
45.Rogers0.030%0.073%(-0.042)#450.67%(-0.637)#7,985
46.North Little Rock0.028%0.073%(-0.045)#460.67%(-0.639)#7,998
47.Arkadelphia0.019%0.073%(-0.053)#470.67%(-0.648)#8,044

Common Questions

What are the Top 10 Cities with the Highest Percentage of Immigrants from Eastern Europe in Arkansas?
Top 10 Cities with the Highest Percentage of Immigrants from Eastern Europe in Arkansas are:
#1
3.00%
#2
1.46%
#3
1.02%
#4
0.96%
#5
0.93%
#6
0.72%
#7
0.67%
#8
0.59%
#9
0.41%
#10
0.40%
What city has the Highest Percentage of Immigrants from Eastern Europe in Arkansas?
Rockwell has the Highest Percentage of Immigrants from Eastern Europe in Arkansas with 3.00%.
What is the Percentage of Immigrants from Eastern Europe in the State of Arkansas?
Percentage of Immigrants from Eastern Europe in Arkansas is 0.073%.
What is the Percentage of Immigrants from Eastern Europe in the United States?
Percentage of Immigrants from Eastern Europe in the United States is 0.67%.