Cities with the Highest Percentage of Immigrants from Eastern Europe in Utah
RELATED REPORTS & OPTIONS
Eastern Europe
Utah
Compare Cities
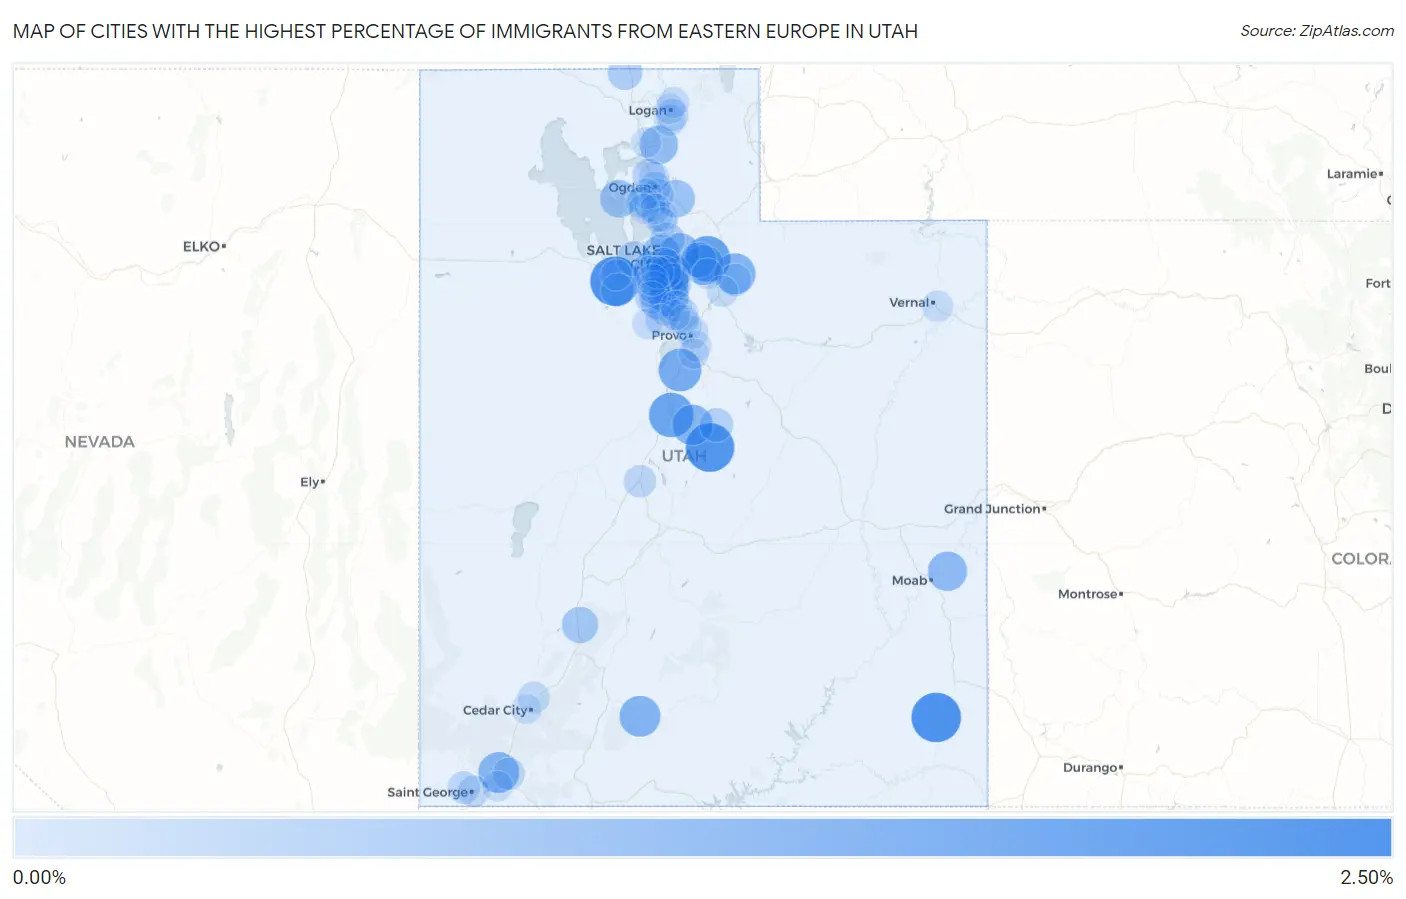
Map of Cities with the Highest Percentage of Immigrants from Eastern Europe in Utah
0.00%
2.50%
Cities with the Highest Percentage of Immigrants from Eastern Europe in Utah
| City | Eastern Europe | vs State | vs National | |
| 1. | Blanding | 2.09% | 0.27%(+1.82)#1 | 0.67%(+1.43)#1,034 |
| 2. | Erda | 2.08% | 0.27%(+1.81)#2 | 0.67%(+1.41)#1,044 |
| 3. | Spring City | 1.99% | 0.27%(+1.71)#3 | 0.67%(+1.32)#1,106 |
| 4. | Silver Summit | 1.64% | 0.27%(+1.37)#4 | 0.67%(+0.977)#1,429 |
| 5. | Nephi | 1.55% | 0.27%(+1.28)#5 | 0.67%(+0.885)#1,535 |
| 6. | East Basin | 1.40% | 0.27%(+1.12)#6 | 0.67%(+0.732)#1,736 |
| 7. | Spring Lake | 1.35% | 0.27%(+1.08)#7 | 0.67%(+0.687)#1,805 |
| 8. | Kamas | 1.16% | 0.27%(+0.887)#8 | 0.67%(+0.494)#2,119 |
| 9. | Tropic | 1.15% | 0.27%(+0.871)#9 | 0.67%(+0.478)#2,147 |
| 10. | Leeds | 1.13% | 0.27%(+0.854)#10 | 0.67%(+0.461)#2,183 |
| 11. | Fountain Green | 1.12% | 0.27%(+0.850)#11 | 0.67%(+0.457)#2,191 |
| 12. | Snyderville | 1.05% | 0.27%(+0.773)#12 | 0.67%(+0.380)#2,360 |
| 13. | Draper | 1.02% | 0.27%(+0.741)#13 | 0.67%(+0.348)#2,430 |
| 14. | Castle Valley | 0.98% | 0.27%(+0.704)#14 | 0.67%(+0.311)#2,513 |
| 15. | Sandy | 0.97% | 0.27%(+0.697)#15 | 0.67%(+0.304)#2,530 |
| 16. | Emigration Canyon | 0.93% | 0.27%(+0.657)#16 | 0.67%(+0.264)#2,639 |
| 17. | Mantua | 0.89% | 0.27%(+0.616)#17 | 0.67%(+0.223)#2,745 |
| 18. | Midvale | 0.83% | 0.27%(+0.560)#18 | 0.67%(+0.167)#2,914 |
| 19. | Salt Lake City | 0.81% | 0.27%(+0.540)#19 | 0.67%(+0.147)#2,967 |
| 20. | Hooper | 0.78% | 0.27%(+0.508)#20 | 0.67%(+0.115)#3,084 |
| 21. | Mountain Green | 0.77% | 0.27%(+0.494)#21 | 0.67%(+0.101)#3,126 |
| 22. | White | 0.74% | 0.27%(+0.463)#22 | 0.67%(+0.070)#3,223 |
| 23. | Holladay | 0.67% | 0.27%(+0.391)#23 | 0.67%(-0.002)#3,510 |
| 24. | Beaver | 0.64% | 0.27%(+0.367)#24 | 0.67%(-0.026)#3,606 |
| 25. | Millcreek | 0.59% | 0.27%(+0.319)#25 | 0.67%(-0.074)#3,810 |
| 26. | West Valley City | 0.59% | 0.27%(+0.311)#26 | 0.67%(-0.082)#3,849 |
| 27. | Summit Park | 0.55% | 0.27%(+0.277)#27 | 0.67%(-0.116)#3,996 |
| 28. | Bluffdale | 0.54% | 0.27%(+0.270)#28 | 0.67%(-0.123)#4,036 |
| 29. | Magna | 0.51% | 0.27%(+0.231)#29 | 0.67%(-0.162)#4,215 |
| 30. | Bountiful | 0.48% | 0.27%(+0.204)#30 | 0.67%(-0.189)#4,355 |
| 31. | Portage | 0.48% | 0.27%(+0.204)#31 | 0.67%(-0.189)#4,358 |
| 32. | South Salt Lake | 0.47% | 0.27%(+0.197)#32 | 0.67%(-0.196)#4,396 |
| 33. | Granite | 0.43% | 0.27%(+0.153)#33 | 0.67%(-0.240)#4,643 |
| 34. | Fairview | 0.39% | 0.27%(+0.114)#34 | 0.67%(-0.279)#4,887 |
| 35. | Kearns | 0.36% | 0.27%(+0.081)#35 | 0.67%(-0.312)#5,108 |
| 36. | Cottonwood Heights | 0.32% | 0.27%(+0.048)#36 | 0.67%(-0.345)#5,330 |
| 37. | Tooele | 0.32% | 0.27%(+0.045)#37 | 0.67%(-0.348)#5,343 |
| 38. | Murray | 0.30% | 0.27%(+0.030)#38 | 0.67%(-0.363)#5,460 |
| 39. | Farr West | 0.28% | 0.27%(+0.010)#39 | 0.67%(-0.383)#5,637 |
| 40. | Lehi | 0.27% | 0.27%(-0.004)#40 | 0.67%(-0.397)#5,786 |
| 41. | Riverton | 0.27% | 0.27%(-0.009)#41 | 0.67%(-0.402)#5,823 |
| 42. | South Ogden | 0.26% | 0.27%(-0.011)#42 | 0.67%(-0.404)#5,841 |
| 43. | South Jordan | 0.26% | 0.27%(-0.012)#43 | 0.67%(-0.405)#5,856 |
| 44. | Francis | 0.25% | 0.27%(-0.020)#44 | 0.67%(-0.413)#5,928 |
| 45. | Scipio | 0.25% | 0.27%(-0.024)#45 | 0.67%(-0.417)#5,976 |
| 46. | Taylorsville | 0.25% | 0.27%(-0.025)#46 | 0.67%(-0.418)#5,980 |
| 47. | Santa Clara | 0.24% | 0.27%(-0.038)#47 | 0.67%(-0.431)#6,111 |
| 48. | Herriman | 0.22% | 0.27%(-0.052)#48 | 0.67%(-0.445)#6,240 |
| 49. | La Verkin | 0.21% | 0.27%(-0.068)#49 | 0.67%(-0.461)#6,400 |
| 50. | Providence | 0.20% | 0.27%(-0.072)#50 | 0.67%(-0.465)#6,437 |
| 51. | Ogden | 0.20% | 0.27%(-0.077)#51 | 0.67%(-0.470)#6,480 |
| 52. | Enoch | 0.19% | 0.27%(-0.089)#52 | 0.67%(-0.482)#6,604 |
| 53. | Pleasant Grove | 0.18% | 0.27%(-0.090)#53 | 0.67%(-0.483)#6,614 |
| 54. | Provo | 0.18% | 0.27%(-0.091)#54 | 0.67%(-0.484)#6,623 |
| 55. | St George | 0.17% | 0.27%(-0.103)#55 | 0.67%(-0.496)#6,731 |
| 56. | Saratoga Springs | 0.16% | 0.27%(-0.113)#56 | 0.67%(-0.506)#6,838 |
| 57. | West Jordan | 0.16% | 0.27%(-0.114)#57 | 0.67%(-0.507)#6,846 |
| 58. | Nibley | 0.15% | 0.27%(-0.125)#58 | 0.67%(-0.518)#6,953 |
| 59. | Harrisville | 0.14% | 0.27%(-0.129)#59 | 0.67%(-0.522)#7,010 |
| 60. | Naples | 0.14% | 0.27%(-0.131)#60 | 0.67%(-0.524)#7,028 |
| 61. | Highland | 0.14% | 0.27%(-0.134)#61 | 0.67%(-0.527)#7,058 |
| 62. | Clinton | 0.13% | 0.27%(-0.142)#62 | 0.67%(-0.535)#7,127 |
| 63. | Heber | 0.12% | 0.27%(-0.150)#63 | 0.67%(-0.543)#7,198 |
| 64. | Orem | 0.12% | 0.27%(-0.156)#64 | 0.67%(-0.549)#7,241 |
| 65. | Fruit Heights | 0.12% | 0.27%(-0.158)#65 | 0.67%(-0.551)#7,260 |
| 66. | Clearfield | 0.11% | 0.27%(-0.169)#66 | 0.67%(-0.562)#7,353 |
| 67. | Stansbury Park | 0.10% | 0.27%(-0.170)#67 | 0.67%(-0.562)#7,358 |
| 68. | North Logan | 0.10% | 0.27%(-0.174)#68 | 0.67%(-0.567)#7,398 |
| 69. | Kaysville | 0.092% | 0.27%(-0.182)#69 | 0.67%(-0.575)#7,474 |
| 70. | West Point | 0.089% | 0.27%(-0.185)#70 | 0.67%(-0.578)#7,505 |
| 71. | Park City | 0.084% | 0.27%(-0.191)#71 | 0.67%(-0.584)#7,545 |
| 72. | Roy | 0.077% | 0.27%(-0.197)#72 | 0.67%(-0.590)#7,604 |
| 73. | Hurricane | 0.063% | 0.27%(-0.211)#73 | 0.67%(-0.604)#7,729 |
| 74. | Eagle Mountain | 0.063% | 0.27%(-0.211)#74 | 0.67%(-0.604)#7,733 |
| 75. | Springville | 0.063% | 0.27%(-0.212)#75 | 0.67%(-0.605)#7,737 |
| 76. | Layton | 0.048% | 0.27%(-0.226)#76 | 0.67%(-0.619)#7,842 |
| 77. | Brigham City | 0.041% | 0.27%(-0.233)#77 | 0.67%(-0.626)#7,895 |
| 78. | Lindon | 0.035% | 0.27%(-0.239)#78 | 0.67%(-0.632)#7,946 |
| 79. | Logan | 0.032% | 0.27%(-0.242)#79 | 0.67%(-0.635)#7,972 |
| 80. | Spanish Fork | 0.028% | 0.27%(-0.246)#80 | 0.67%(-0.639)#7,997 |
| 81. | Cedar City | 0.028% | 0.27%(-0.246)#81 | 0.67%(-0.639)#7,999 |
| 82. | American Fork | 0.021% | 0.27%(-0.254)#82 | 0.67%(-0.647)#8,037 |
| 83. | Syracuse | 0.018% | 0.27%(-0.256)#83 | 0.67%(-0.649)#8,053 |
| 84. | Farmington | 0.0082% | 0.27%(-0.266)#84 | 0.67%(-0.659)#8,100 |
Common Questions
What are the Top 10 Cities with the Highest Percentage of Immigrants from Eastern Europe in Utah?
Top 10 Cities with the Highest Percentage of Immigrants from Eastern Europe in Utah are:
#1
2.09%
#2
2.08%
#3
1.99%
#4
1.64%
#5
1.55%
#6
1.35%
#7
1.16%
#8
1.15%
#9
1.13%
#10
1.12%
What city has the Highest Percentage of Immigrants from Eastern Europe in Utah?
Blanding has the Highest Percentage of Immigrants from Eastern Europe in Utah with 2.09%.
What is the Percentage of Immigrants from Eastern Europe in the State of Utah?
Percentage of Immigrants from Eastern Europe in Utah is 0.27%.
What is the Percentage of Immigrants from Eastern Europe in the United States?
Percentage of Immigrants from Eastern Europe in the United States is 0.67%.