Cities with the Highest Percentage of Immigrants from Burma / Myanmar in Illinois
RELATED REPORTS & OPTIONS
Burma / Myanmar
Illinois
Compare Cities
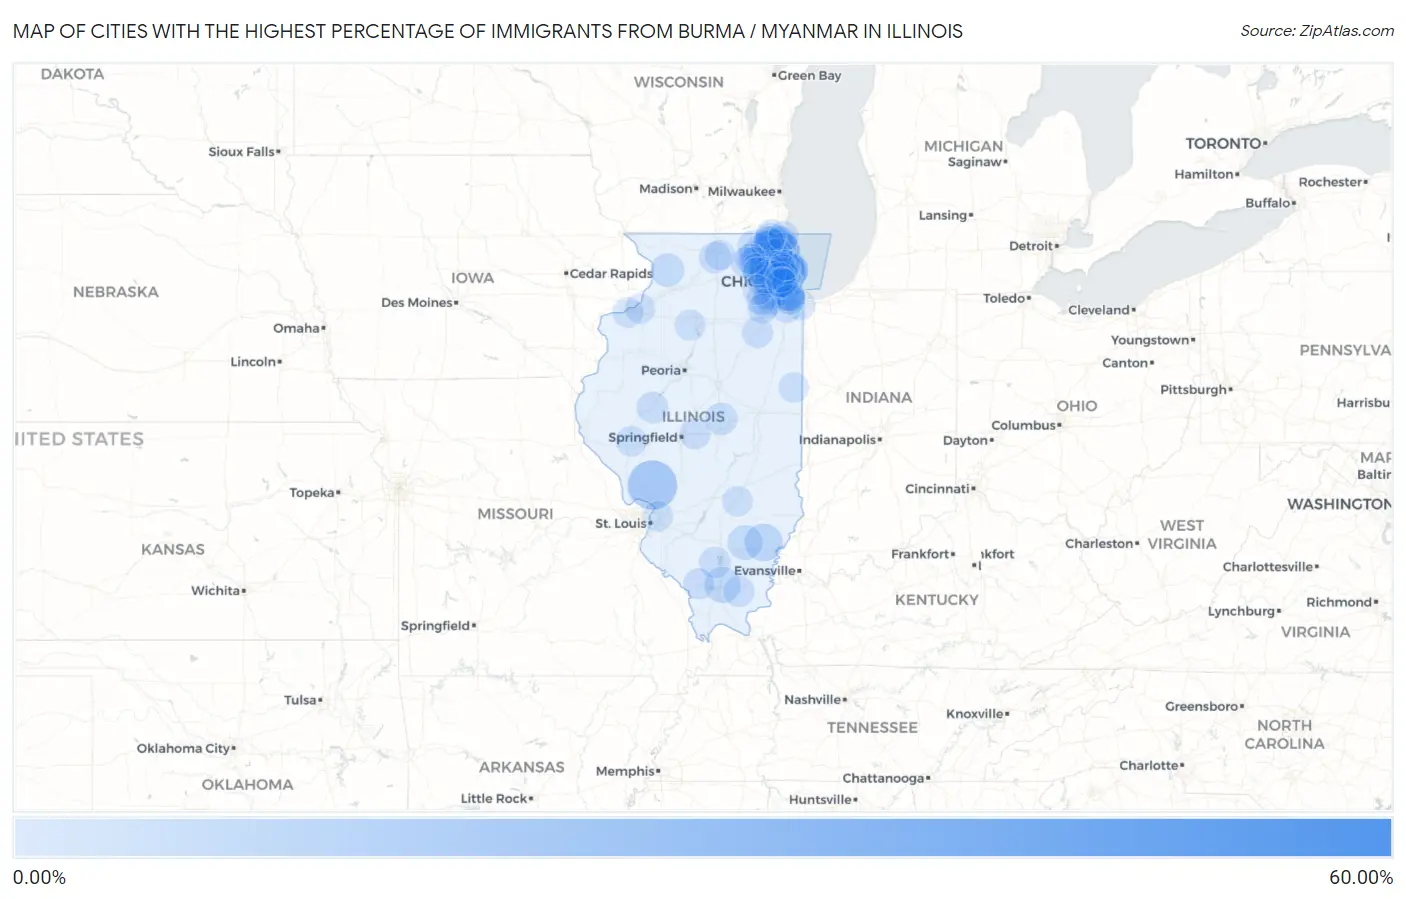
Map of Cities with the Highest Percentage of Immigrants from Burma / Myanmar in Illinois
0.00%
1.50%
Cities with the Highest Percentage of Immigrants from Burma / Myanmar in Illinois
| City | Burma / Myanmar | vs State | vs National | |
| 1. | East Moline | 1.47% | 0.036%(+1.43)#86 | 0.047%(+1.42)#2,037 |
| 2. | Wheaton | 1.20% | 0.036%(+1.16)#87 | 0.047%(+1.15)#2,038 |
| 3. | Rock Island | 0.94% | 0.036%(+0.904)#88 | 0.047%(+0.892)#2,039 |
| 4. | Glen Ellyn | 0.84% | 0.036%(+0.809)#125 | 0.047%(+0.797)#2,823 |
| 5. | Monmouth | 0.75% | 0.036%(+0.717)#180 | 0.047%(+0.706)#3,903 |
| 6. | Beardstown | 0.70% | 0.036%(+0.661)#181 | 0.047%(+0.649)#3,904 |
| 7. | Glendale Heights | 0.57% | 0.036%(+0.529)#182 | 0.047%(+0.518)#3,905 |
| 8. | Carrier Mills | 0.34% | 0.036%(+0.305)#183 | 0.047%(+0.294)#3,906 |
| 9. | Carol Stream | 0.33% | 0.036%(+0.295)#184 | 0.047%(+0.283)#3,907 |
| 10. | Bowen | 0.28% | 0.036%(+0.246)#382 | 0.047%(+0.234)#7,793 |
| 11. | Swansea | 0.28% | 0.036%(+0.240)#383 | 0.047%(+0.228)#7,794 |
| 12. | Bloomington | 0.24% | 0.036%(+0.208)#384 | 0.047%(+0.196)#7,795 |
| 13. | Lake In The Hills | 0.19% | 0.036%(+0.151)#385 | 0.047%(+0.139)#7,796 |
| 14. | Mount Prospect | 0.18% | 0.036%(+0.146)#386 | 0.047%(+0.134)#7,797 |
| 15. | Highland | 0.18% | 0.036%(+0.141)#387 | 0.047%(+0.129)#7,798 |
| 16. | Rockford | 0.17% | 0.036%(+0.136)#388 | 0.047%(+0.125)#7,799 |
| 17. | Moline | 0.17% | 0.036%(+0.136)#389 | 0.047%(+0.125)#7,800 |
| 18. | Naperville | 0.15% | 0.036%(+0.116)#390 | 0.047%(+0.104)#7,801 |
| 19. | Calumet City | 0.12% | 0.036%(+0.088)#409 | 0.047%(+0.076)#8,207 |
| 20. | Burr Ridge | 0.12% | 0.036%(+0.081)#410 | 0.047%(+0.069)#8,208 |
| 21. | Carbondale | 0.11% | 0.036%(+0.073)#411 | 0.047%(+0.061)#8,209 |
| 22. | Cicero | 0.11% | 0.036%(+0.071)#412 | 0.047%(+0.059)#8,210 |
| 23. | Morton Grove | 0.10% | 0.036%(+0.069)#413 | 0.047%(+0.057)#8,211 |
| 24. | Aurora | 0.093% | 0.036%(+0.057)#414 | 0.047%(+0.045)#8,212 |
| 25. | East Peoria | 0.084% | 0.036%(+0.049)#415 | 0.047%(+0.037)#8,213 |
| 26. | West Chicago | 0.070% | 0.036%(+0.035)#416 | 0.047%(+0.023)#8,214 |
| 27. | Dekalb | 0.059% | 0.036%(+0.023)#417 | 0.047%(+0.012)#8,215 |
| 28. | Glenview | 0.054% | 0.036%(+0.019)#418 | 0.047%(+0.007)#8,216 |
| 29. | Lisle | 0.047% | 0.036%(+0.011)#419 | 0.047%(-0.001)#8,217 |
| 30. | Hoffman Estates | 0.044% | 0.036%(+0.009)#420 | 0.047%(-0.003)#8,218 |
| 31. | Hanover Park | 0.035% | 0.036%(-0.001)#421 | 0.047%(-0.012)#8,219 |
| 32. | Palatine | 0.033% | 0.036%(-0.003)#422 | 0.047%(-0.015)#8,220 |
| 33. | Wheeling | 0.031% | 0.036%(-0.005)#423 | 0.047%(-0.017)#8,221 |
| 34. | Des Plaines | 0.030% | 0.036%(-0.006)#424 | 0.047%(-0.017)#8,222 |
| 35. | Springfield | 0.030% | 0.036%(-0.006)#425 | 0.047%(-0.018)#8,223 |
| 36. | Chicago | 0.030% | 0.036%(-0.006)#426 | 0.047%(-0.018)#8,224 |
| 37. | Sterling | 0.027% | 0.036%(-0.009)#427 | 0.047%(-0.020)#8,225 |
| 38. | Elgin | 0.026% | 0.036%(-0.009)#428 | 0.047%(-0.021)#8,226 |
| 39. | Addison | 0.025% | 0.036%(-0.010)#429 | 0.047%(-0.022)#8,227 |
| 40. | Tinley Park | 0.025% | 0.036%(-0.010)#430 | 0.047%(-0.022)#8,228 |
| 41. | Hometown | 0.023% | 0.036%(-0.012)#431 | 0.047%(-0.024)#8,229 |
| 42. | Bartlett | 0.022% | 0.036%(-0.014)#432 | 0.047%(-0.025)#8,230 |
| 43. | Buffalo Grove | 0.021% | 0.036%(-0.015)#433 | 0.047%(-0.026)#8,231 |
| 44. | Skokie | 0.019% | 0.036%(-0.016)#434 | 0.047%(-0.028)#8,232 |
| 45. | Arlington Heights | 0.013% | 0.036%(-0.023)#435 | 0.047%(-0.034)#8,233 |
| 46. | Joliet | 0.0100% | 0.036%(-0.026)#436 | 0.047%(-0.037)#8,234 |
| 47. | Evanston | 0.0078% | 0.036%(-0.028)#437 | 0.047%(-0.040)#8,235 |
| 48. | Westmont | 0.0041% | 0.036%(-0.032)#438 | 0.047%(-0.043)#8,236 |
| 49. | Champaign | 0.0023% | 0.036%(-0.033)#439 | 0.047%(-0.045)#8,237 |
Common Questions
What are the Top 10 Cities with the Highest Percentage of Immigrants from Burma / Myanmar in Illinois?
Top 10 Cities with the Highest Percentage of Immigrants from Burma / Myanmar in Illinois are:
#1
1.47%
#2
1.20%
#3
0.94%
#4
0.84%
#5
0.75%
#6
0.70%
#7
0.57%
#8
0.34%
#9
0.33%
#10
0.28%
What city has the Highest Percentage of Immigrants from Burma / Myanmar in Illinois?
East Moline has the Highest Percentage of Immigrants from Burma / Myanmar in Illinois with 1.47%.
What is the Percentage of Immigrants from Burma / Myanmar in the State of Illinois?
Percentage of Immigrants from Burma / Myanmar in Illinois is 0.036%.
What is the Percentage of Immigrants from Burma / Myanmar in the United States?
Percentage of Immigrants from Burma / Myanmar in the United States is 0.047%.