Cities with the Highest Percentage of Immigrants from Burma / Myanmar in Indiana

RELATED REPORTS & OPTIONS

Burma / Myanmar
Population
Families and Households
Female Fertility
Female Fertility (Unmarried)
Race (Community Size)
Race (Percentage)
Ancestry (Community Size)
AfghanAfricanAlaska NativeAlaskan AthabascanAlbanianAleutAlsatianAmericanApacheArabArapahoArgentineanArmenianAssyrian / Chaldean / SyriacAustralianAustrianBahamianBangladeshiBarbadianBasqueBelgianBelizeanBermudanBhutaneseBlackfeetBolivianBrazilianBritishBritish West IndianBulgarianBurmeseCajunCambodianCanadianCape VerdeanCarpatho RusynCelticCentral AmericanCentral American IndianCherokeeCheyenneChickasawChileanChineseChippewaChoctawColombianColvilleComancheCosta RicanCreeCreekCroatianCrowCubanCypriotCzechCzechoslovakianDanishDelawareDominicanDutchDutch West IndianEastern EuropeanEcuadorianEgyptianEnglishEstonianEthiopianEuropeanFijianFilipinoFinnishFrenchFrench American IndianFrench CanadianGermanGerman RussianGhanaianGreekGuamanian / ChamorroGuatemalanGuyaneseHaitianHmongHonduranHopiHoumaHungarianIcelanderIndian (Asian)IndonesianInupiatIranianIraqiIrishIroquoisIsraeliItalianJamaicanJapaneseJordanianKenyanKiowaKoreanLaotianLatvianLebaneseLiberianLithuanianLumbeeLuxembourgerMacedonianMalaysianMalteseMarshalleseMenomineeMexicanMexican American IndianMongolianMoroccanNative HawaiianNavajoNepaleseNew ZealanderNicaraguanNigerianNorthern EuropeanNorwegianOkinawanOsageOttawaPaiutePakistaniPalestinianPanamanianParaguayanPennsylvania GermanPeruvianPimaPolishPortuguesePotawatomiPuebloPuerto RicanPuget Sound SalishRomanianRussianSalvadoranSamoanScandinavianScotch-IrishScottishSeminoleSenegaleseSerbianShoshoneSierra LeoneanSiouxSlavicSlovakSloveneSomaliSouth AfricanSouth AmericanSouth American IndianSoviet UnionSpaniardSpanishSpanish AmericanSpanish American IndianSri LankanSubsaharan AfricanSudaneseSwedishSwissSyrianTaiwaneseThaiTlingit-HaidaTohono O'OdhamTonganTrinidadian and TobagonianTsimshianTurkishU.S. Virgin IslanderUgandanUkrainianUruguayanUteVenezuelanVietnameseWelshWest IndianYakamaYaquiYugoslavianYumanYup'ikZimbabwean
Ancestry (Percentage)
AfghanAfricanAlaska NativeAlaskan AthabascanAlbanianAleutAlsatianAmericanApacheArabArapahoArgentineanArmenianAssyrian / Chaldean / SyriacAustralianAustrianBahamianBangladeshiBarbadianBasqueBelgianBelizeanBermudanBhutaneseBlackfeetBolivianBrazilianBritishBritish West IndianBulgarianBurmeseCajunCambodianCanadianCape VerdeanCarpatho RusynCelticCentral AmericanCentral American IndianCherokeeCheyenneChickasawChileanChineseChippewaChoctawColombianColvilleComancheCosta RicanCreeCreekCroatianCrowCubanCypriotCzechCzechoslovakianDanishDelawareDominicanDutchDutch West IndianEastern EuropeanEcuadorianEgyptianEnglishEstonianEthiopianEuropeanFijianFilipinoFinnishFrenchFrench American IndianFrench CanadianGermanGerman RussianGhanaianGreekGuamanian / ChamorroGuatemalanGuyaneseHaitianHmongHonduranHopiHoumaHungarianIcelanderIndian (Asian)IndonesianInupiatIranianIraqiIrishIroquoisIsraeliItalianJamaicanJapaneseJordanianKenyanKiowaKoreanLaotianLatvianLebaneseLiberianLithuanianLumbeeLuxembourgerMacedonianMalaysianMalteseMarshalleseMenomineeMexicanMexican American IndianMongolianMoroccanNative HawaiianNavajoNepaleseNew ZealanderNicaraguanNigerianNorthern EuropeanNorwegianOkinawanOsageOttawaPaiutePakistaniPalestinianPanamanianParaguayanPennsylvania GermanPeruvianPimaPolishPortuguesePotawatomiPuebloPuerto RicanPuget Sound SalishRomanianRussianSalvadoranSamoanScandinavianScotch-IrishScottishSeminoleSenegaleseSerbianShoshoneSierra LeoneanSiouxSlavicSlovakSloveneSomaliSouth AfricanSouth AmericanSouth American IndianSoviet UnionSpaniardSpanishSpanish AmericanSpanish American IndianSri LankanSubsaharan AfricanSudaneseSwedishSwissSyrianTaiwaneseThaiTlingit-HaidaTohono O'OdhamTonganTrinidadian and TobagonianTsimshianTurkishU.S. Virgin IslanderUgandanUkrainianUruguayanUteVenezuelanVietnameseWelshWest IndianYakamaYaquiYugoslavianYumanYup'ikZimbabwean
Immigrant Origin (Total)
AfghanistanAfricaAlbaniaArgentinaArmeniaAsiaAustraliaAustriaAzoresBahamasBangladeshBarbadosBelarusBelgiumBelizeBoliviaBosnia and HerzegovinaBrazilBulgariaBurma / MyanmarCabo VerdeCambodiaCameroonCanadaCaribbeanCentral AmericaChileChinaColombiaCongoCosta RicaCroatiaCubaCzechoslovakiaDenmarkDominicaDominican RepublicEastern AfricaEastern AsiaEastern EuropeEcuadorEgyptEl SalvadorEnglandEritreaEthiopiaEuropeFijiFranceGermanyGhanaGreeceGrenadaGuatemalaGuyanaHaitiHondurasHong KongHungaryIndiaIndonesiaIranIraqIrelandIsraelItalyJamaicaJapanJordanKazakhstanKenyaKoreaKuwaitLaosLatin AmericaLatviaLebanonLiberiaLithuaniaMalaysiaMexicoMicronesiaMiddle AfricaMoldovaMoroccoNepalNetherlandsNicaraguaNigeriaNorth MacedoniaNorthern AfricaNorthern EuropeNorwayOceaniaPakistanPanamaPeruPhilippinesPolandPortugalRomaniaRussiaSaudi ArabiaScotlandSenegalSerbiaSierra LeoneSingaporeSomaliaSouth AfricaSouth AmericaSouth Central AsiaSouth Eastern AsiaSouthern EuropeSpainSri LankaSt. Vincent and the GrenadinesSudanSwedenSwitzerlandSyriaTaiwanThailandTrinidad and TobagoTurkeyUgandaUkraineUruguayUzbekistanVenezuelaVietnamWest IndiesWestern AfricaWestern AsiaWestern EuropeYemenZaireZimbabwe
Immigrant Origin (Percentage)
AfghanistanAfricaAlbaniaArgentinaArmeniaAsiaAustraliaAustriaAzoresBahamasBangladeshBarbadosBelarusBelgiumBelizeBoliviaBosnia and HerzegovinaBrazilBulgariaBurma / MyanmarCabo VerdeCambodiaCameroonCanadaCaribbeanCentral AmericaChileChinaColombiaCongoCosta RicaCroatiaCubaCzechoslovakiaDenmarkDominicaDominican RepublicEastern AfricaEastern AsiaEastern EuropeEcuadorEgyptEl SalvadorEnglandEritreaEthiopiaEuropeFijiFranceGermanyGhanaGreeceGrenadaGuatemalaGuyanaHaitiHondurasHong KongHungaryIndiaIndonesiaIranIraqIrelandIsraelItalyJamaicaJapanJordanKazakhstanKenyaKoreaKuwaitLaosLatin AmericaLatviaLebanonLiberiaLithuaniaMalaysiaMexicoMicronesiaMiddle AfricaMoldovaMoroccoNepalNetherlandsNicaraguaNigeriaNorth MacedoniaNorthern AfricaNorthern EuropeNorwayOceaniaPakistanPanamaPeruPhilippinesPolandPortugalRomaniaRussiaSaudi ArabiaScotlandSenegalSerbiaSierra LeoneSingaporeSomaliaSouth AfricaSouth AmericaSouth Central AsiaSouth Eastern AsiaSouthern EuropeSpainSri LankaSt. Vincent and the GrenadinesSudanSwedenSwitzerlandSyriaTaiwanThailandTrinidad and TobagoTurkeyUgandaUkraineUruguayUzbekistanVenezuelaVietnamWest IndiesWestern AfricaWestern AsiaWestern EuropeYemenZaireZimbabwe
Income
Income (Families)
Income (Households)
Poverty
Poverty (Families)
Unemployment
Employment Occupations
Employment Industries
Employer Class
Commute Time
Commute Means
School Enrollment
Education by Degree Field
Occupancy
Finances
Physical Characteristics
Indiana
Compare Cities
Comparison Subject

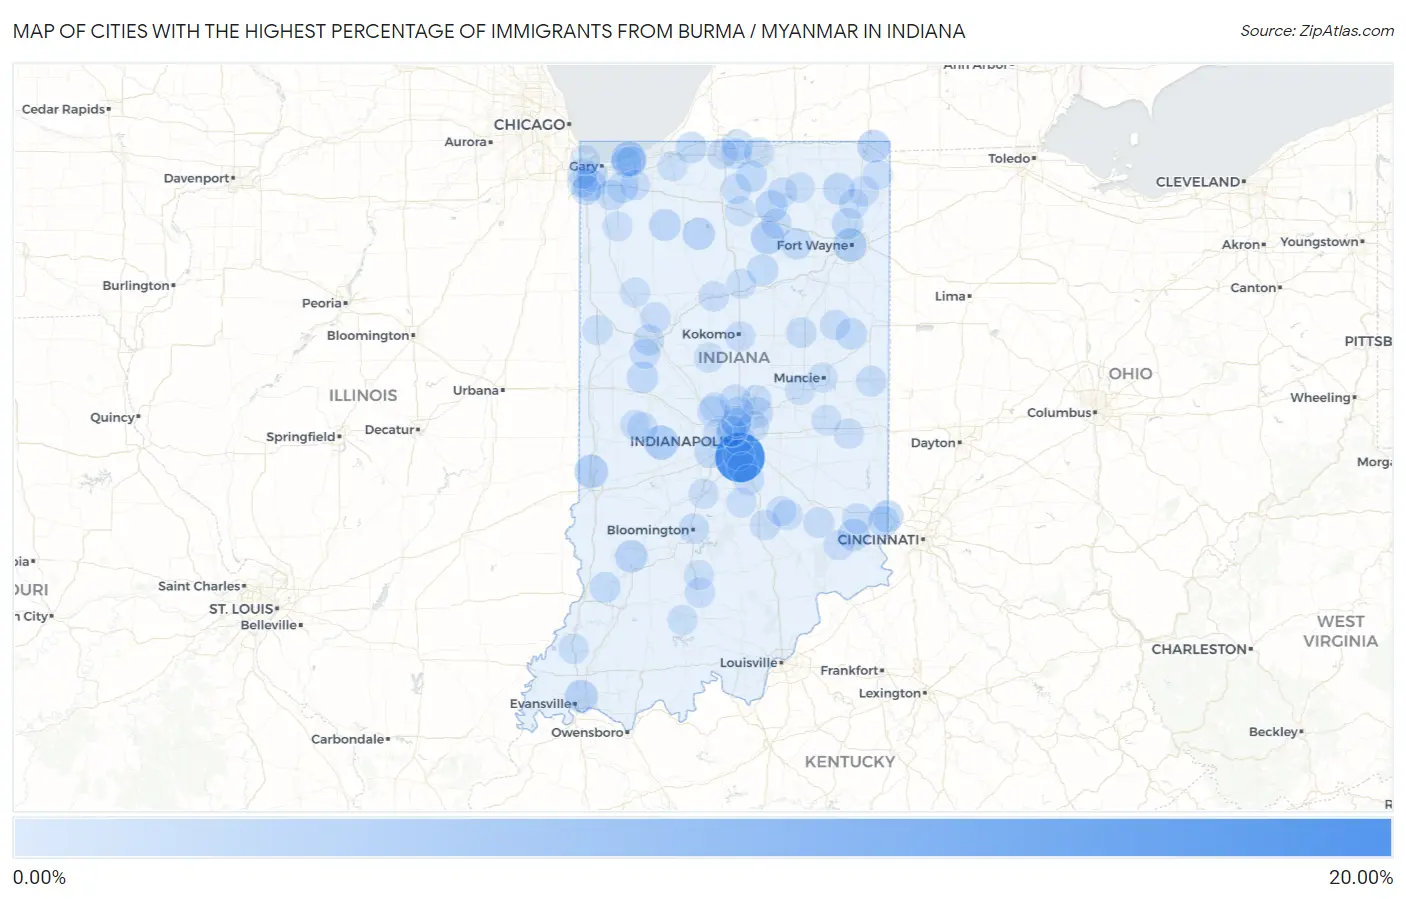
Map of Cities with the Highest Percentage of Immigrants from Burma / Myanmar in Indiana

0.00%
20.00%
Cities with the Highest Percentage of Immigrants from Burma / Myanmar in Indiana Map

Cities with the Highest Percentage of Immigrants from Burma / Myanmar in Indiana

City Burma / Myanmar vs State vs National
1.Southport17.43%0.24%(+17.2)#10.047%(+17.4)#53
2.Claypool3.44%0.24%(+3.20)#70.047%(+3.39)#828
3.Leesburg2.44%0.24%(+2.20)#120.047%(+2.39)#1,376
4.Lyons1.87%0.24%(+1.63)#130.047%(+1.82)#1,377
5.Melody Hill1.74%0.24%(+1.50)#140.047%(+1.69)#1,378
6.Fort Wayne1.63%0.24%(+1.39)#150.047%(+1.59)#1,379
7.Shorewood Forest1.56%0.24%(+1.32)#260.047%(+1.51)#2,351
8.Sunman1.09%0.24%(+0.852)#380.047%(+1.04)#3,362
9.Homecroft1.09%0.24%(+0.845)#400.047%(+1.04)#3,385
10.Indianapolis1.08%0.24%(+0.837)#410.047%(+1.03)#3,386
11.Griffith0.92%0.24%(+0.681)#420.047%(+0.873)#3,387
12.Wynnedale0.92%0.24%(+0.677)#460.047%(+0.870)#3,935
13.Granger0.63%0.24%(+0.393)#470.047%(+0.586)#3,936
14.West Harrison0.62%0.24%(+0.381)#480.047%(+0.574)#3,937
15.Gas City0.56%0.24%(+0.317)#490.047%(+0.510)#3,938
16.Syracuse0.49%0.24%(+0.247)#870.047%(+0.439)#6,182
17.Greenwood0.40%0.24%(+0.158)#880.047%(+0.351)#6,183
18.Huntertown0.37%0.24%(+0.134)#890.047%(+0.327)#6,184
19.Princeton0.37%0.24%(+0.131)#900.047%(+0.324)#6,185
20.Frankfort0.37%0.24%(+0.129)#1100.047%(+0.322)#7,042
21.Portland0.34%0.24%(+0.102)#1180.047%(+0.295)#7,285
22.Oakland City0.25%0.24%(+0.008)#1350.047%(+0.200)#8,111
23.Larwill0.25%0.24%(+0.007)#1370.047%(+0.199)#8,124
24.Mishawaka0.18%0.24%(-0.055)#1380.047%(+0.137)#8,125
25.North Manchester0.18%0.24%(-0.061)#1560.047%(+0.132)#8,748
26.New Haven0.16%0.24%(-0.079)#1570.047%(+0.113)#8,749
27.Fishers0.15%0.24%(-0.087)#1580.047%(+0.106)#8,750
28.Greenfield0.15%0.24%(-0.088)#1590.047%(+0.105)#8,751
29.Plainfield0.15%0.24%(-0.095)#1600.047%(+0.098)#8,752
30.Zionsville0.14%0.24%(-0.104)#1610.047%(+0.089)#8,753
31.Monrovia0.13%0.24%(-0.113)#1660.047%(+0.080)#9,250
32.New Castle0.13%0.24%(-0.114)#1670.047%(+0.079)#9,251
33.Columbus0.084%0.24%(-0.156)#1680.047%(+0.037)#9,252
34.Burns Harbor0.083%0.24%(-0.157)#1690.047%(+0.036)#9,253
35.Beech Grove0.079%0.24%(-0.161)#1700.047%(+0.032)#9,254
36.Upland0.076%0.24%(-0.164)#1710.047%(+0.028)#9,255
37.South Bend0.070%0.24%(-0.170)#1720.047%(+0.022)#9,256
38.Speedway0.066%0.24%(-0.174)#1730.047%(+0.019)#9,277
39.Notre Dame0.062%0.24%(-0.178)#1740.047%(+0.014)#9,278
40.Aurora0.061%0.24%(-0.180)#1820.047%(+0.013)#9,782
41.Angola0.043%0.24%(-0.197)#1830.047%(-0.004)#9,783
42.Bloomington0.022%0.24%(-0.219)#1840.047%(-0.026)#9,784
43.West Lafayette0.016%0.24%(-0.224)#1850.047%(-0.032)#9,785
44.Muncie0.012%0.24%(-0.228)#1860.047%(-0.035)#9,786
45.Richmond0.0084%0.24%(-0.232)#1870.047%(-0.039)#9,787

Common Questions

What are the Top 10 Cities with the Highest Percentage of Immigrants from Burma / Myanmar in Indiana?
Top 10 Cities with the Highest Percentage of Immigrants from Burma / Myanmar in Indiana are:
#1
17.43%
#2
3.44%
#3
2.44%
#4
1.87%
#5
1.74%
#6
1.63%
#7
1.56%
#8
1.09%
#9
1.09%
#10
1.08%
What city has the Highest Percentage of Immigrants from Burma / Myanmar in Indiana?
Southport has the Highest Percentage of Immigrants from Burma / Myanmar in Indiana with 17.43%.
What is the Percentage of Immigrants from Burma / Myanmar in the State of Indiana?
Percentage of Immigrants from Burma / Myanmar in Indiana is 0.24%.
What is the Percentage of Immigrants from Burma / Myanmar in the United States?
Percentage of Immigrants from Burma / Myanmar in the United States is 0.047%.