Zip Codes with the Highest Percentage of Immigrants from Burma / Myanmar in California
RELATED REPORTS & OPTIONS
Burma / Myanmar
California
Compare Zip Codes
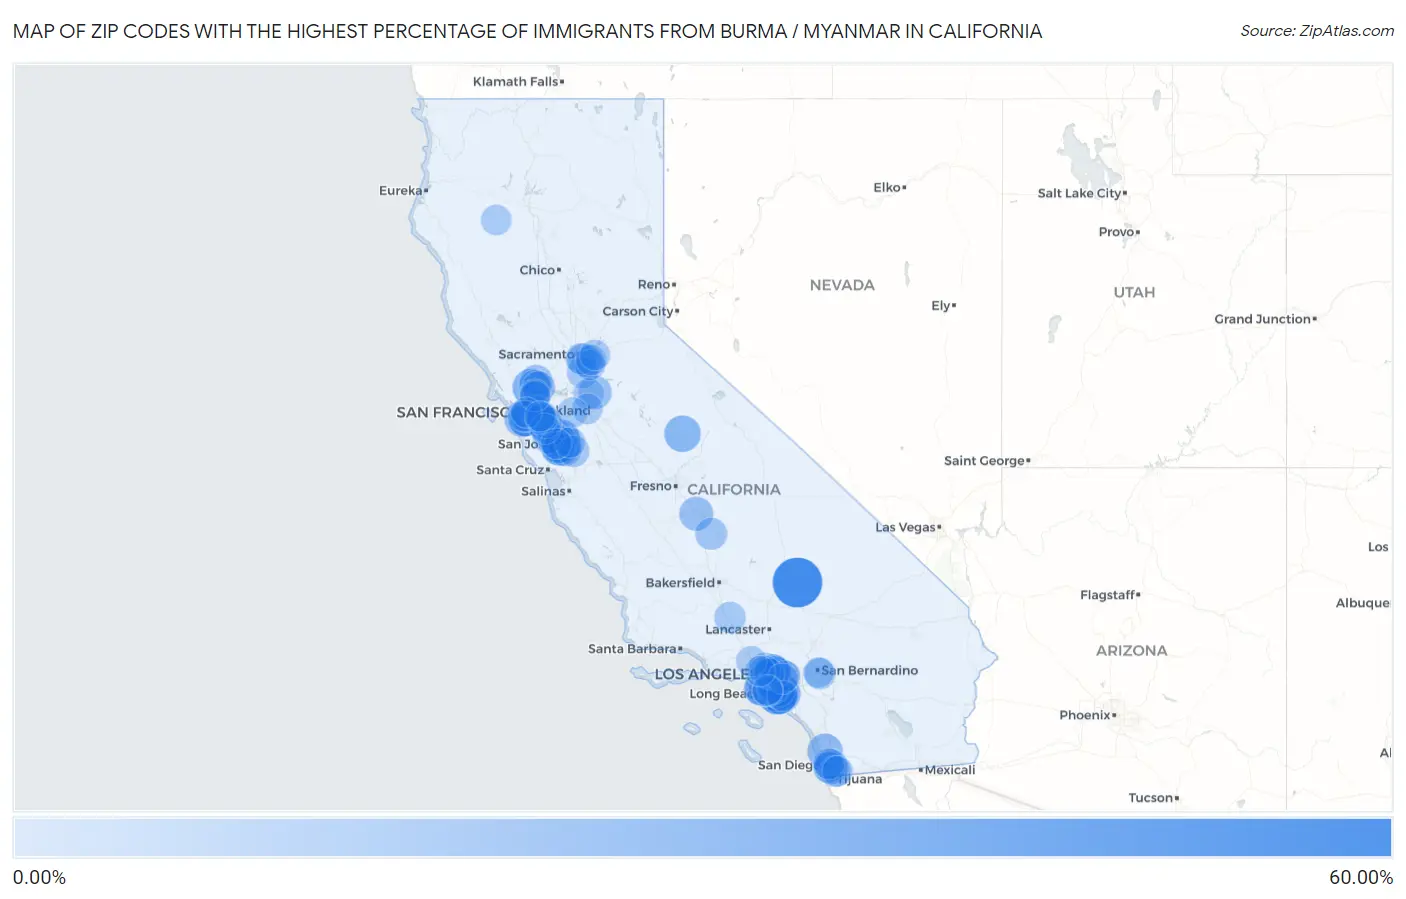
Map of Zip Codes with the Highest Percentage of Immigrants from Burma / Myanmar in California
0.00%
3.00%
Zip Codes with the Highest Percentage of Immigrants from Burma / Myanmar in California
| Zip Code | Burma / Myanmar | vs State | vs National | |
| 1. | 91916 | 2.84% | 0.072%(+2.77)#442 | 0.047%(+2.79)#1,193 |
| 2. | 94015 | 2.75% | 0.072%(+2.67)#443 | 0.047%(+2.70)#1,194 |
| 3. | 94132 | 1.62% | 0.072%(+1.55)#444 | 0.047%(+1.57)#1,195 |
| 4. | 91770 | 1.61% | 0.072%(+1.54)#445 | 0.047%(+1.57)#1,196 |
| 5. | 90505 | 1.49% | 0.072%(+1.41)#446 | 0.047%(+1.44)#1,197 |
| 6. | 94538 | 1.43% | 0.072%(+1.35)#447 | 0.047%(+1.38)#1,198 |
| 7. | 91006 | 1.16% | 0.072%(+1.09)#448 | 0.047%(+1.11)#1,199 |
| 8. | 90232 | 1.06% | 0.072%(+0.992)#449 | 0.047%(+1.02)#1,200 |
| 9. | 91755 | 1.04% | 0.072%(+0.973)#450 | 0.047%(+0.997)#1,201 |
| 10. | 94122 | 1.01% | 0.072%(+0.938)#451 | 0.047%(+0.962)#1,202 |
| 11. | 91776 | 1.01% | 0.072%(+0.935)#452 | 0.047%(+0.960)#1,203 |
| 12. | 94116 | 0.93% | 0.072%(+0.860)#453 | 0.047%(+0.884)#1,204 |
| 13. | 94005 | 0.93% | 0.072%(+0.854)#454 | 0.047%(+0.878)#1,205 |
| 14. | 91754 | 0.85% | 0.072%(+0.783)#455 | 0.047%(+0.807)#1,206 |
| 15. | 94536 | 0.78% | 0.072%(+0.709)#456 | 0.047%(+0.734)#1,207 |
| 16. | 91803 | 0.78% | 0.072%(+0.708)#457 | 0.047%(+0.732)#1,208 |
| 17. | 91765 | 0.77% | 0.072%(+0.697)#458 | 0.047%(+0.721)#1,209 |
| 18. | 94014 | 0.76% | 0.072%(+0.692)#459 | 0.047%(+0.717)#1,210 |
| 19. | 94555 | 0.75% | 0.072%(+0.680)#460 | 0.047%(+0.704)#1,211 |
| 20. | 91791 | 0.74% | 0.072%(+0.666)#461 | 0.047%(+0.690)#1,212 |
| 21. | 91775 | 0.72% | 0.072%(+0.644)#462 | 0.047%(+0.668)#1,213 |
| 22. | 91007 | 0.71% | 0.072%(+0.636)#463 | 0.047%(+0.660)#1,214 |
| 23. | 94080 | 0.70% | 0.072%(+0.627)#464 | 0.047%(+0.651)#1,215 |
| 24. | 94112 | 0.67% | 0.072%(+0.599)#465 | 0.047%(+0.623)#1,216 |
| 25. | 94552 | 0.66% | 0.072%(+0.584)#466 | 0.047%(+0.608)#1,217 |
| 26. | 94030 | 0.64% | 0.072%(+0.572)#467 | 0.047%(+0.597)#1,218 |
| 27. | 94587 | 0.64% | 0.072%(+0.567)#468 | 0.047%(+0.591)#1,219 |
| 28. | 91790 | 0.58% | 0.072%(+0.508)#469 | 0.047%(+0.532)#1,220 |
| 29. | 91706 | 0.58% | 0.072%(+0.506)#470 | 0.047%(+0.531)#1,221 |
| 30. | 94403 | 0.55% | 0.072%(+0.478)#471 | 0.047%(+0.502)#1,222 |
| 31. | 90031 | 0.54% | 0.072%(+0.470)#472 | 0.047%(+0.495)#1,223 |
| 32. | 91723 | 0.53% | 0.072%(+0.457)#473 | 0.047%(+0.481)#1,224 |
| 33. | 91801 | 0.52% | 0.072%(+0.450)#474 | 0.047%(+0.474)#1,225 |
| 34. | 95330 | 0.52% | 0.072%(+0.448)#475 | 0.047%(+0.472)#1,226 |
| 35. | 90260 | 0.52% | 0.072%(+0.445)#476 | 0.047%(+0.469)#1,227 |
| 36. | 95219 | 0.51% | 0.072%(+0.439)#477 | 0.047%(+0.463)#1,228 |
| 37. | 92135 | 0.46% | 0.072%(+0.385)#801 | 0.047%(+0.409)#3,056 |
| 38. | 93106 | 0.45% | 0.072%(+0.375)#802 | 0.047%(+0.400)#3,057 |
| 39. | 91108 | 0.45% | 0.072%(+0.374)#803 | 0.047%(+0.398)#3,058 |
| 40. | 95822 | 0.44% | 0.072%(+0.372)#804 | 0.047%(+0.396)#3,059 |
| 41. | 92610 | 0.43% | 0.072%(+0.356)#805 | 0.047%(+0.380)#3,060 |
| 42. | 94134 | 0.43% | 0.072%(+0.356)#806 | 0.047%(+0.380)#3,061 |
| 43. | 94109 | 0.42% | 0.072%(+0.349)#807 | 0.047%(+0.373)#3,062 |
| 44. | 94044 | 0.42% | 0.072%(+0.349)#808 | 0.047%(+0.373)#3,063 |
| 45. | 91008 | 0.40% | 0.072%(+0.332)#809 | 0.047%(+0.356)#3,064 |
| 46. | 91748 | 0.39% | 0.072%(+0.323)#810 | 0.047%(+0.347)#3,065 |
| 47. | 91732 | 0.39% | 0.072%(+0.316)#811 | 0.047%(+0.340)#3,066 |
| 48. | 91789 | 0.39% | 0.072%(+0.315)#812 | 0.047%(+0.339)#3,067 |
| 49. | 91780 | 0.39% | 0.072%(+0.314)#813 | 0.047%(+0.338)#3,068 |
| 50. | 94118 | 0.38% | 0.072%(+0.310)#814 | 0.047%(+0.334)#3,069 |
| 51. | 95128 | 0.34% | 0.072%(+0.273)#815 | 0.047%(+0.297)#3,070 |
| 52. | 91731 | 0.34% | 0.072%(+0.272)#816 | 0.047%(+0.297)#3,071 |
| 53. | 94063 | 0.34% | 0.072%(+0.265)#817 | 0.047%(+0.289)#3,072 |
| 54. | 95035 | 0.34% | 0.072%(+0.263)#818 | 0.047%(+0.288)#3,073 |
| 55. | 94124 | 0.33% | 0.072%(+0.258)#819 | 0.047%(+0.282)#3,074 |
| 56. | 94089 | 0.32% | 0.072%(+0.248)#820 | 0.047%(+0.272)#3,075 |
| 57. | 95148 | 0.32% | 0.072%(+0.246)#821 | 0.047%(+0.270)#3,076 |
| 58. | 95953 | 0.31% | 0.072%(+0.241)#986 | 0.047%(+0.265)#4,909 |
| 59. | 94577 | 0.31% | 0.072%(+0.239)#987 | 0.047%(+0.263)#4,910 |
| 60. | 92115 | 0.31% | 0.072%(+0.238)#988 | 0.047%(+0.262)#4,911 |
| 61. | 93726 | 0.31% | 0.072%(+0.237)#989 | 0.047%(+0.261)#4,912 |
| 62. | 91724 | 0.30% | 0.072%(+0.233)#990 | 0.047%(+0.257)#4,913 |
| 63. | 91722 | 0.30% | 0.072%(+0.224)#991 | 0.047%(+0.248)#4,914 |
| 64. | 92055 | 0.29% | 0.072%(+0.220)#992 | 0.047%(+0.245)#4,915 |
| 65. | 94010 | 0.29% | 0.072%(+0.214)#993 | 0.047%(+0.238)#4,916 |
| 66. | 94544 | 0.28% | 0.072%(+0.212)#994 | 0.047%(+0.236)#4,917 |
| 67. | 91377 | 0.28% | 0.072%(+0.207)#1,060 | 0.047%(+0.231)#5,998 |
| 68. | 92782 | 0.27% | 0.072%(+0.203)#1,061 | 0.047%(+0.227)#5,999 |
| 69. | 91786 | 0.27% | 0.072%(+0.201)#1,062 | 0.047%(+0.226)#6,000 |
| 70. | 94517 | 0.27% | 0.072%(+0.196)#1,063 | 0.047%(+0.220)#6,001 |
| 71. | 90640 | 0.26% | 0.072%(+0.192)#1,064 | 0.047%(+0.216)#6,002 |
| 72. | 93065 | 0.26% | 0.072%(+0.189)#1,065 | 0.047%(+0.213)#6,003 |
| 73. | 94602 | 0.25% | 0.072%(+0.179)#1,066 | 0.047%(+0.203)#6,004 |
| 74. | 95133 | 0.25% | 0.072%(+0.179)#1,067 | 0.047%(+0.203)#6,005 |
| 75. | 94525 | 0.25% | 0.072%(+0.178)#1,068 | 0.047%(+0.203)#6,006 |
| 76. | 95131 | 0.25% | 0.072%(+0.177)#1,069 | 0.047%(+0.202)#6,007 |
| 77. | 94601 | 0.24% | 0.072%(+0.166)#1,070 | 0.047%(+0.191)#6,008 |
| 78. | 91604 | 0.23% | 0.072%(+0.162)#1,071 | 0.047%(+0.186)#6,009 |
| 79. | 94531 | 0.23% | 0.072%(+0.162)#1,072 | 0.047%(+0.186)#6,010 |
| 80. | 94547 | 0.23% | 0.072%(+0.155)#1,073 | 0.047%(+0.179)#6,011 |
| 81. | 95758 | 0.22% | 0.072%(+0.148)#1,074 | 0.047%(+0.172)#6,012 |
| 82. | 95051 | 0.22% | 0.072%(+0.147)#1,075 | 0.047%(+0.171)#6,013 |
| 83. | 94519 | 0.21% | 0.072%(+0.142)#1,076 | 0.047%(+0.166)#6,014 |
| 84. | 95661 | 0.21% | 0.072%(+0.142)#1,077 | 0.047%(+0.166)#6,015 |
| 85. | 90039 | 0.21% | 0.072%(+0.141)#1,078 | 0.047%(+0.165)#6,016 |
| 86. | 95132 | 0.21% | 0.072%(+0.141)#1,079 | 0.047%(+0.165)#6,017 |
| 87. | 93737 | 0.21% | 0.072%(+0.140)#1,080 | 0.047%(+0.164)#6,018 |
| 88. | 92602 | 0.21% | 0.072%(+0.138)#1,081 | 0.047%(+0.163)#6,019 |
| 89. | 91764 | 0.21% | 0.072%(+0.136)#1,082 | 0.047%(+0.160)#6,020 |
| 90. | 90746 | 0.21% | 0.072%(+0.135)#1,083 | 0.047%(+0.159)#6,021 |
| 91. | 95834 | 0.20% | 0.072%(+0.129)#1,084 | 0.047%(+0.153)#6,022 |
| 92. | 91302 | 0.20% | 0.072%(+0.126)#1,085 | 0.047%(+0.150)#6,023 |
| 93. | 95212 | 0.20% | 0.072%(+0.126)#1,086 | 0.047%(+0.150)#6,024 |
| 94. | 91737 | 0.19% | 0.072%(+0.123)#1,087 | 0.047%(+0.147)#6,025 |
| 95. | 94115 | 0.19% | 0.072%(+0.121)#1,088 | 0.047%(+0.145)#6,026 |
| 96. | 90089 | 0.19% | 0.072%(+0.121)#1,115 | 0.047%(+0.145)#6,899 |
| 97. | 92105 | 0.19% | 0.072%(+0.120)#1,116 | 0.047%(+0.144)#6,900 |
| 98. | 90631 | 0.19% | 0.072%(+0.118)#1,117 | 0.047%(+0.142)#6,901 |
| 99. | 91745 | 0.19% | 0.072%(+0.118)#1,118 | 0.047%(+0.142)#6,902 |
| 100. | 95121 | 0.19% | 0.072%(+0.114)#1,119 | 0.047%(+0.138)#6,903 |
Common Questions
What are the Top 10 Zip Codes with the Highest Percentage of Immigrants from Burma / Myanmar in California?
Top 10 Zip Codes with the Highest Percentage of Immigrants from Burma / Myanmar in California are:
What zip code has the Highest Percentage of Immigrants from Burma / Myanmar in California?
91916 has the Highest Percentage of Immigrants from Burma / Myanmar in California with 2.84%.
What is the Percentage of Immigrants from Burma / Myanmar in the State of California?
Percentage of Immigrants from Burma / Myanmar in California is 0.072%.
What is the Percentage of Immigrants from Burma / Myanmar in the United States?
Percentage of Immigrants from Burma / Myanmar in the United States is 0.047%.