Cities with the Highest Percentage of Population Employed in Construction in Ohio
RELATED REPORTS & OPTIONS
Construction
Ohio
Compare Cities
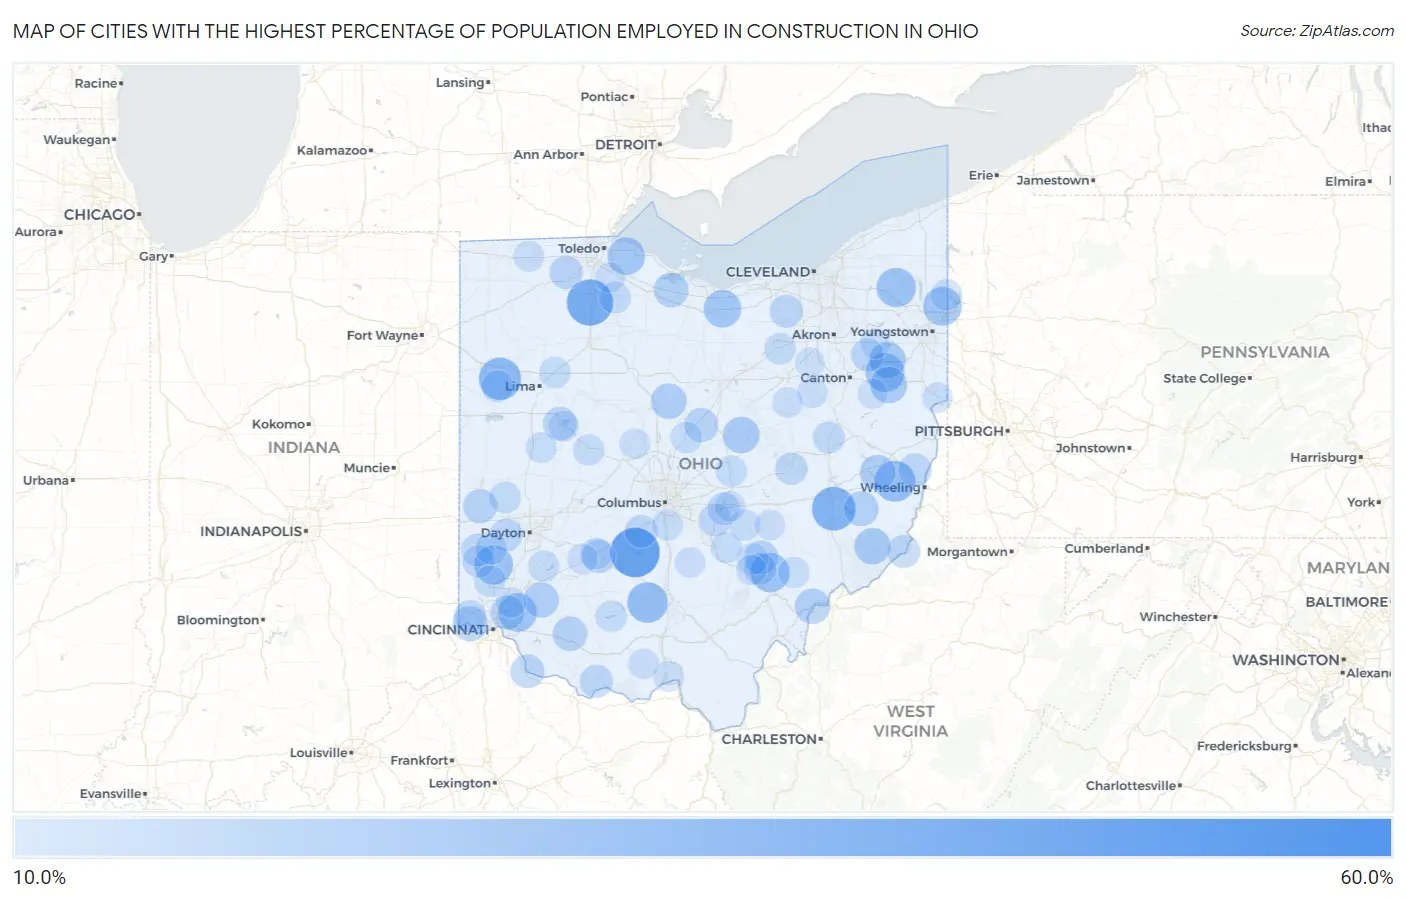
Map of Cities with the Highest Percentage of Population Employed in Construction in Ohio
0.0%
60.0%
Cities with the Highest Percentage of Population Employed in Construction in Ohio
| City | % Employed | vs State | vs National | |
| 1. | Jacksontown | 59.8% | 5.8%(+54.0)#1 | 6.9%(+52.9)#135 |
| 2. | Pancoastburg | 50.0% | 5.8%(+44.2)#2 | 6.9%(+43.1)#218 |
| 3. | Rudolph | 44.0% | 5.8%(+38.2)#3 | 6.9%(+37.2)#290 |
| 4. | Buffalo | 39.5% | 5.8%(+33.6)#4 | 6.9%(+32.6)#373 |
| 5. | New Haven Cdp Hamilton County | 39.4% | 5.8%(+33.5)#5 | 6.9%(+32.5)#374 |
| 6. | Venedocia | 36.5% | 5.8%(+30.7)#6 | 6.9%(+29.7)#467 |
| 7. | Bannock | 34.0% | 5.8%(+28.2)#7 | 6.9%(+27.1)#549 |
| 8. | Sullivan | 33.7% | 5.8%(+27.8)#8 | 6.9%(+26.8)#561 |
| 9. | Bourneville | 33.6% | 5.8%(+27.8)#9 | 6.9%(+26.8)#563 |
| 10. | West Farmington | 31.5% | 5.8%(+25.7)#10 | 6.9%(+24.6)#665 |
| 11. | Trimble | 31.3% | 5.8%(+25.5)#11 | 6.9%(+24.4)#675 |
| 12. | Jacksonburg | 30.8% | 5.8%(+24.9)#12 | 6.9%(+23.9)#704 |
| 13. | Homeworth | 30.5% | 5.8%(+24.7)#13 | 6.9%(+23.6)#716 |
| 14. | Yankee Lake | 30.3% | 5.8%(+24.5)#14 | 6.9%(+23.4)#728 |
| 15. | Miamiville | 30.2% | 5.8%(+24.3)#15 | 6.9%(+23.3)#735 |
| 16. | Collins | 28.5% | 5.8%(+22.7)#16 | 6.9%(+21.6)#846 |
| 17. | Williston | 28.3% | 5.8%(+22.4)#17 | 6.9%(+21.4)#862 |
| 18. | Howard | 26.6% | 5.8%(+20.7)#18 | 6.9%(+19.7)#1,005 |
| 19. | Maple Ridge | 26.4% | 5.8%(+20.6)#19 | 6.9%(+19.6)#1,012 |
| 20. | East Rochester | 26.3% | 5.8%(+20.5)#20 | 6.9%(+19.4)#1,021 |
| 21. | Graysville | 26.1% | 5.8%(+20.3)#21 | 6.9%(+19.2)#1,039 |
| 22. | Brunersburg | 25.8% | 5.8%(+19.9)#22 | 6.9%(+18.9)#1,060 |
| 23. | Caledonia | 24.7% | 5.8%(+18.9)#23 | 6.9%(+17.9)#1,159 |
| 24. | Holloway | 24.5% | 5.8%(+18.7)#24 | 6.9%(+17.6)#1,176 |
| 25. | Butlerville | 24.5% | 5.8%(+18.6)#25 | 6.9%(+17.6)#1,180 |
| 26. | Little Hocking | 24.4% | 5.8%(+18.6)#26 | 6.9%(+17.6)#1,186 |
| 27. | Gomer | 23.8% | 5.8%(+18.0)#27 | 6.9%(+16.9)#1,264 |
| 28. | Pekin | 23.8% | 5.8%(+18.0)#28 | 6.9%(+16.9)#1,270 |
| 29. | Addyston | 23.7% | 5.8%(+17.9)#29 | 6.9%(+16.9)#1,275 |
| 30. | Batesville | 23.5% | 5.8%(+17.7)#30 | 6.9%(+16.7)#1,310 |
| 31. | Vickery | 23.5% | 5.8%(+17.7)#31 | 6.9%(+16.6)#1,317 |
| 32. | Buford | 22.9% | 5.8%(+17.1)#32 | 6.9%(+16.1)#1,399 |
| 33. | Chesterville | 22.2% | 5.8%(+16.4)#33 | 6.9%(+15.3)#1,509 |
| 34. | Castine | 22.2% | 5.8%(+16.4)#34 | 6.9%(+15.3)#1,514 |
| 35. | Rossmoyne | 21.9% | 5.8%(+16.1)#35 | 6.9%(+15.0)#1,559 |
| 36. | Lakeview | 21.8% | 5.8%(+15.9)#36 | 6.9%(+14.9)#1,579 |
| 37. | Hemlock | 21.7% | 5.8%(+15.9)#37 | 6.9%(+14.9)#1,584 |
| 38. | Neville | 21.7% | 5.8%(+15.9)#38 | 6.9%(+14.9)#1,591 |
| 39. | Milledgeville | 21.2% | 5.8%(+15.3)#39 | 6.9%(+14.3)#1,676 |
| 40. | Neapolis | 20.9% | 5.8%(+15.1)#40 | 6.9%(+14.0)#1,715 |
| 41. | East Alliance | 20.8% | 5.8%(+15.0)#41 | 6.9%(+14.0)#1,737 |
| 42. | Mount Pleasant | 20.8% | 5.8%(+14.9)#42 | 6.9%(+13.9)#1,751 |
| 43. | Bentonville | 20.5% | 5.8%(+14.7)#43 | 6.9%(+13.6)#1,790 |
| 44. | Bolton | 20.2% | 5.8%(+14.4)#44 | 6.9%(+13.4)#1,851 |
| 45. | Marlboro | 20.2% | 5.8%(+14.3)#45 | 6.9%(+13.3)#1,860 |
| 46. | Valley City | 20.1% | 5.8%(+14.2)#46 | 6.9%(+13.2)#1,873 |
| 47. | Derby | 19.8% | 5.8%(+14.0)#47 | 6.9%(+12.9)#1,938 |
| 48. | New Lebanon | 19.7% | 5.8%(+13.9)#48 | 6.9%(+12.9)#1,957 |
| 49. | Thurston | 19.7% | 5.8%(+13.9)#49 | 6.9%(+12.8)#1,974 |
| 50. | Camden | 19.7% | 5.8%(+13.8)#50 | 6.9%(+12.8)#1,977 |
| 51. | Sardis | 19.7% | 5.8%(+13.8)#51 | 6.9%(+12.8)#1,978 |
| 52. | Fairfield Beach | 19.4% | 5.8%(+13.5)#52 | 6.9%(+12.5)#2,046 |
| 53. | Conesville | 19.1% | 5.8%(+13.3)#53 | 6.9%(+12.3)#2,101 |
| 54. | Somerville | 19.0% | 5.8%(+13.2)#54 | 6.9%(+12.1)#2,139 |
| 55. | Murray City | 19.0% | 5.8%(+13.2)#55 | 6.9%(+12.1)#2,143 |
| 56. | Stone Creek | 18.9% | 5.8%(+13.1)#56 | 6.9%(+12.0)#2,161 |
| 57. | Madison Place | 18.9% | 5.8%(+13.1)#57 | 6.9%(+12.0)#2,166 |
| 58. | Grandview | 18.8% | 5.8%(+13.0)#58 | 6.9%(+12.0)#2,190 |
| 59. | Sharon Center | 18.8% | 5.8%(+13.0)#59 | 6.9%(+11.9)#2,197 |
| 60. | Suffield | 18.8% | 5.8%(+13.0)#60 | 6.9%(+11.9)#2,200 |
| 61. | Elgin | 18.6% | 5.8%(+12.7)#61 | 6.9%(+11.7)#2,254 |
| 62. | Gratis | 18.5% | 5.8%(+12.7)#62 | 6.9%(+11.6)#2,282 |
| 63. | Burbank | 18.2% | 5.8%(+12.4)#63 | 6.9%(+11.4)#2,342 |
| 64. | Bradner | 18.2% | 5.8%(+12.4)#64 | 6.9%(+11.3)#2,358 |
| 65. | Octa | 18.2% | 5.8%(+12.4)#65 | 6.9%(+11.3)#2,387 |
| 66. | Laura | 18.1% | 5.8%(+12.3)#66 | 6.9%(+11.2)#2,409 |
| 67. | Orangeville | 17.8% | 5.8%(+12.0)#67 | 6.9%(+10.9)#2,495 |
| 68. | Beaverdam | 17.7% | 5.8%(+11.9)#68 | 6.9%(+10.8)#2,523 |
| 69. | St Louisville | 17.6% | 5.8%(+11.8)#69 | 6.9%(+10.8)#2,538 |
| 70. | Marengo | 17.6% | 5.8%(+11.7)#70 | 6.9%(+10.7)#2,567 |
| 71. | New Miami | 17.5% | 5.8%(+11.7)#71 | 6.9%(+10.6)#2,578 |
| 72. | Highland Holiday | 17.5% | 5.8%(+11.6)#72 | 6.9%(+10.6)#2,591 |
| 73. | New Straitsville | 17.4% | 5.8%(+11.6)#73 | 6.9%(+10.6)#2,602 |
| 74. | Corwin | 17.4% | 5.8%(+11.6)#74 | 6.9%(+10.5)#2,611 |
| 75. | Valley Hi | 17.2% | 5.8%(+11.4)#75 | 6.9%(+10.4)#2,654 |
| 76. | Somerset | 17.1% | 5.8%(+11.2)#76 | 6.9%(+10.2)#2,726 |
| 77. | Chesterhill | 16.9% | 5.8%(+11.1)#77 | 6.9%(+10.0)#2,779 |
| 78. | Hide A Way Hills | 16.8% | 5.8%(+10.9)#78 | 6.9%(+9.88)#2,834 |
| 79. | Lockbourne | 16.7% | 5.8%(+10.8)#79 | 6.9%(+9.79)#2,875 |
| 80. | Tedrow | 16.7% | 5.8%(+10.8)#80 | 6.9%(+9.79)#2,877 |
| 81. | Port Jefferson | 16.5% | 5.8%(+10.7)#81 | 6.9%(+9.60)#2,966 |
| 82. | Bowersville | 16.3% | 5.8%(+10.5)#82 | 6.9%(+9.42)#3,025 |
| 83. | Harbor Hills | 16.3% | 5.8%(+10.5)#83 | 6.9%(+9.40)#3,030 |
| 84. | Mount Eaton | 16.3% | 5.8%(+10.5)#84 | 6.9%(+9.40)#3,033 |
| 85. | Magnetic Springs | 16.3% | 5.8%(+10.4)#85 | 6.9%(+9.37)#3,041 |
| 86. | Holmesville | 16.0% | 5.8%(+10.2)#86 | 6.9%(+9.17)#3,117 |
| 87. | Rosemount | 16.0% | 5.8%(+10.2)#87 | 6.9%(+9.13)#3,131 |
| 88. | Otway | 16.0% | 5.8%(+10.2)#88 | 6.9%(+9.12)#3,139 |
| 89. | Russells Point | 16.0% | 5.8%(+10.2)#89 | 6.9%(+9.12)#3,140 |
| 90. | Carbon Hill | 15.9% | 5.8%(+10.1)#90 | 6.9%(+9.07)#3,157 |
| 91. | Roseville | 15.9% | 5.8%(+10.1)#91 | 6.9%(+9.05)#3,161 |
| 92. | Tarlton | 15.8% | 5.8%(+10.0)#92 | 6.9%(+8.96)#3,205 |
| 93. | Luckey | 15.8% | 5.8%(+10.0)#93 | 6.9%(+8.95)#3,206 |
| 94. | Glenmoor | 15.8% | 5.8%(+9.93)#94 | 6.9%(+8.88)#3,239 |
| 95. | Atwater | 15.5% | 5.8%(+9.66)#95 | 6.9%(+8.61)#3,354 |
| 96. | Woodsdale | 15.5% | 5.8%(+9.65)#96 | 6.9%(+8.60)#3,356 |
| 97. | Malvern | 15.5% | 5.8%(+9.63)#97 | 6.9%(+8.58)#3,363 |
| 98. | Massieville | 15.5% | 5.8%(+9.63)#98 | 6.9%(+8.58)#3,365 |
| 99. | Marshallville | 15.3% | 5.8%(+9.43)#99 | 6.9%(+8.38)#3,466 |
| 100. | Brecon | 15.2% | 5.8%(+9.39)#100 | 6.9%(+8.34)#3,481 |
Common Questions
What are the Top 10 Cities with the Highest Percentage of Population Employed in Construction in Ohio?
Top 10 Cities with the Highest Percentage of Population Employed in Construction in Ohio are:
#1
50.0%
#2
44.0%
#3
39.5%
#4
36.5%
#5
34.0%
#6
33.6%
#7
31.5%
#8
31.3%
#9
30.8%
#10
30.5%
What city has the Highest Percentage of Population Employed in Construction in Ohio?
Pancoastburg has the Highest Percentage of Population Employed in Construction in Ohio with 50.0%.
What is the Percentage of Population Employed in Construction in the State of Ohio?
Percentage of Population Employed in Construction in Ohio is 5.8%.
What is the Percentage of Population Employed in Construction in the United States?
Percentage of Population Employed in Construction in the United States is 6.9%.