Cities with the Highest Percentage of Population Employed in Construction in Connecticut
RELATED REPORTS & OPTIONS
Construction
Connecticut
Compare Cities
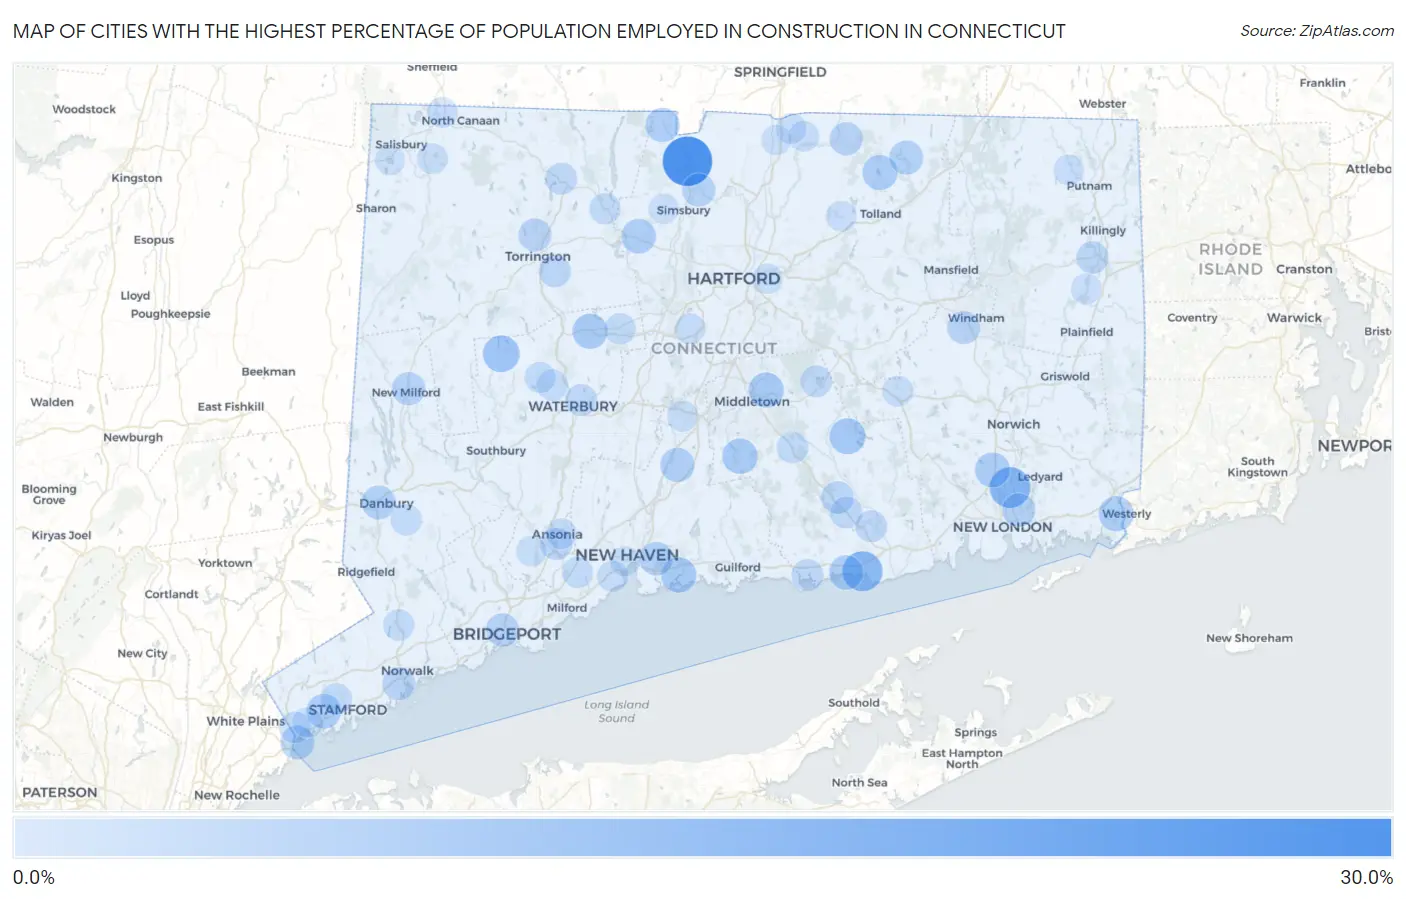
Map of Cities with the Highest Percentage of Population Employed in Construction in Connecticut
0.0%
30.0%
Cities with the Highest Percentage of Population Employed in Construction in Connecticut
| City | % Employed | vs State | vs National | |
| 1. | Salmon Brook | 27.7% | 6.1%(+21.5)#1 | 6.9%(+20.8)#908 |
| 2. | Branchville | 26.1% | 6.1%(+20.0)#2 | 6.9%(+19.2)#1,038 |
| 3. | Hawleyville | 23.7% | 6.1%(+17.5)#3 | 6.9%(+16.8)#1,289 |
| 4. | Ball Pond | 17.3% | 6.1%(+11.2)#4 | 6.9%(+10.4)#2,640 |
| 5. | Gales Ferry | 17.2% | 6.1%(+11.1)#5 | 6.9%(+10.4)#2,649 |
| 6. | Inglenook | 17.1% | 6.1%(+10.9)#6 | 6.9%(+10.2)#2,729 |
| 7. | Saybrook Manor | 16.4% | 6.1%(+10.3)#7 | 6.9%(+9.57)#2,978 |
| 8. | Bantam Borough | 15.9% | 6.1%(+9.76)#8 | 6.9%(+9.02)#3,185 |
| 9. | Cornwall Bridge | 15.3% | 6.1%(+9.17)#9 | 6.9%(+8.43)#3,441 |
| 10. | Mechanicsville | 14.6% | 6.1%(+8.43)#10 | 6.9%(+7.69)#3,870 |
| 11. | Lake Bungee | 12.7% | 6.1%(+6.55)#11 | 6.9%(+5.80)#5,133 |
| 12. | Bethlehem Village | 12.5% | 6.1%(+6.37)#12 | 6.9%(+5.62)#5,231 |
| 13. | Mill Plain | 12.2% | 6.1%(+6.09)#13 | 6.9%(+5.35)#5,503 |
| 14. | Moodus | 11.6% | 6.1%(+5.47)#14 | 6.9%(+4.72)#6,114 |
| 15. | Groton Long Point Borough | 10.9% | 6.1%(+4.80)#15 | 6.9%(+4.06)#6,840 |
| 16. | Branford Center | 10.8% | 6.1%(+4.62)#16 | 6.9%(+3.88)#7,067 |
| 17. | Durham | 10.7% | 6.1%(+4.60)#17 | 6.9%(+3.86)#7,089 |
| 18. | Portland | 10.7% | 6.1%(+4.54)#18 | 6.9%(+3.80)#7,172 |
| 19. | Terryville | 10.6% | 6.1%(+4.50)#19 | 6.9%(+3.76)#7,218 |
| 20. | Oxoboxo River | 10.5% | 6.1%(+4.41)#20 | 6.9%(+3.67)#7,327 |
| 21. | Crystal Lake | 10.5% | 6.1%(+4.40)#21 | 6.9%(+3.66)#7,338 |
| 22. | Pawcatuck | 10.5% | 6.1%(+4.40)#22 | 6.9%(+3.66)#7,339 |
| 23. | Rock Ridge | 10.1% | 6.1%(+4.00)#23 | 6.9%(+3.26)#7,837 |
| 24. | Northford | 10.1% | 6.1%(+3.99)#24 | 6.9%(+3.25)#7,849 |
| 25. | Cos Cob | 10.1% | 6.1%(+3.99)#25 | 6.9%(+3.25)#7,852 |
| 26. | Canton Valley | 10.1% | 6.1%(+3.95)#26 | 6.9%(+3.21)#7,903 |
| 27. | Westbrook Center | 9.9% | 6.1%(+3.77)#27 | 6.9%(+3.03)#8,152 |
| 28. | Bridgewater | 9.7% | 6.1%(+3.59)#28 | 6.9%(+2.85)#8,428 |
| 29. | Candlewood Orchards | 9.6% | 6.1%(+3.50)#29 | 6.9%(+2.76)#8,554 |
| 30. | Wallingford Center | 9.6% | 6.1%(+3.50)#30 | 6.9%(+2.76)#8,555 |
| 31. | Tashua | 9.6% | 6.1%(+3.42)#31 | 6.9%(+2.68)#8,671 |
| 32. | North Granby | 9.5% | 6.1%(+3.37)#32 | 6.9%(+2.63)#8,754 |
| 33. | Stafford Springs | 9.4% | 6.1%(+3.23)#33 | 6.9%(+2.49)#8,964 |
| 34. | Stratford Downtown | 9.3% | 6.1%(+3.16)#34 | 6.9%(+2.42)#9,065 |
| 35. | Danbury | 9.3% | 6.1%(+3.14)#35 | 6.9%(+2.40)#9,113 |
| 36. | Byram | 9.3% | 6.1%(+3.13)#36 | 6.9%(+2.38)#9,123 |
| 37. | East Haven | 8.9% | 6.1%(+2.79)#37 | 6.9%(+2.05)#9,683 |
| 38. | Coleytown | 8.9% | 6.1%(+2.77)#38 | 6.9%(+2.03)#9,704 |
| 39. | Jewett City Borough | 8.8% | 6.1%(+2.65)#39 | 6.9%(+1.91)#9,925 |
| 40. | Conning Towers Nautilus Park | 8.7% | 6.1%(+2.61)#40 | 6.9%(+1.86)#10,010 |
| 41. | Bridgeport | 8.6% | 6.1%(+2.51)#41 | 6.9%(+1.76)#10,183 |
| 42. | Tariffville | 8.6% | 6.1%(+2.44)#42 | 6.9%(+1.70)#10,295 |
| 43. | New Milford | 8.6% | 6.1%(+2.44)#43 | 6.9%(+1.70)#10,302 |
| 44. | Somers | 8.5% | 6.1%(+2.37)#44 | 6.9%(+1.63)#10,451 |
| 45. | South Windham | 8.3% | 6.1%(+2.21)#45 | 6.9%(+1.47)#10,718 |
| 46. | Torrington | 8.3% | 6.1%(+2.17)#46 | 6.9%(+1.43)#10,829 |
| 47. | Quasset Lake | 8.3% | 6.1%(+2.14)#47 | 6.9%(+1.40)#10,878 |
| 48. | Norwalk | 8.2% | 6.1%(+2.05)#48 | 6.9%(+1.31)#11,063 |
| 49. | Indian Field | 7.9% | 6.1%(+1.75)#49 | 6.9%(+1.01)#11,678 |
| 50. | Stepney | 7.8% | 6.1%(+1.70)#50 | 6.9%(+0.957)#11,776 |
| 51. | Chester Center | 7.8% | 6.1%(+1.69)#51 | 6.9%(+0.951)#11,792 |
| 52. | East Brooklyn | 7.6% | 6.1%(+1.46)#52 | 6.9%(+0.718)#12,292 |
| 53. | East | 7.5% | 6.1%(+1.37)#53 | 6.9%(+0.628)#12,486 |
| 54. | Derby | 7.3% | 6.1%(+1.19)#54 | 6.9%(+0.445)#12,898 |
| 55. | Northwest Harwinton | 7.2% | 6.1%(+1.11)#55 | 6.9%(+0.367)#13,079 |
| 56. | Lakes East | 7.1% | 6.1%(+0.999)#56 | 6.9%(+0.257)#13,317 |
| 57. | Clinton | 7.1% | 6.1%(+0.924)#57 | 6.9%(+0.182)#13,476 |
| 58. | Winsted | 7.1% | 6.1%(+0.920)#58 | 6.9%(+0.179)#13,477 |
| 59. | Deep River Center | 7.0% | 6.1%(+0.914)#59 | 6.9%(+0.172)#13,493 |
| 60. | Essex Village | 7.0% | 6.1%(+0.880)#60 | 6.9%(+0.139)#13,581 |
| 61. | Waterbury | 7.0% | 6.1%(+0.857)#61 | 6.9%(+0.116)#13,631 |
| 62. | Naugatuck Borough | 7.0% | 6.1%(+0.824)#62 | 6.9%(+0.082)#13,698 |
| 63. | Sandy Hook | 7.0% | 6.1%(+0.818)#63 | 6.9%(+0.076)#13,710 |
| 64. | Pemberwick | 6.9% | 6.1%(+0.747)#64 | 6.9%(+0.005)#13,890 |
| 65. | Lake Pocotopaug | 6.9% | 6.1%(+0.735)#65 | 6.9%(-0.007)#13,903 |
| 66. | Higganum | 6.8% | 6.1%(+0.625)#66 | 6.9%(-0.117)#14,143 |
| 67. | Stonington Borough | 6.7% | 6.1%(+0.548)#67 | 6.9%(-0.194)#14,323 |
| 68. | Bristol | 6.6% | 6.1%(+0.423)#68 | 6.9%(-0.318)#14,611 |
| 69. | New Hartford Center | 6.5% | 6.1%(+0.394)#69 | 6.9%(-0.347)#14,692 |
| 70. | Stamford | 6.5% | 6.1%(+0.379)#70 | 6.9%(-0.363)#14,734 |
| 71. | Bigelow Corners | 6.5% | 6.1%(+0.338)#71 | 6.9%(-0.404)#14,822 |
| 72. | Wilton Center | 6.4% | 6.1%(+0.306)#72 | 6.9%(-0.436)#14,910 |
| 73. | Bethel | 6.4% | 6.1%(+0.255)#73 | 6.9%(-0.487)#15,013 |
| 74. | Oakville | 6.3% | 6.1%(+0.204)#74 | 6.9%(-0.537)#15,128 |
| 75. | Newtown Borough | 6.3% | 6.1%(+0.162)#75 | 6.9%(-0.579)#15,230 |
| 76. | Orange | 6.2% | 6.1%(+0.019)#76 | 6.9%(-0.722)#15,582 |
| 77. | Noroton | 6.1% | 6.1%(+0.004)#77 | 6.9%(-0.738)#15,628 |
| 78. | Watertown | 6.1% | 6.1%(-0.009)#78 | 6.9%(-0.751)#15,671 |
| 79. | Meriden | 6.1% | 6.1%(-0.078)#79 | 6.9%(-0.820)#15,852 |
| 80. | West Haven | 6.0% | 6.1%(-0.086)#80 | 6.9%(-0.828)#15,876 |
| 81. | Colchester | 6.0% | 6.1%(-0.142)#81 | 6.9%(-0.884)#16,036 |
| 82. | Falls Village | 5.9% | 6.1%(-0.199)#82 | 6.9%(-0.940)#16,180 |
| 83. | Ansonia | 5.9% | 6.1%(-0.202)#83 | 6.9%(-0.944)#16,188 |
| 84. | New Britain | 5.8% | 6.1%(-0.312)#84 | 6.9%(-1.05)#16,443 |
| 85. | Hazardville | 5.7% | 6.1%(-0.391)#85 | 6.9%(-1.13)#16,636 |
| 86. | Cornwall | 5.7% | 6.1%(-0.420)#86 | 6.9%(-1.16)#16,710 |
| 87. | Wauregan | 5.7% | 6.1%(-0.469)#87 | 6.9%(-1.21)#16,834 |
| 88. | Canaan | 5.6% | 6.1%(-0.515)#88 | 6.9%(-1.26)#16,958 |
| 89. | South Woodstock | 5.6% | 6.1%(-0.517)#89 | 6.9%(-1.26)#16,960 |
| 90. | Rockville | 5.6% | 6.1%(-0.568)#90 | 6.9%(-1.31)#17,065 |
| 91. | Sherwood Manor | 5.5% | 6.1%(-0.665)#91 | 6.9%(-1.41)#17,330 |
| 92. | Shelton | 5.5% | 6.1%(-0.678)#92 | 6.9%(-1.42)#17,361 |
| 93. | East Hartford | 5.4% | 6.1%(-0.694)#93 | 6.9%(-1.44)#17,408 |
| 94. | Greenwich | 5.3% | 6.1%(-0.823)#94 | 6.9%(-1.56)#17,736 |
| 95. | West Simsbury | 5.3% | 6.1%(-0.848)#95 | 6.9%(-1.59)#17,798 |
| 96. | Plattsville | 5.3% | 6.1%(-0.858)#96 | 6.9%(-1.60)#17,823 |
| 97. | New Haven | 5.2% | 6.1%(-0.932)#97 | 6.9%(-1.67)#18,015 |
| 98. | Lakeville | 5.2% | 6.1%(-0.955)#98 | 6.9%(-1.70)#18,083 |
| 99. | Thompsonville | 5.2% | 6.1%(-0.959)#99 | 6.9%(-1.70)#18,092 |
| 100. | Weston | 5.2% | 6.1%(-0.978)#100 | 6.9%(-1.72)#18,148 |
Common Questions
What are the Top 10 Cities with the Highest Percentage of Population Employed in Construction in Connecticut?
Top 10 Cities with the Highest Percentage of Population Employed in Construction in Connecticut are:
#1
27.7%
#2
17.2%
#3
16.4%
#4
12.5%
#5
11.6%
#6
10.8%
#7
10.7%
#8
10.7%
#9
10.6%
#10
10.5%
What city has the Highest Percentage of Population Employed in Construction in Connecticut?
Salmon Brook has the Highest Percentage of Population Employed in Construction in Connecticut with 27.7%.
What is the Percentage of Population Employed in Construction in the State of Connecticut?
Percentage of Population Employed in Construction in Connecticut is 6.1%.
What is the Percentage of Population Employed in Construction in the United States?
Percentage of Population Employed in Construction in the United States is 6.9%.