Cities with the Highest Percentage of Population Employed in Construction in Indiana
RELATED REPORTS & OPTIONS
Construction
Indiana
Compare Cities
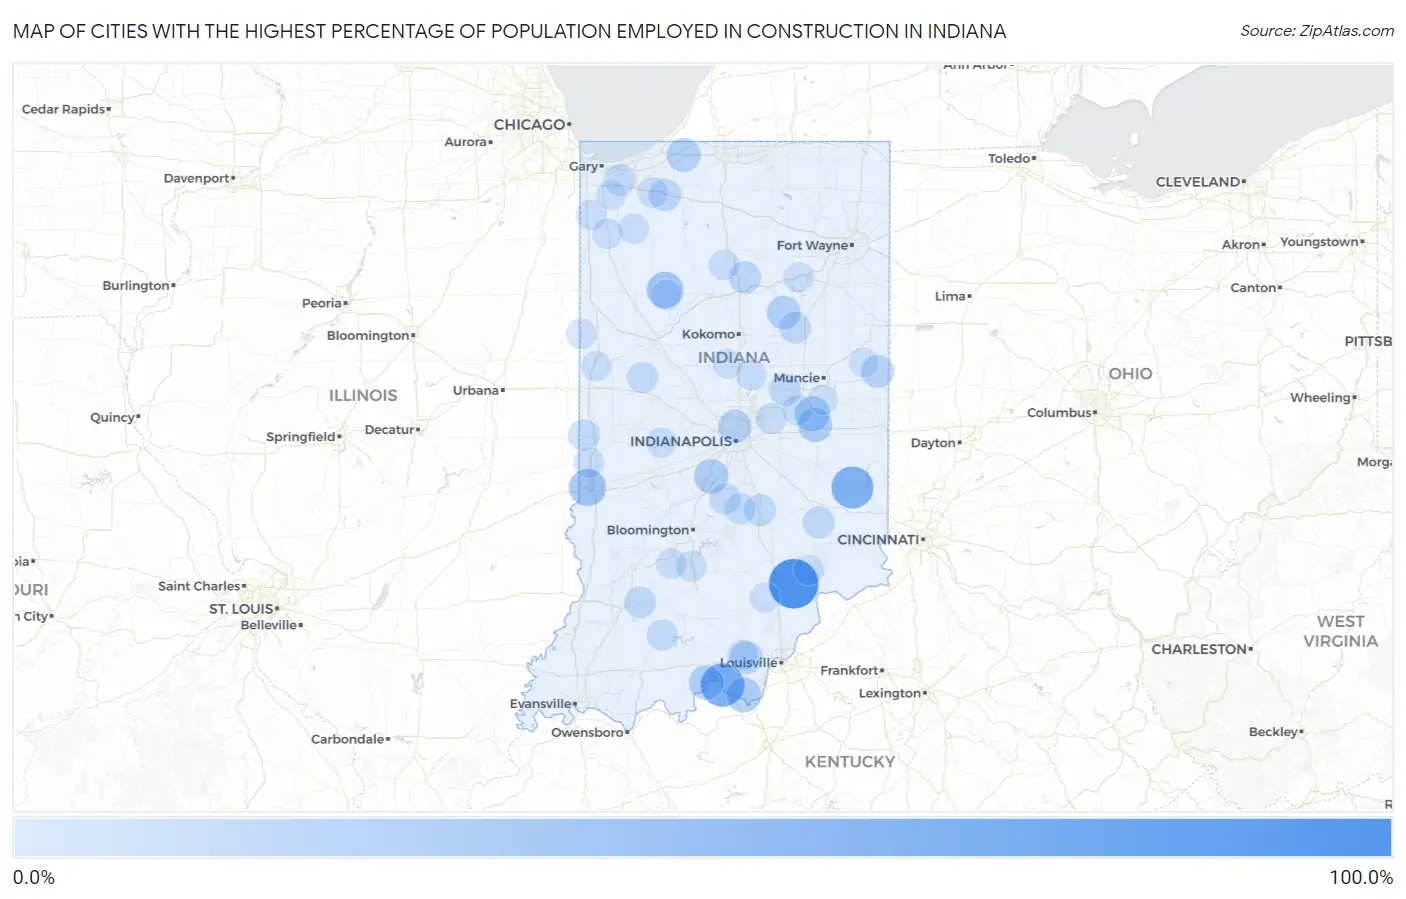
Map of Cities with the Highest Percentage of Population Employed in Construction in Indiana
0.0%
100.0%
Cities with the Highest Percentage of Population Employed in Construction in Indiana
| City | % Employed | vs State | vs National | |
| 1. | Deputy | 100.0% | 6.4%(+93.6)#1 | 6.9%(+93.1)#33 |
| 2. | New Amsterdam | 73.1% | 6.4%(+66.7)#2 | 6.9%(+66.2)#80 |
| 3. | Kramer | 66.7% | 6.4%(+60.3)#3 | 6.9%(+59.8)#101 |
| 4. | Metamora | 65.9% | 6.4%(+59.5)#4 | 6.9%(+59.0)#103 |
| 5. | Letts | 62.9% | 6.4%(+56.5)#5 | 6.9%(+56.0)#115 |
| 6. | Hamburg | 57.1% | 6.4%(+50.7)#6 | 6.9%(+50.3)#152 |
| 7. | East Oolitic | 56.9% | 6.4%(+50.5)#7 | 6.9%(+50.0)#155 |
| 8. | Azalia | 54.3% | 6.4%(+47.9)#8 | 6.9%(+47.4)#181 |
| 9. | Hedrick | 50.8% | 6.4%(+44.5)#9 | 6.9%(+44.0)#204 |
| 10. | Toad Hop | 44.3% | 6.4%(+37.9)#10 | 6.9%(+37.5)#287 |
| 11. | Norway | 42.0% | 6.4%(+35.6)#11 | 6.9%(+35.1)#320 |
| 12. | Mace | 41.7% | 6.4%(+35.3)#12 | 6.9%(+34.8)#324 |
| 13. | Coal | 40.9% | 6.4%(+34.5)#13 | 6.9%(+34.0)#338 |
| 14. | Reddington | 38.8% | 6.4%(+32.4)#14 | 6.9%(+31.9)#389 |
| 15. | Pleasant Lake | 37.9% | 6.4%(+31.5)#15 | 6.9%(+31.0)#414 |
| 16. | Cadiz | 35.5% | 6.4%(+29.1)#16 | 6.9%(+28.6)#497 |
| 17. | Laconia | 35.3% | 6.4%(+28.9)#17 | 6.9%(+28.4)#503 |
| 18. | Bethany | 33.3% | 6.4%(+26.9)#18 | 6.9%(+26.5)#581 |
| 19. | Boone Grove | 33.3% | 6.4%(+26.9)#19 | 6.9%(+26.5)#585 |
| 20. | Alton | 33.3% | 6.4%(+26.9)#20 | 6.9%(+26.5)#589 |
| 21. | Greensboro | 32.7% | 6.4%(+26.3)#21 | 6.9%(+25.8)#615 |
| 22. | Lake Cicott | 32.4% | 6.4%(+26.0)#22 | 6.9%(+25.5)#626 |
| 23. | Commiskey | 32.1% | 6.4%(+25.7)#23 | 6.9%(+25.3)#634 |
| 24. | Blairsville | 31.4% | 6.4%(+25.0)#24 | 6.9%(+24.6)#670 |
| 25. | Vicksburg | 31.0% | 6.4%(+24.6)#25 | 6.9%(+24.2)#688 |
| 26. | Raub | 31.0% | 6.4%(+24.6)#26 | 6.9%(+24.1)#692 |
| 27. | Rolling Prairie | 30.6% | 6.4%(+24.2)#27 | 6.9%(+23.7)#711 |
| 28. | Lyford | 30.2% | 6.4%(+23.8)#28 | 6.9%(+23.3)#733 |
| 29. | Jalapa | 30.0% | 6.4%(+23.6)#29 | 6.9%(+23.1)#748 |
| 30. | Johnson | 29.7% | 6.4%(+23.3)#30 | 6.9%(+22.8)#765 |
| 31. | West Middleton | 29.1% | 6.4%(+22.7)#31 | 6.9%(+22.2)#800 |
| 32. | Reo | 28.6% | 6.4%(+22.2)#32 | 6.9%(+21.7)#822 |
| 33. | North Crows Nest | 27.9% | 6.4%(+21.5)#33 | 6.9%(+21.0)#894 |
| 34. | Crandall | 27.3% | 6.4%(+20.9)#34 | 6.9%(+20.4)#939 |
| 35. | Cowan | 27.0% | 6.4%(+20.6)#35 | 6.9%(+20.2)#974 |
| 36. | Saratoga | 27.0% | 6.4%(+20.6)#36 | 6.9%(+20.1)#977 |
| 37. | Miami | 26.9% | 6.4%(+20.5)#37 | 6.9%(+20.0)#985 |
| 38. | Waverly | 26.0% | 6.4%(+19.6)#38 | 6.9%(+19.2)#1,043 |
| 39. | Underwood | 25.2% | 6.4%(+18.8)#39 | 6.9%(+18.4)#1,104 |
| 40. | Taswell | 25.0% | 6.4%(+18.6)#40 | 6.9%(+18.1)#1,141 |
| 41. | Hanna | 24.2% | 6.4%(+17.8)#41 | 6.9%(+17.3)#1,212 |
| 42. | Wadesville | 24.0% | 6.4%(+17.6)#42 | 6.9%(+17.2)#1,239 |
| 43. | Denver | 23.8% | 6.4%(+17.4)#43 | 6.9%(+17.0)#1,262 |
| 44. | Williamsburg | 23.7% | 6.4%(+17.3)#44 | 6.9%(+16.8)#1,283 |
| 45. | Martinsburg | 23.3% | 6.4%(+16.9)#45 | 6.9%(+16.5)#1,341 |
| 46. | Charlottesville | 23.2% | 6.4%(+16.8)#46 | 6.9%(+16.4)#1,357 |
| 47. | Taylorsville | 22.6% | 6.4%(+16.2)#47 | 6.9%(+15.8)#1,445 |
| 48. | Millhousen | 22.6% | 6.4%(+16.2)#48 | 6.9%(+15.7)#1,456 |
| 49. | New Lebanon | 22.5% | 6.4%(+16.1)#49 | 6.9%(+15.6)#1,464 |
| 50. | Marion | 22.4% | 6.4%(+16.0)#50 | 6.9%(+15.5)#1,492 |
| 51. | River Forest | 22.2% | 6.4%(+15.8)#51 | 6.9%(+15.3)#1,522 |
| 52. | Grammer | 22.2% | 6.4%(+15.8)#52 | 6.9%(+15.3)#1,525 |
| 53. | Ardmore | 22.0% | 6.4%(+15.6)#53 | 6.9%(+15.1)#1,545 |
| 54. | Wellsboro | 21.9% | 6.4%(+15.5)#54 | 6.9%(+15.0)#1,565 |
| 55. | Cannelburg | 21.8% | 6.4%(+15.4)#55 | 6.9%(+14.9)#1,571 |
| 56. | Eden | 21.2% | 6.4%(+14.9)#56 | 6.9%(+14.4)#1,660 |
| 57. | Wheeler | 21.0% | 6.4%(+14.6)#57 | 6.9%(+14.1)#1,701 |
| 58. | Wildwood | 20.6% | 6.4%(+14.2)#58 | 6.9%(+13.8)#1,769 |
| 59. | New Richmond | 20.4% | 6.4%(+14.0)#59 | 6.9%(+13.5)#1,821 |
| 60. | Morgantown | 20.3% | 6.4%(+13.9)#60 | 6.9%(+13.5)#1,826 |
| 61. | Abington | 20.3% | 6.4%(+13.9)#61 | 6.9%(+13.4)#1,834 |
| 62. | Dana | 20.3% | 6.4%(+13.9)#62 | 6.9%(+13.4)#1,838 |
| 63. | Cordry Sweetwater Lakes | 19.8% | 6.4%(+13.4)#63 | 6.9%(+13.0)#1,929 |
| 64. | Patricksburg | 19.8% | 6.4%(+13.4)#64 | 6.9%(+12.9)#1,950 |
| 65. | Nyona Lake | 19.7% | 6.4%(+13.3)#65 | 6.9%(+12.8)#1,970 |
| 66. | Dubois | 19.6% | 6.4%(+13.3)#66 | 6.9%(+12.8)#1,984 |
| 67. | Philadelphia | 19.3% | 6.4%(+12.9)#67 | 6.9%(+12.4)#2,077 |
| 68. | Goldsmith | 19.0% | 6.4%(+12.7)#68 | 6.9%(+12.2)#2,126 |
| 69. | Fortville | 17.7% | 6.4%(+11.3)#69 | 6.9%(+10.8)#2,511 |
| 70. | Atlanta | 17.6% | 6.4%(+11.2)#70 | 6.9%(+10.7)#2,569 |
| 71. | Westwood | 17.4% | 6.4%(+11.0)#71 | 6.9%(+10.6)#2,604 |
| 72. | Avoca | 17.3% | 6.4%(+10.9)#72 | 6.9%(+10.4)#2,641 |
| 73. | Markleville | 17.3% | 6.4%(+10.9)#73 | 6.9%(+10.4)#2,647 |
| 74. | Universal | 17.0% | 6.4%(+10.6)#74 | 6.9%(+10.1)#2,754 |
| 75. | Saugany Lake | 16.9% | 6.4%(+10.5)#75 | 6.9%(+10.0)#2,785 |
| 76. | Ambia | 16.9% | 6.4%(+10.5)#76 | 6.9%(+9.99)#2,787 |
| 77. | Judah | 16.8% | 6.4%(+10.4)#77 | 6.9%(+9.97)#2,794 |
| 78. | Wanatah | 16.8% | 6.4%(+10.4)#78 | 6.9%(+9.89)#2,827 |
| 79. | Monticello | 16.8% | 6.4%(+10.4)#79 | 6.9%(+9.89)#2,829 |
| 80. | Lowell | 16.7% | 6.4%(+10.3)#80 | 6.9%(+9.82)#2,854 |
| 81. | Roselawn | 16.7% | 6.4%(+10.3)#81 | 6.9%(+9.82)#2,856 |
| 82. | Fulton | 16.7% | 6.4%(+10.3)#82 | 6.9%(+9.79)#2,878 |
| 83. | Owensburg | 16.7% | 6.4%(+10.3)#83 | 6.9%(+9.79)#2,881 |
| 84. | Mays | 16.7% | 6.4%(+10.3)#84 | 6.9%(+9.79)#2,888 |
| 85. | Dupont | 16.5% | 6.4%(+10.1)#85 | 6.9%(+9.64)#2,949 |
| 86. | Wheatfield | 16.3% | 6.4%(+9.91)#86 | 6.9%(+9.43)#3,022 |
| 87. | Bainbridge | 16.3% | 6.4%(+9.89)#87 | 6.9%(+9.41)#3,027 |
| 88. | Andrews | 15.8% | 6.4%(+9.39)#88 | 6.9%(+8.91)#3,212 |
| 89. | New Salisbury | 15.8% | 6.4%(+9.39)#89 | 6.9%(+8.91)#3,216 |
| 90. | West Lebanon | 15.7% | 6.4%(+9.35)#90 | 6.9%(+8.87)#3,246 |
| 91. | Springport | 15.5% | 6.4%(+9.10)#91 | 6.9%(+8.62)#3,349 |
| 92. | Coesse | 15.5% | 6.4%(+9.07)#92 | 6.9%(+8.59)#3,360 |
| 93. | Liberty Mills | 15.3% | 6.4%(+8.93)#93 | 6.9%(+8.45)#3,429 |
| 94. | Fishersburg | 15.3% | 6.4%(+8.91)#94 | 6.9%(+8.43)#3,442 |
| 95. | Delaware | 15.3% | 6.4%(+8.86)#95 | 6.9%(+8.38)#3,468 |
| 96. | Kempton | 15.2% | 6.4%(+8.84)#96 | 6.9%(+8.36)#3,471 |
| 97. | Little York | 15.1% | 6.4%(+8.72)#97 | 6.9%(+8.24)#3,536 |
| 98. | Winfield | 15.0% | 6.4%(+8.65)#98 | 6.9%(+8.17)#3,568 |
| 99. | Ridgeville | 14.9% | 6.4%(+8.55)#99 | 6.9%(+8.07)#3,630 |
| 100. | Chain-O-Lakes | 14.9% | 6.4%(+8.54)#100 | 6.9%(+8.06)#3,641 |
Common Questions
What are the Top 10 Cities with the Highest Percentage of Population Employed in Construction in Indiana?
Top 10 Cities with the Highest Percentage of Population Employed in Construction in Indiana are:
#1
100.0%
#2
73.1%
#3
65.9%
#4
44.3%
#5
42.0%
#6
35.5%
#7
35.3%
#8
33.3%
#9
33.3%
#10
32.7%
What city has the Highest Percentage of Population Employed in Construction in Indiana?
Deputy has the Highest Percentage of Population Employed in Construction in Indiana with 100.0%.
What is the Percentage of Population Employed in Construction in the State of Indiana?
Percentage of Population Employed in Construction in Indiana is 6.4%.
What is the Percentage of Population Employed in Construction in the United States?
Percentage of Population Employed in Construction in the United States is 6.9%.