Cities with the Highest Percentage of Population Employed in Construction in Vermont
RELATED REPORTS & OPTIONS
Construction
Vermont
Compare Cities
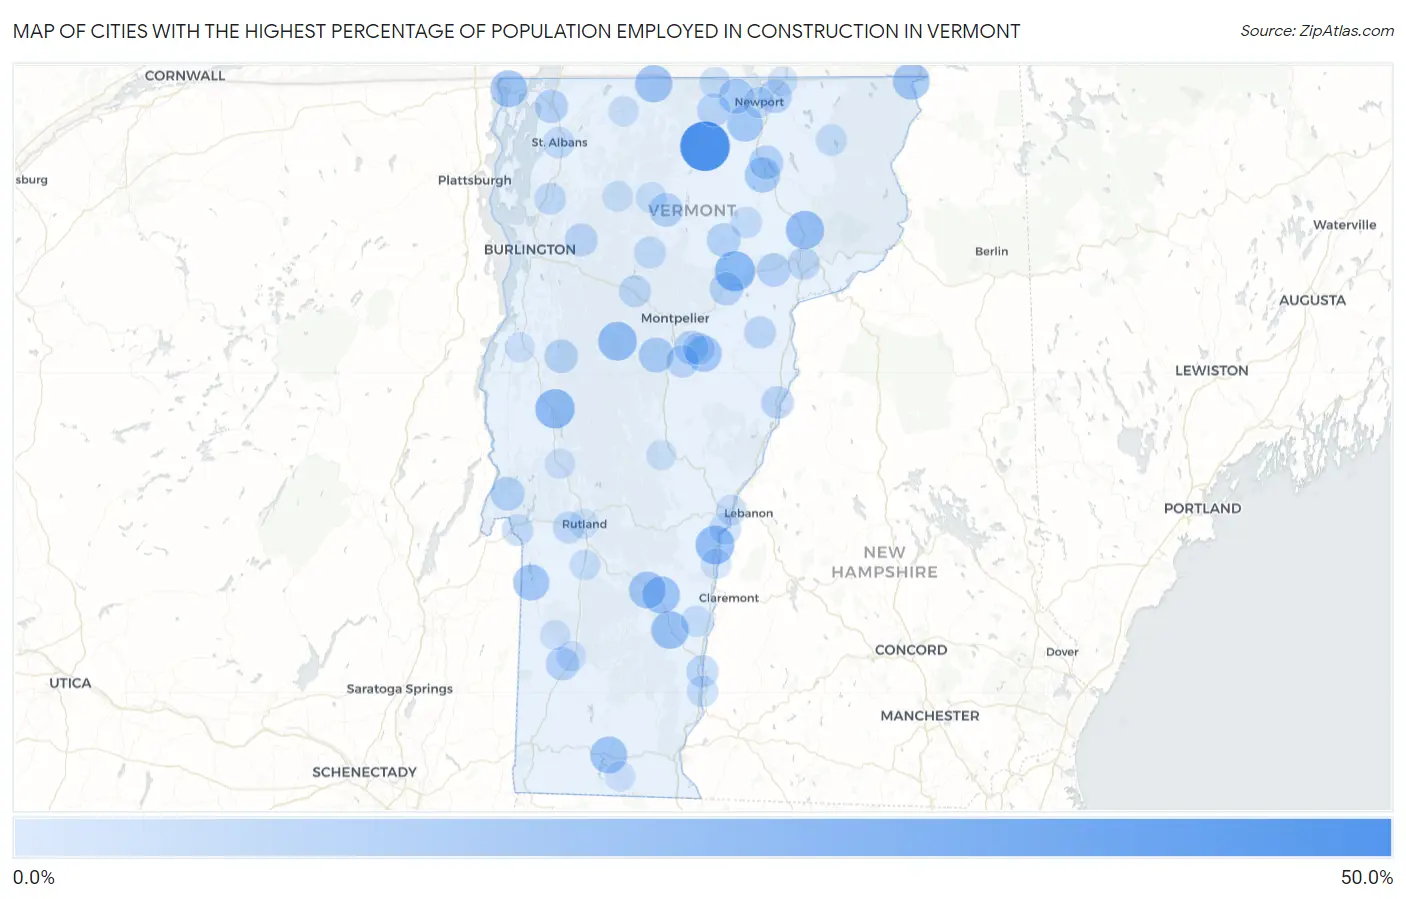
Map of Cities with the Highest Percentage of Population Employed in Construction in Vermont
0.0%
50.0%
Cities with the Highest Percentage of Population Employed in Construction in Vermont
| City | % Employed | vs State | vs National | |
| 1. | Lowell | 46.2% | 7.4%(+38.9)#1 | 6.9%(+39.4)#255 |
| 2. | East Charlotte | 42.3% | 7.4%(+34.9)#2 | 6.9%(+35.4)#315 |
| 3. | Pownal Center | 39.3% | 7.4%(+31.9)#3 | 6.9%(+32.4)#378 |
| 4. | West Charlotte | 37.2% | 7.4%(+29.8)#4 | 6.9%(+30.3)#441 |
| 5. | Cabot | 25.7% | 7.4%(+18.3)#5 | 6.9%(+18.8)#1,068 |
| 6. | Jamaica | 25.0% | 7.4%(+17.6)#6 | 6.9%(+18.1)#1,137 |
| 7. | Waterbury Center | 24.8% | 7.4%(+17.5)#7 | 6.9%(+18.0)#1,155 |
| 8. | East Middlebury | 24.1% | 7.4%(+16.7)#8 | 6.9%(+17.2)#1,231 |
| 9. | Whitingham | 23.9% | 7.4%(+16.5)#9 | 6.9%(+17.0)#1,253 |
| 10. | Hartland | 22.7% | 7.4%(+15.3)#10 | 6.9%(+15.9)#1,431 |
| 11. | Waitsfield | 22.4% | 7.4%(+15.0)#11 | 6.9%(+15.5)#1,480 |
| 12. | Grafton | 22.2% | 7.4%(+14.8)#12 | 6.9%(+15.3)#1,515 |
| 13. | Lyndonville | 21.7% | 7.4%(+14.3)#13 | 6.9%(+14.8)#1,598 |
| 14. | Chester | 20.3% | 7.4%(+13.0)#14 | 6.9%(+13.5)#1,824 |
| 15. | Richford | 19.5% | 7.4%(+12.1)#15 | 6.9%(+12.6)#2,019 |
| 16. | Proctorsville | 19.4% | 7.4%(+12.0)#16 | 6.9%(+12.5)#2,035 |
| 17. | Londonderry | 19.4% | 7.4%(+12.0)#17 | 6.9%(+12.5)#2,059 |
| 18. | Wilmington | 18.8% | 7.4%(+11.5)#18 | 6.9%(+12.0)#2,188 |
| 19. | Alburgh | 18.8% | 7.4%(+11.4)#19 | 6.9%(+11.9)#2,199 |
| 20. | Ludlow | 18.8% | 7.4%(+11.4)#20 | 6.9%(+11.9)#2,202 |
| 21. | Canaan | 18.8% | 7.4%(+11.4)#21 | 6.9%(+11.9)#2,214 |
| 22. | Stamford | 18.6% | 7.4%(+11.3)#22 | 6.9%(+11.8)#2,237 |
| 23. | East Dorset | 18.3% | 7.4%(+11.0)#23 | 6.9%(+11.5)#2,314 |
| 24. | Lincoln | 17.9% | 7.4%(+10.5)#24 | 6.9%(+11.0)#2,462 |
| 25. | Wells | 17.0% | 7.4%(+9.59)#25 | 6.9%(+10.1)#2,755 |
| 26. | East Barre | 16.9% | 7.4%(+9.54)#26 | 6.9%(+10.0)#2,769 |
| 27. | New Haven | 16.8% | 7.4%(+9.42)#27 | 6.9%(+9.92)#2,816 |
| 28. | Coventry | 16.7% | 7.4%(+9.29)#28 | 6.9%(+9.79)#2,912 |
| 29. | Glover | 15.4% | 7.4%(+8.01)#29 | 6.9%(+8.51)#3,387 |
| 30. | Newport Center | 15.2% | 7.4%(+7.84)#30 | 6.9%(+8.34)#3,485 |
| 31. | Wardsboro | 14.9% | 7.4%(+7.51)#31 | 6.9%(+8.02)#3,676 |
| 32. | Northfield | 14.8% | 7.4%(+7.38)#32 | 6.9%(+7.88)#3,755 |
| 33. | Chittenden | 14.4% | 7.4%(+7.05)#33 | 6.9%(+7.56)#3,950 |
| 34. | Huntington | 13.6% | 7.4%(+6.21)#34 | 6.9%(+6.71)#4,485 |
| 35. | Barton | 12.6% | 7.4%(+5.17)#35 | 6.9%(+5.68)#5,209 |
| 36. | Benson | 12.5% | 7.4%(+5.12)#36 | 6.9%(+5.62)#5,253 |
| 37. | Hanksville | 12.5% | 7.4%(+5.12)#37 | 6.9%(+5.62)#5,276 |
| 38. | Hardwick | 12.3% | 7.4%(+4.88)#38 | 6.9%(+5.38)#5,471 |
| 39. | Hyde Park | 12.2% | 7.4%(+4.83)#39 | 6.9%(+5.33)#5,515 |
| 40. | South Barre | 12.1% | 7.4%(+4.71)#40 | 6.9%(+5.21)#5,605 |
| 41. | Bolton Valley | 12.0% | 7.4%(+4.65)#41 | 6.9%(+5.15)#5,659 |
| 42. | Sutton | 11.8% | 7.4%(+4.45)#42 | 6.9%(+4.95)#5,872 |
| 43. | Bristol | 11.8% | 7.4%(+4.44)#43 | 6.9%(+4.95)#5,879 |
| 44. | Danville | 11.7% | 7.4%(+4.34)#44 | 6.9%(+4.84)#5,983 |
| 45. | Derby Center | 11.7% | 7.4%(+4.31)#45 | 6.9%(+4.82)#6,014 |
| 46. | St. George | 11.5% | 7.4%(+4.10)#46 | 6.9%(+4.61)#6,248 |
| 47. | Swanton | 11.5% | 7.4%(+4.07)#47 | 6.9%(+4.57)#6,270 |
| 48. | Manchester | 11.4% | 7.4%(+3.98)#48 | 6.9%(+4.49)#6,360 |
| 49. | Marshfield | 11.4% | 7.4%(+3.97)#49 | 6.9%(+4.47)#6,373 |
| 50. | Troy | 11.0% | 7.4%(+3.60)#50 | 6.9%(+4.10)#6,805 |
| 51. | Jericho | 10.4% | 7.4%(+2.99)#51 | 6.9%(+3.49)#7,556 |
| 52. | South Lincoln | 10.3% | 7.4%(+2.90)#52 | 6.9%(+3.40)#7,663 |
| 53. | Proctor | 10.2% | 7.4%(+2.81)#53 | 6.9%(+3.32)#7,773 |
| 54. | Harmonyville | 10.2% | 7.4%(+2.81)#54 | 6.9%(+3.31)#7,776 |
| 55. | Bradford | 10.1% | 7.4%(+2.69)#55 | 6.9%(+3.19)#7,937 |
| 56. | Williamstown | 10.0% | 7.4%(+2.63)#56 | 6.9%(+3.13)#7,985 |
| 57. | North Clarendon | 10.0% | 7.4%(+2.62)#57 | 6.9%(+3.12)#8,002 |
| 58. | Underhill Center | 10.0% | 7.4%(+2.62)#58 | 6.9%(+3.12)#8,040 |
| 59. | East Poultney | 9.8% | 7.4%(+2.40)#59 | 6.9%(+2.91)#8,340 |
| 60. | Websterville | 9.2% | 7.4%(+1.77)#60 | 6.9%(+2.27)#9,303 |
| 61. | Bellows Falls | 9.1% | 7.4%(+1.73)#61 | 6.9%(+2.23)#9,358 |
| 62. | St Johnsbury | 9.1% | 7.4%(+1.71)#62 | 6.9%(+2.21)#9,442 |
| 63. | Groton | 8.8% | 7.4%(+1.39)#63 | 6.9%(+1.89)#9,961 |
| 64. | Waterbury | 8.7% | 7.4%(+1.33)#64 | 6.9%(+1.83)#10,055 |
| 65. | Stowe | 8.5% | 7.4%(+1.09)#65 | 6.9%(+1.59)#10,517 |
| 66. | North Hartland | 8.4% | 7.4%(+0.998)#66 | 6.9%(+1.50)#10,674 |
| 67. | Killington | 8.2% | 7.4%(+0.818)#67 | 6.9%(+1.32)#11,038 |
| 68. | West Rutland | 8.2% | 7.4%(+0.801)#68 | 6.9%(+1.30)#11,066 |
| 69. | Milton | 8.2% | 7.4%(+0.777)#69 | 6.9%(+1.28)#11,118 |
| 70. | Fair Haven | 7.8% | 7.4%(+0.434)#70 | 6.9%(+0.936)#11,814 |
| 71. | St Albans | 7.8% | 7.4%(+0.387)#71 | 6.9%(+0.889)#11,932 |
| 72. | Island Pond | 7.6% | 7.4%(+0.216)#72 | 6.9%(+0.718)#12,294 |
| 73. | Westford | 7.5% | 7.4%(+0.148)#73 | 6.9%(+0.650)#12,443 |
| 74. | Westminster | 7.4% | 7.4%(+0.056)#74 | 6.9%(+0.558)#12,627 |
| 75. | North Hyde Park | 7.3% | 7.4%(-0.091)#75 | 6.9%(+0.411)#12,983 |
| 76. | Greensboro Bend | 7.2% | 7.4%(-0.185)#76 | 6.9%(+0.318)#13,185 |
| 77. | Newport | 7.0% | 7.4%(-0.372)#77 | 6.9%(+0.131)#13,600 |
| 78. | Gilman | 7.0% | 7.4%(-0.402)#78 | 6.9%(+0.100)#13,664 |
| 79. | Springfield | 6.9% | 7.4%(-0.511)#79 | 6.9%(-0.009)#13,905 |
| 80. | North Troy | 6.7% | 7.4%(-0.662)#80 | 6.9%(-0.160)#14,236 |
| 81. | South Hero | 6.6% | 7.4%(-0.785)#81 | 6.9%(-0.283)#14,538 |
| 82. | Middletown Springs | 6.6% | 7.4%(-0.800)#82 | 6.9%(-0.297)#14,571 |
| 83. | Johnson | 6.5% | 7.4%(-0.845)#83 | 6.9%(-0.342)#14,680 |
| 84. | Danby | 6.1% | 7.4%(-1.32)#84 | 6.9%(-0.816)#15,836 |
| 85. | White River Junction | 6.1% | 7.4%(-1.32)#85 | 6.9%(-0.822)#15,857 |
| 86. | Jeffersonville | 6.0% | 7.4%(-1.33)#86 | 6.9%(-0.830)#15,883 |
| 87. | Wallingford | 6.0% | 7.4%(-1.40)#87 | 6.9%(-0.902)#16,078 |
| 88. | Enosburg Falls | 5.8% | 7.4%(-1.54)#88 | 6.9%(-1.04)#16,409 |
| 89. | Manchester Center | 5.5% | 7.4%(-1.89)#89 | 6.9%(-1.39)#17,291 |
| 90. | Windsor | 5.5% | 7.4%(-1.91)#90 | 6.9%(-1.40)#17,321 |
| 91. | Brandon | 5.4% | 7.4%(-2.00)#91 | 6.9%(-1.49)#17,556 |
| 92. | Jacksonville | 5.4% | 7.4%(-2.00)#92 | 6.9%(-1.50)#17,570 |
| 93. | Bethel | 5.2% | 7.4%(-2.14)#93 | 6.9%(-1.64)#17,944 |
| 94. | Derby Line | 5.2% | 7.4%(-2.22)#94 | 6.9%(-1.72)#18,155 |
| 95. | Dorset | 5.0% | 7.4%(-2.34)#95 | 6.9%(-1.84)#18,471 |
| 96. | Vergennes | 4.9% | 7.4%(-2.48)#96 | 6.9%(-1.98)#18,826 |
| 97. | Hartford | 4.9% | 7.4%(-2.53)#97 | 6.9%(-2.02)#18,949 |
| 98. | Peacham | 4.8% | 7.4%(-2.62)#98 | 6.9%(-2.11)#19,155 |
| 99. | Bakersfield | 4.7% | 7.4%(-2.64)#99 | 6.9%(-2.14)#19,208 |
| 100. | Rutland | 4.7% | 7.4%(-2.70)#100 | 6.9%(-2.19)#19,347 |
1
2Common Questions
What are the Top 10 Cities with the Highest Percentage of Population Employed in Construction in Vermont?
Top 10 Cities with the Highest Percentage of Population Employed in Construction in Vermont are:
#1
46.2%
#2
25.7%
#3
24.1%
#4
22.7%
#5
22.4%
#6
21.7%
#7
20.3%
#8
19.5%
#9
19.4%
#10
18.8%
What city has the Highest Percentage of Population Employed in Construction in Vermont?
Lowell has the Highest Percentage of Population Employed in Construction in Vermont with 46.2%.
What is the Percentage of Population Employed in Construction in the State of Vermont?
Percentage of Population Employed in Construction in Vermont is 7.4%.
What is the Percentage of Population Employed in Construction in the United States?
Percentage of Population Employed in Construction in the United States is 6.9%.