Cities with the Highest Percentage of Population Employed in Construction in Oklahoma
RELATED REPORTS & OPTIONS
Construction
Oklahoma
Compare Cities
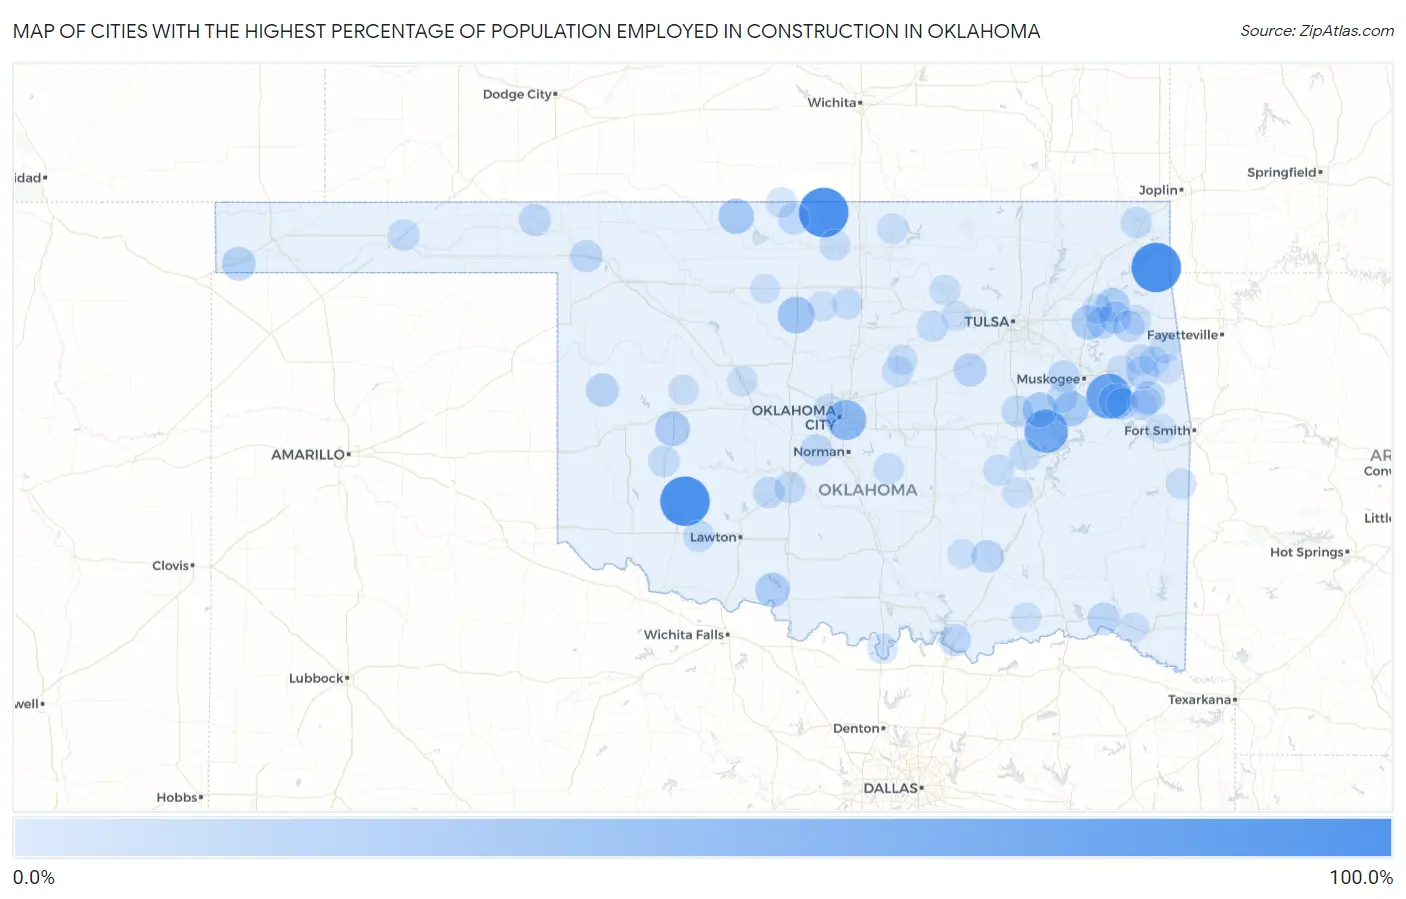
Map of Cities with the Highest Percentage of Population Employed in Construction in Oklahoma
0.0%
100.0%
Cities with the Highest Percentage of Population Employed in Construction in Oklahoma
| City | % Employed | vs State | vs National | |
| 1. | Butler | 100.0% | 7.2%(+92.8)#1 | 6.9%(+93.1)#3 |
| 2. | Renfrow | 100.0% | 7.2%(+92.8)#2 | 6.9%(+93.1)#22 |
| 3. | Cooperton | 100.0% | 7.2%(+92.8)#3 | 6.9%(+93.1)#43 |
| 4. | Sour John | 80.0% | 7.2%(+72.8)#4 | 6.9%(+73.1)#61 |
| 5. | Lakeside | 78.6% | 7.2%(+71.4)#5 | 6.9%(+71.7)#64 |
| 6. | Stidham | 72.7% | 7.2%(+65.6)#6 | 6.9%(+65.9)#81 |
| 7. | Mehan | 70.0% | 7.2%(+62.8)#7 | 6.9%(+63.1)#89 |
| 8. | Moyers | 64.0% | 7.2%(+56.8)#8 | 6.9%(+57.1)#110 |
| 9. | Smith Village | 57.6% | 7.2%(+50.4)#9 | 6.9%(+50.7)#147 |
| 10. | Lovell | 52.0% | 7.2%(+44.8)#10 | 6.9%(+45.1)#196 |
| 11. | Eagle | 50.0% | 7.2%(+42.8)#11 | 6.9%(+43.1)#226 |
| 12. | Bison | 44.4% | 7.2%(+37.3)#12 | 6.9%(+37.6)#282 |
| 13. | Adams | 41.5% | 7.2%(+34.3)#13 | 6.9%(+34.6)#331 |
| 14. | Durham | 40.0% | 7.2%(+32.8)#14 | 6.9%(+33.1)#361 |
| 15. | Mcbride | 39.3% | 7.2%(+32.1)#15 | 6.9%(+32.4)#379 |
| 16. | Notchietown | 38.6% | 7.2%(+31.4)#16 | 6.9%(+31.7)#392 |
| 17. | Burlington | 38.1% | 7.2%(+30.9)#17 | 6.9%(+31.2)#406 |
| 18. | Rentiesville | 37.3% | 7.2%(+30.1)#18 | 6.9%(+30.4)#440 |
| 19. | Moodys | 36.6% | 7.2%(+29.4)#19 | 6.9%(+29.7)#463 |
| 20. | Hitchita | 36.4% | 7.2%(+29.2)#20 | 6.9%(+29.5)#470 |
| 21. | Bessie | 35.8% | 7.2%(+28.6)#21 | 6.9%(+28.9)#486 |
| 22. | Hastings | 34.6% | 7.2%(+27.4)#22 | 6.9%(+27.7)#528 |
| 23. | Mazie | 34.1% | 7.2%(+27.0)#23 | 6.9%(+27.3)#543 |
| 24. | Emet | 33.3% | 7.2%(+26.2)#24 | 6.9%(+26.5)#579 |
| 25. | Utica | 33.3% | 7.2%(+26.2)#25 | 6.9%(+26.5)#580 |
| 26. | Pump Back | 32.6% | 7.2%(+25.4)#26 | 6.9%(+25.7)#622 |
| 27. | Lowrey | 31.9% | 7.2%(+24.7)#27 | 6.9%(+25.0)#643 |
| 28. | Johnson Prairie | 31.1% | 7.2%(+23.9)#28 | 6.9%(+24.2)#684 |
| 29. | Felt | 31.0% | 7.2%(+23.9)#29 | 6.9%(+24.2)#689 |
| 30. | Peckham | 29.6% | 7.2%(+22.5)#30 | 6.9%(+22.8)#767 |
| 31. | Strong City | 28.6% | 7.2%(+21.4)#31 | 6.9%(+21.7)#837 |
| 32. | Honey Hill | 28.3% | 7.2%(+21.1)#32 | 6.9%(+21.4)#863 |
| 33. | Slick | 28.1% | 7.2%(+20.9)#33 | 6.9%(+21.2)#879 |
| 34. | Flute Springs | 27.8% | 7.2%(+20.6)#34 | 6.9%(+20.9)#901 |
| 35. | Greenville | 26.9% | 7.2%(+19.8)#35 | 6.9%(+20.0)#981 |
| 36. | Swink | 26.3% | 7.2%(+19.1)#36 | 6.9%(+19.4)#1,023 |
| 37. | Tenkiller | 26.2% | 7.2%(+19.0)#37 | 6.9%(+19.3)#1,035 |
| 38. | Lehigh | 25.8% | 7.2%(+18.7)#38 | 6.9%(+19.0)#1,055 |
| 39. | Ballou | 25.8% | 7.2%(+18.7)#39 | 6.9%(+19.0)#1,056 |
| 40. | Snake Creek | 25.2% | 7.2%(+18.0)#40 | 6.9%(+18.3)#1,112 |
| 41. | May | 25.0% | 7.2%(+17.8)#41 | 6.9%(+18.1)#1,144 |
| 42. | Knowles | 25.0% | 7.2%(+17.8)#42 | 6.9%(+18.1)#1,151 |
| 43. | Colbert | 24.3% | 7.2%(+17.1)#43 | 6.9%(+17.4)#1,199 |
| 44. | Barber | 23.9% | 7.2%(+16.7)#44 | 6.9%(+17.0)#1,258 |
| 45. | Wakita | 23.5% | 7.2%(+16.4)#45 | 6.9%(+16.7)#1,306 |
| 46. | Bridge Creek | 23.3% | 7.2%(+16.2)#46 | 6.9%(+16.5)#1,340 |
| 47. | Fittstown | 23.3% | 7.2%(+16.2)#47 | 6.9%(+16.5)#1,344 |
| 48. | Teresita | 23.1% | 7.2%(+15.9)#48 | 6.9%(+16.2)#1,373 |
| 49. | Taft | 23.1% | 7.2%(+15.9)#49 | 6.9%(+16.2)#1,375 |
| 50. | Schulter | 22.9% | 7.2%(+15.7)#50 | 6.9%(+16.0)#1,403 |
| 51. | Olive | 22.7% | 7.2%(+15.6)#51 | 6.9%(+15.9)#1,436 |
| 52. | Redbird Smith | 22.6% | 7.2%(+15.5)#52 | 6.9%(+15.8)#1,444 |
| 53. | Cement | 22.5% | 7.2%(+15.3)#53 | 6.9%(+15.6)#1,472 |
| 54. | Optima | 22.0% | 7.2%(+14.9)#54 | 6.9%(+15.2)#1,538 |
| 55. | Sparrowhawk | 22.0% | 7.2%(+14.9)#55 | 6.9%(+15.2)#1,539 |
| 56. | Ninnekah | 21.8% | 7.2%(+14.6)#56 | 6.9%(+14.9)#1,573 |
| 57. | Hanna | 21.7% | 7.2%(+14.6)#57 | 6.9%(+14.9)#1,589 |
| 58. | Welling | 21.6% | 7.2%(+14.4)#58 | 6.9%(+14.7)#1,611 |
| 59. | Rocky | 21.6% | 7.2%(+14.4)#59 | 6.9%(+14.7)#1,614 |
| 60. | Sand Point | 21.6% | 7.2%(+14.4)#60 | 6.9%(+14.7)#1,616 |
| 61. | Dotyville | 21.5% | 7.2%(+14.4)#61 | 6.9%(+14.7)#1,624 |
| 62. | Indiahoma | 21.2% | 7.2%(+14.0)#62 | 6.9%(+14.3)#1,666 |
| 63. | Cottonwood | 21.1% | 7.2%(+13.9)#63 | 6.9%(+14.2)#1,696 |
| 64. | Sportmans Shores | 20.8% | 7.2%(+13.7)#64 | 6.9%(+14.0)#1,735 |
| 65. | Christie | 20.7% | 7.2%(+13.6)#65 | 6.9%(+13.9)#1,758 |
| 66. | Wainwright | 20.5% | 7.2%(+13.3)#66 | 6.9%(+13.6)#1,792 |
| 67. | Yale | 20.4% | 7.2%(+13.2)#67 | 6.9%(+13.5)#1,813 |
| 68. | Haywood | 20.4% | 7.2%(+13.2)#68 | 6.9%(+13.5)#1,819 |
| 69. | Carney | 20.4% | 7.2%(+13.2)#69 | 6.9%(+13.5)#1,820 |
| 70. | Lucien | 19.8% | 7.2%(+12.6)#70 | 6.9%(+12.9)#1,952 |
| 71. | Lamar | 19.7% | 7.2%(+12.5)#71 | 6.9%(+12.8)#1,969 |
| 72. | Baker | 19.4% | 7.2%(+12.2)#72 | 6.9%(+12.5)#2,039 |
| 73. | Blackburn | 19.4% | 7.2%(+12.2)#73 | 6.9%(+12.5)#2,057 |
| 74. | Lamont | 19.0% | 7.2%(+11.8)#74 | 6.9%(+12.1)#2,142 |
| 75. | Tribbey | 18.6% | 7.2%(+11.4)#75 | 6.9%(+11.7)#2,241 |
| 76. | Manchester | 18.6% | 7.2%(+11.4)#76 | 6.9%(+11.7)#2,243 |
| 77. | Marble City | 18.5% | 7.2%(+11.3)#77 | 6.9%(+11.6)#2,274 |
| 78. | Custer City | 18.2% | 7.2%(+11.0)#78 | 6.9%(+11.3)#2,361 |
| 79. | Monroe | 18.2% | 7.2%(+11.0)#79 | 6.9%(+11.3)#2,371 |
| 80. | Greenfield | 18.2% | 7.2%(+11.0)#80 | 6.9%(+11.3)#2,374 |
| 81. | Kildare | 18.2% | 7.2%(+11.0)#81 | 6.9%(+11.3)#2,380 |
| 82. | Thackerville | 17.9% | 7.2%(+10.7)#82 | 6.9%(+11.0)#2,455 |
| 83. | Tryon | 17.6% | 7.2%(+10.5)#83 | 6.9%(+10.8)#2,537 |
| 84. | Arpelar | 17.2% | 7.2%(+10.1)#84 | 6.9%(+10.4)#2,651 |
| 85. | Sportsmen Acres | 17.2% | 7.2%(+9.99)#85 | 6.9%(+10.3)#2,679 |
| 86. | Wauhillau | 17.1% | 7.2%(+9.92)#86 | 6.9%(+10.2)#2,706 |
| 87. | Hennepin | 17.1% | 7.2%(+9.90)#87 | 6.9%(+10.2)#2,720 |
| 88. | Rocky Ford | 16.8% | 7.2%(+9.67)#88 | 6.9%(+9.97)#2,796 |
| 89. | Garvin | 16.7% | 7.2%(+9.50)#89 | 6.9%(+9.79)#2,886 |
| 90. | Terlton | 16.7% | 7.2%(+9.50)#90 | 6.9%(+9.79)#2,905 |
| 91. | Elohim | 16.7% | 7.2%(+9.50)#91 | 6.9%(+9.79)#2,907 |
| 92. | Dwight Mission | 16.7% | 7.2%(+9.50)#92 | 6.9%(+9.79)#2,908 |
| 93. | Douglas | 16.7% | 7.2%(+9.50)#93 | 6.9%(+9.79)#2,909 |
| 94. | Gans | 16.4% | 7.2%(+9.21)#94 | 6.9%(+9.50)#2,998 |
| 95. | Zeb | 16.4% | 7.2%(+9.19)#95 | 6.9%(+9.48)#3,009 |
| 96. | Boswell | 16.3% | 7.2%(+9.11)#96 | 6.9%(+9.40)#3,031 |
| 97. | Clarita | 16.1% | 7.2%(+8.96)#97 | 6.9%(+9.25)#3,083 |
| 98. | Stilwell | 16.1% | 7.2%(+8.96)#98 | 6.9%(+9.25)#3,087 |
| 99. | Meno | 16.1% | 7.2%(+8.91)#99 | 6.9%(+9.21)#3,101 |
| 100. | Warr Acres | 16.1% | 7.2%(+8.90)#100 | 6.9%(+9.19)#3,106 |
Common Questions
What are the Top 10 Cities with the Highest Percentage of Population Employed in Construction in Oklahoma?
Top 10 Cities with the Highest Percentage of Population Employed in Construction in Oklahoma are:
#1
100.0%
#2
100.0%
#3
100.0%
#4
80.0%
#5
72.7%
#6
57.6%
#7
44.4%
#8
38.6%
#9
38.1%
#10
37.3%
What city has the Highest Percentage of Population Employed in Construction in Oklahoma?
Butler has the Highest Percentage of Population Employed in Construction in Oklahoma with 100.0%.
What is the Percentage of Population Employed in Construction in the State of Oklahoma?
Percentage of Population Employed in Construction in Oklahoma is 7.2%.
What is the Percentage of Population Employed in Construction in the United States?
Percentage of Population Employed in Construction in the United States is 6.9%.