Cities with the Highest Percentage of Population Employed in Construction in Texas
RELATED REPORTS & OPTIONS
Construction
Texas
Compare Cities
Map of Cities with the Highest Percentage of Population Employed in Construction in Texas
0.0%
100.0%
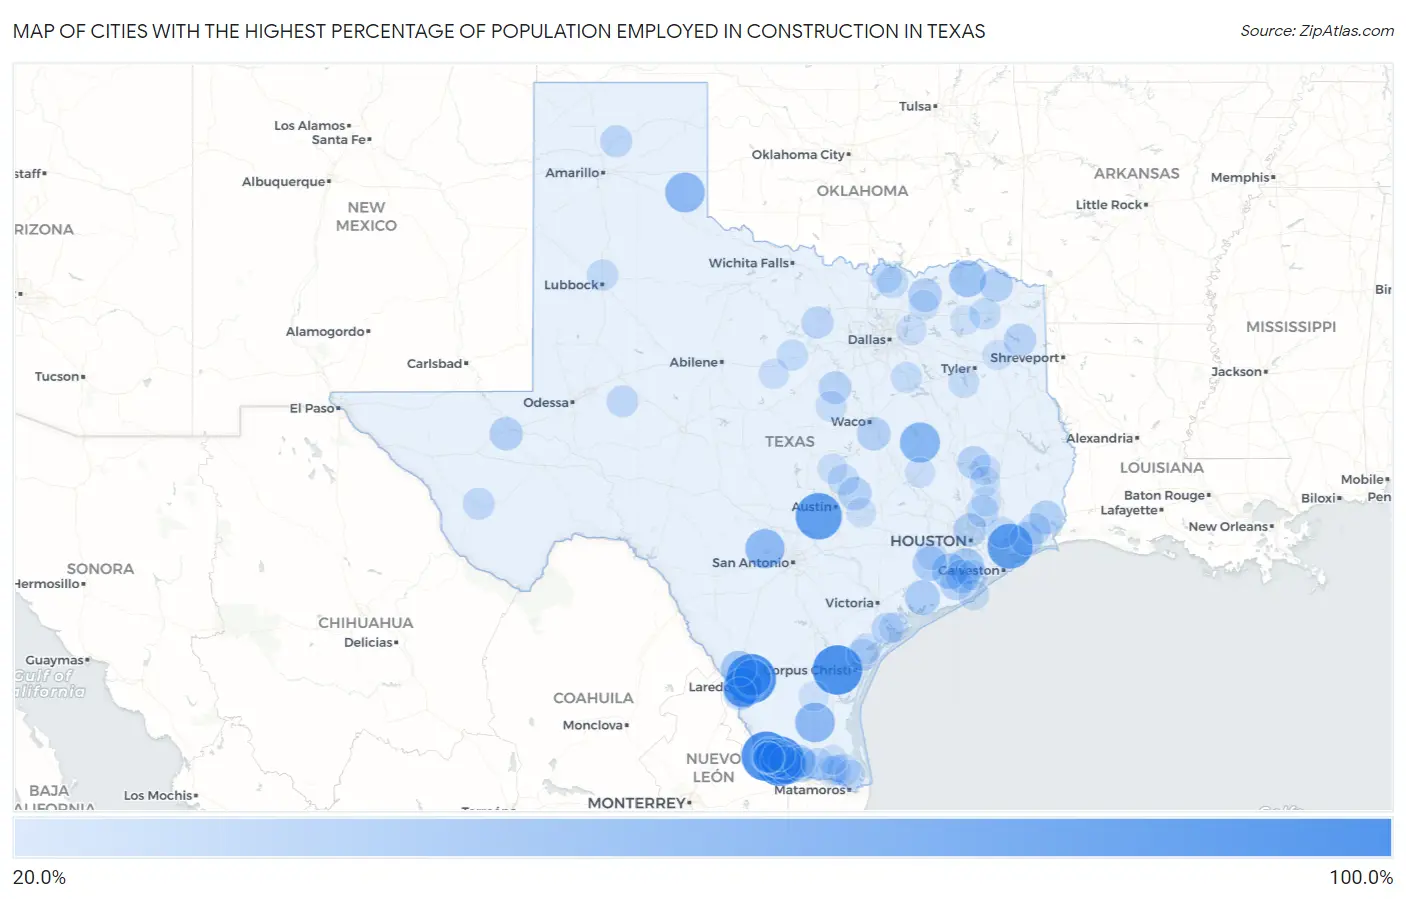
Cities with the Highest Percentage of Population Employed in Construction in Texas
| City | % Employed | vs State | vs National | |
| 1. | Olivia Lopez De Gutierrez | 100.0% | 8.7% (+91.3)#1 | 6.9% (+93.1)#1 |
| 2. | Tierra Verde | 100.0% | 8.7% (+91.3)#2 | 6.9% (+93.1)#8 |
| 3. | Pena | 100.0% | 8.7% (+91.3)#3 | 6.9% (+93.1)#17 |
| 4. | Lopeno | 100.0% | 8.7% (+91.3)#4 | 6.9% (+93.1)#23 |
| 5. | Los Veteranos I | 100.0% | 8.7% (+91.3)#5 | 6.9% (+93.1)#26 |
| 6. | Driftwood | 87.0% | 8.7% (+78.3)#6 | 6.9% (+80.2)#48 |
| 7. | Oak Island | 82.5% | 8.7% (+73.8)#7 | 6.9% (+75.6)#55 |
| 8. | Garciasville | 78.4% | 8.7% (+69.7)#8 | 6.9% (+71.5)#65 |
| 9. | Marquez | 63.0% | 8.7% (+54.3)#9 | 6.9% (+56.2)#114 |
| 10. | San Carlos Ii | 61.7% | 8.7% (+53.0)#10 | 6.9% (+54.8)#124 |
| 11. | Quail | 61.1% | 8.7% (+52.4)#11 | 6.9% (+54.2)#128 |
| 12. | Encino | 60.7% | 8.7% (+52.0)#12 | 6.9% (+53.8)#131 |
| 13. | Lake Medina Shores | 59.2% | 8.7% (+50.5)#13 | 6.9% (+52.3)#138 |
| 14. | Shiro | 58.8% | 8.7% (+50.1)#14 | 6.9% (+51.9)#140 |
| 15. | Tanquecitos South Acres | 57.7% | 8.7% (+49.0)#15 | 6.9% (+50.8)#144 |
| 16. | Nina | 56.2% | 8.7% (+47.5)#16 | 6.9% (+49.3)#162 |
| 17. | Los Fresnos | 53.7% | 8.7% (+45.0)#17 | 6.9% (+46.8)#185 |
| 18. | Proctor | 53.3% | 8.7% (+44.6)#18 | 6.9% (+46.5)#187 |
| 19. | Sun Valley | 50.0% | 8.7% (+41.3)#19 | 6.9% (+43.1)#213 |
| 20. | Colorado Acres | 50.0% | 8.7% (+41.3)#20 | 6.9% (+43.1)#214 |
| 21. | La Puerta | 49.8% | 8.7% (+41.0)#21 | 6.9% (+42.9)#231 |
| 22. | Ranchitos Del Norte | 48.5% | 8.7% (+39.8)#22 | 6.9% (+41.7)#234 |
| 23. | La Esperanza | 46.7% | 8.7% (+38.0)#23 | 6.9% (+39.8)#250 |
| 24. | Rosharon | 46.4% | 8.7% (+37.7)#24 | 6.9% (+39.5)#254 |
| 25. | Airport Heights | 46.2% | 8.7% (+37.4)#25 | 6.9% (+39.3)#256 |
| 26. | Botines | 46.2% | 8.7% (+37.4)#26 | 6.9% (+39.3)#259 |
| 27. | Miguel Barrera | 45.5% | 8.7% (+36.7)#27 | 6.9% (+38.6)#263 |
| 28. | Damon | 45.5% | 8.7% (+36.7)#28 | 6.9% (+38.6)#264 |
| 29. | Mound | 43.4% | 8.7% (+34.7)#29 | 6.9% (+36.5)#298 |
| 30. | Santa Cruz | 42.4% | 8.7% (+33.7)#30 | 6.9% (+35.5)#311 |
| 31. | Blessing | 42.3% | 8.7% (+33.6)#31 | 6.9% (+35.4)#314 |
| 32. | Hungerford | 41.4% | 8.7% (+32.7)#32 | 6.9% (+34.5)#333 |
| 33. | West Sharyland | 41.4% | 8.7% (+32.7)#33 | 6.9% (+34.5)#334 |
| 34. | Rose City | 38.4% | 8.7% (+29.6)#34 | 6.9% (+31.5)#400 |
| 35. | Bailey | 37.7% | 8.7% (+29.0)#35 | 6.9% (+30.9)#418 |
| 36. | Golinda | 37.6% | 8.7% (+28.8)#36 | 6.9% (+30.7)#424 |
| 37. | Holiday Lakes | 37.5% | 8.7% (+28.8)#37 | 6.9% (+30.7)#425 |
| 38. | Aldine | 37.0% | 8.7% (+28.3)#38 | 6.9% (+30.1)#449 |
| 39. | Annona | 36.8% | 8.7% (+28.1)#39 | 6.9% (+30.0)#455 |
| 40. | Citrus City | 36.7% | 8.7% (+28.0)#40 | 6.9% (+29.9)#458 |
| 41. | Lindsay | 36.7% | 8.7% (+28.0)#41 | 6.9% (+29.8)#461 |
| 42. | Stowell | 36.6% | 8.7% (+27.9)#42 | 6.9% (+29.7)#464 |
| 43. | Coupland | 36.3% | 8.7% (+27.6)#43 | 6.9% (+29.4)#474 |
| 44. | Westwood Shores | 35.7% | 8.7% (+27.0)#44 | 6.9% (+28.9)#487 |
| 45. | La Presa | 35.6% | 8.7% (+26.9)#45 | 6.9% (+28.8)#491 |
| 46. | Wild Peach Village | 34.6% | 8.7% (+25.9)#46 | 6.9% (+27.7)#529 |
| 47. | Pine Harbor | 34.4% | 8.7% (+25.7)#47 | 6.9% (+27.5)#534 |
| 48. | Walnut Springs | 34.2% | 8.7% (+25.5)#48 | 6.9% (+27.4)#540 |
| 49. | Pablo Pena | 33.8% | 8.7% (+25.0)#49 | 6.9% (+26.9)#557 |
| 50. | La Carla | 33.3% | 8.7% (+24.6)#50 | 6.9% (+26.5)#573 |
| 51. | Oklaunion | 33.3% | 8.7% (+24.6)#51 | 6.9% (+26.5)#575 |
| 52. | Lake Meredith Estates | 32.7% | 8.7% (+24.0)#52 | 6.9% (+25.8)#616 |
| 53. | Perrin | 32.6% | 8.7% (+23.9)#53 | 6.9% (+25.7)#620 |
| 54. | Arroyo Colorado Estates | 32.4% | 8.7% (+23.7)#54 | 6.9% (+25.6)#624 |
| 55. | Magnolia Beach | 32.1% | 8.7% (+23.4)#55 | 6.9% (+25.3)#633 |
| 56. | Tradewinds | 31.9% | 8.7% (+23.2)#56 | 6.9% (+25.0)#644 |
| 57. | Campo Verde | 31.8% | 8.7% (+23.0)#57 | 6.9% (+24.9)#653 |
| 58. | Patton Village | 31.7% | 8.7% (+23.0)#58 | 6.9% (+24.9)#654 |
| 59. | Austwell | 31.6% | 8.7% (+22.9)#59 | 6.9% (+24.7)#663 |
| 60. | Myra | 31.3% | 8.7% (+22.6)#60 | 6.9% (+24.5)#673 |
| 61. | Garden City | 31.3% | 8.7% (+22.6)#61 | 6.9% (+24.4)#677 |
| 62. | Marfa | 31.3% | 8.7% (+22.6)#62 | 6.9% (+24.4)#678 |
| 63. | San Carlos | 30.6% | 8.7% (+21.9)#63 | 6.9% (+23.7)#710 |
| 64. | Fannett | 30.4% | 8.7% (+21.7)#64 | 6.9% (+23.6)#717 |
| 65. | Miller S Cove | 30.0% | 8.7% (+21.3)#65 | 6.9% (+23.1)#745 |
| 66. | Southmayd | 29.5% | 8.7% (+20.8)#66 | 6.9% (+22.7)#770 |
| 67. | The Homesteads | 29.5% | 8.7% (+20.8)#67 | 6.9% (+22.6)#772 |
| 68. | Old River Winfree | 29.4% | 8.7% (+20.7)#68 | 6.9% (+22.5)#783 |
| 69. | New Deal | 29.2% | 8.7% (+20.5)#69 | 6.9% (+22.3)#790 |
| 70. | Weir | 28.8% | 8.7% (+20.1)#70 | 6.9% (+21.9)#810 |
| 71. | Rice | 28.5% | 8.7% (+19.8)#71 | 6.9% (+21.7)#843 |
| 72. | Strawn | 28.5% | 8.7% (+19.8)#72 | 6.9% (+21.6)#845 |
| 73. | Sadler | 28.4% | 8.7% (+19.7)#73 | 6.9% (+21.5)#852 |
| 74. | New Ulm | 27.9% | 8.7% (+19.2)#74 | 6.9% (+21.0)#891 |
| 75. | Santo | 27.8% | 8.7% (+19.1)#75 | 6.9% (+21.0)#899 |
| 76. | Cranfills Gap | 27.7% | 8.7% (+19.0)#76 | 6.9% (+20.8)#907 |
| 77. | Onalaska | 27.6% | 8.7% (+18.9)#77 | 6.9% (+20.7)#912 |
| 78. | La Feria North | 27.6% | 8.7% (+18.9)#78 | 6.9% (+20.7)#914 |
| 79. | Quintana | 27.3% | 8.7% (+18.6)#79 | 6.9% (+20.4)#949 |
| 80. | Coffee City | 26.7% | 8.7% (+18.0)#80 | 6.9% (+19.8)#997 |
| 81. | Wadsworth | 26.5% | 8.7% (+17.8)#81 | 6.9% (+19.7)#1,007 |
| 82. | Bayside | 26.4% | 8.7% (+17.7)#82 | 6.9% (+19.5)#1,015 |
| 83. | Danbury | 26.3% | 8.7% (+17.6)#83 | 6.9% (+19.4)#1,024 |
| 84. | Juarez | 26.3% | 8.7% (+17.5)#84 | 6.9% (+19.4)#1,027 |
| 85. | Mobile City | 26.3% | 8.7% (+17.5)#85 | 6.9% (+19.4)#1,028 |
| 86. | East Bernard | 25.9% | 8.7% (+17.2)#86 | 6.9% (+19.0)#1,051 |
| 87. | Los Barreras | 25.7% | 8.7% (+17.0)#87 | 6.9% (+18.8)#1,066 |
| 88. | Carbon | 25.7% | 8.7% (+17.0)#88 | 6.9% (+18.8)#1,067 |
| 89. | Florence | 25.5% | 8.7% (+16.7)#89 | 6.9% (+18.6)#1,088 |
| 90. | Kurten | 25.4% | 8.7% (+16.7)#90 | 6.9% (+18.5)#1,090 |
| 91. | Laureles | 25.4% | 8.7% (+16.7)#91 | 6.9% (+18.5)#1,091 |
| 92. | Seadrift | 25.4% | 8.7% (+16.7)#92 | 6.9% (+18.5)#1,094 |
| 93. | Cape Royale | 25.2% | 8.7% (+16.5)#93 | 6.9% (+18.4)#1,103 |
| 94. | Celeste | 25.1% | 8.7% (+16.4)#94 | 6.9% (+18.2)#1,119 |
| 95. | Como | 25.0% | 8.7% (+16.3)#95 | 6.9% (+18.1)#1,123 |
| 96. | Warren City | 25.0% | 8.7% (+16.3)#96 | 6.9% (+18.1)#1,125 |
| 97. | North Cleveland | 25.0% | 8.7% (+16.3)#97 | 6.9% (+18.1)#1,129 |
| 98. | Camp Swift | 24.9% | 8.7% (+16.2)#98 | 6.9% (+18.0)#1,154 |
| 99. | Premont | 24.7% | 8.7% (+16.0)#99 | 6.9% (+17.9)#1,160 |
| 100. | Sebastian | 24.7% | 8.7% (+16.0)#100 | 6.9% (+17.8)#1,164 |
Common Questions
What are the Top 10 Cities with the Highest Percentage of Population Employed in Construction in Texas?
Top 10 Cities with the Highest Percentage of Population Employed in Construction in Texas are:
#1
100.0%
#2
100.0%
#3
100.0%
#4
100.0%
#5
87.0%
#6
82.5%
#7
78.4%
#8
63.0%
#9
61.7%
#10
61.1%
What city has the Highest Percentage of Population Employed in Construction in Texas?
Olivia Lopez de Gutierrez has the Highest Percentage of Population Employed in Construction in Texas with 100.0%.
What is the Percentage of Population Employed in Construction in the State of Texas?
Percentage of Population Employed in Construction in Texas is 8.7%.
What is the Percentage of Population Employed in Construction in the United States?
Percentage of Population Employed in Construction in the United States is 6.9%.